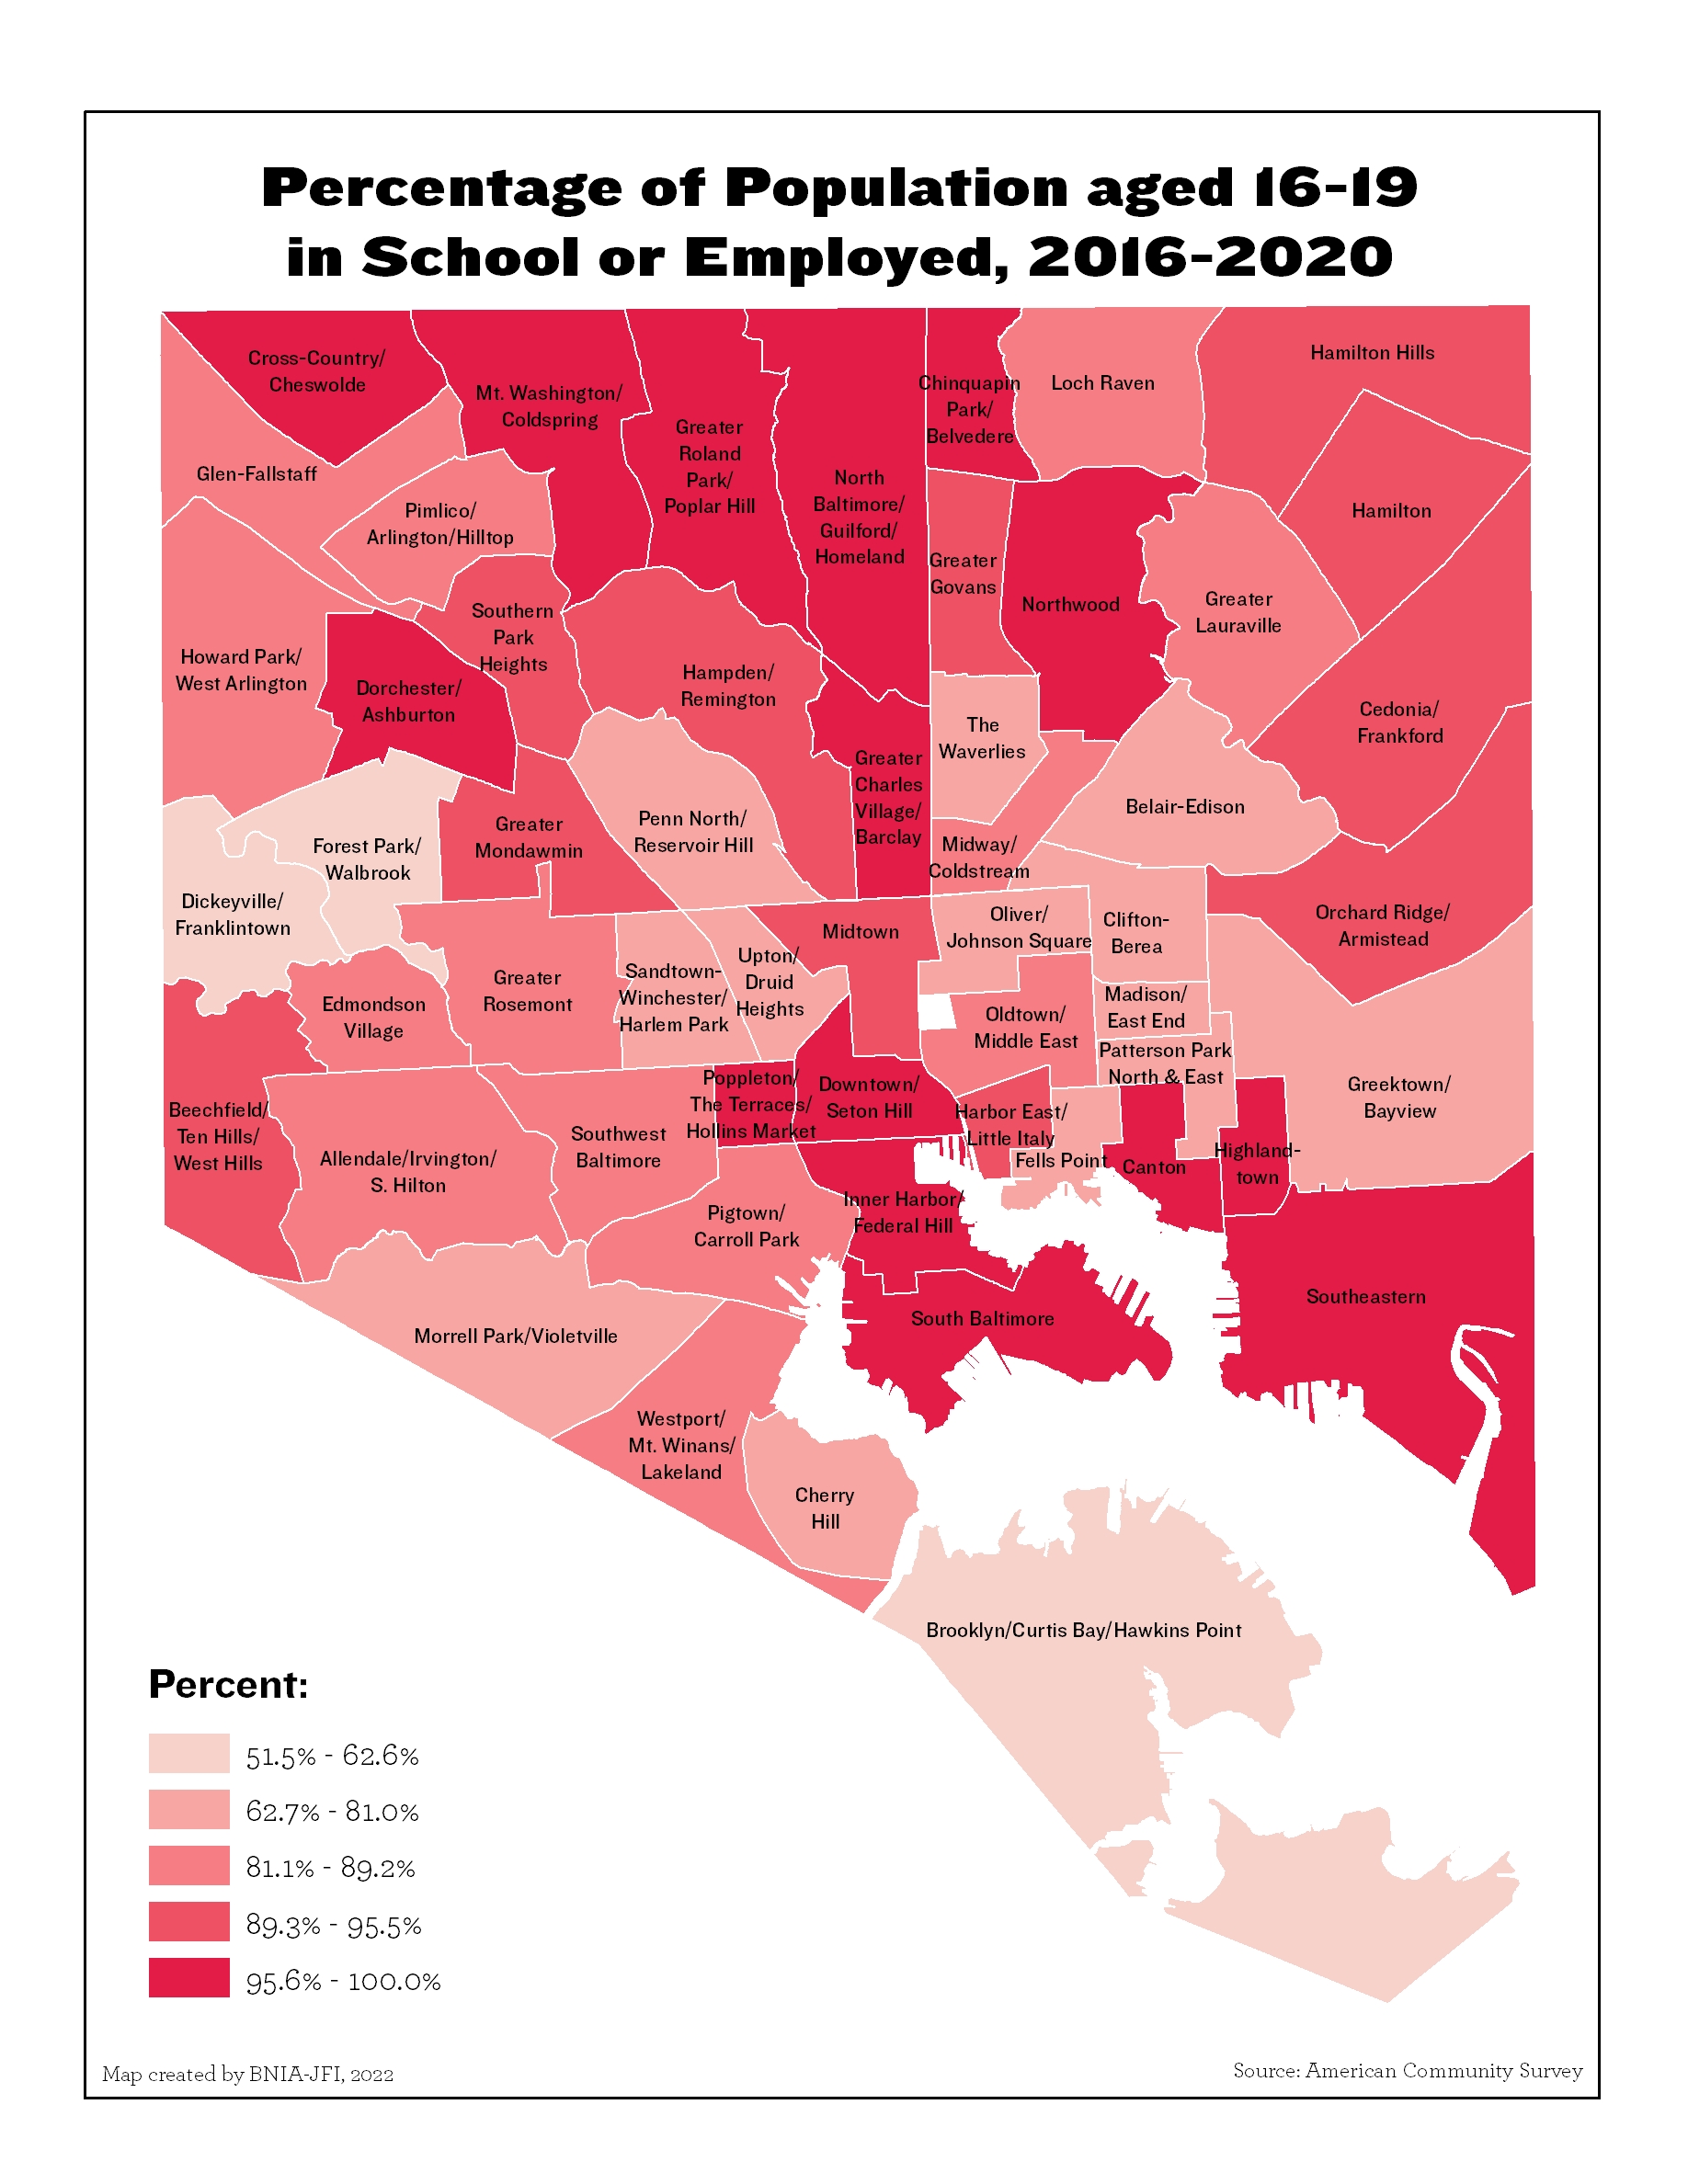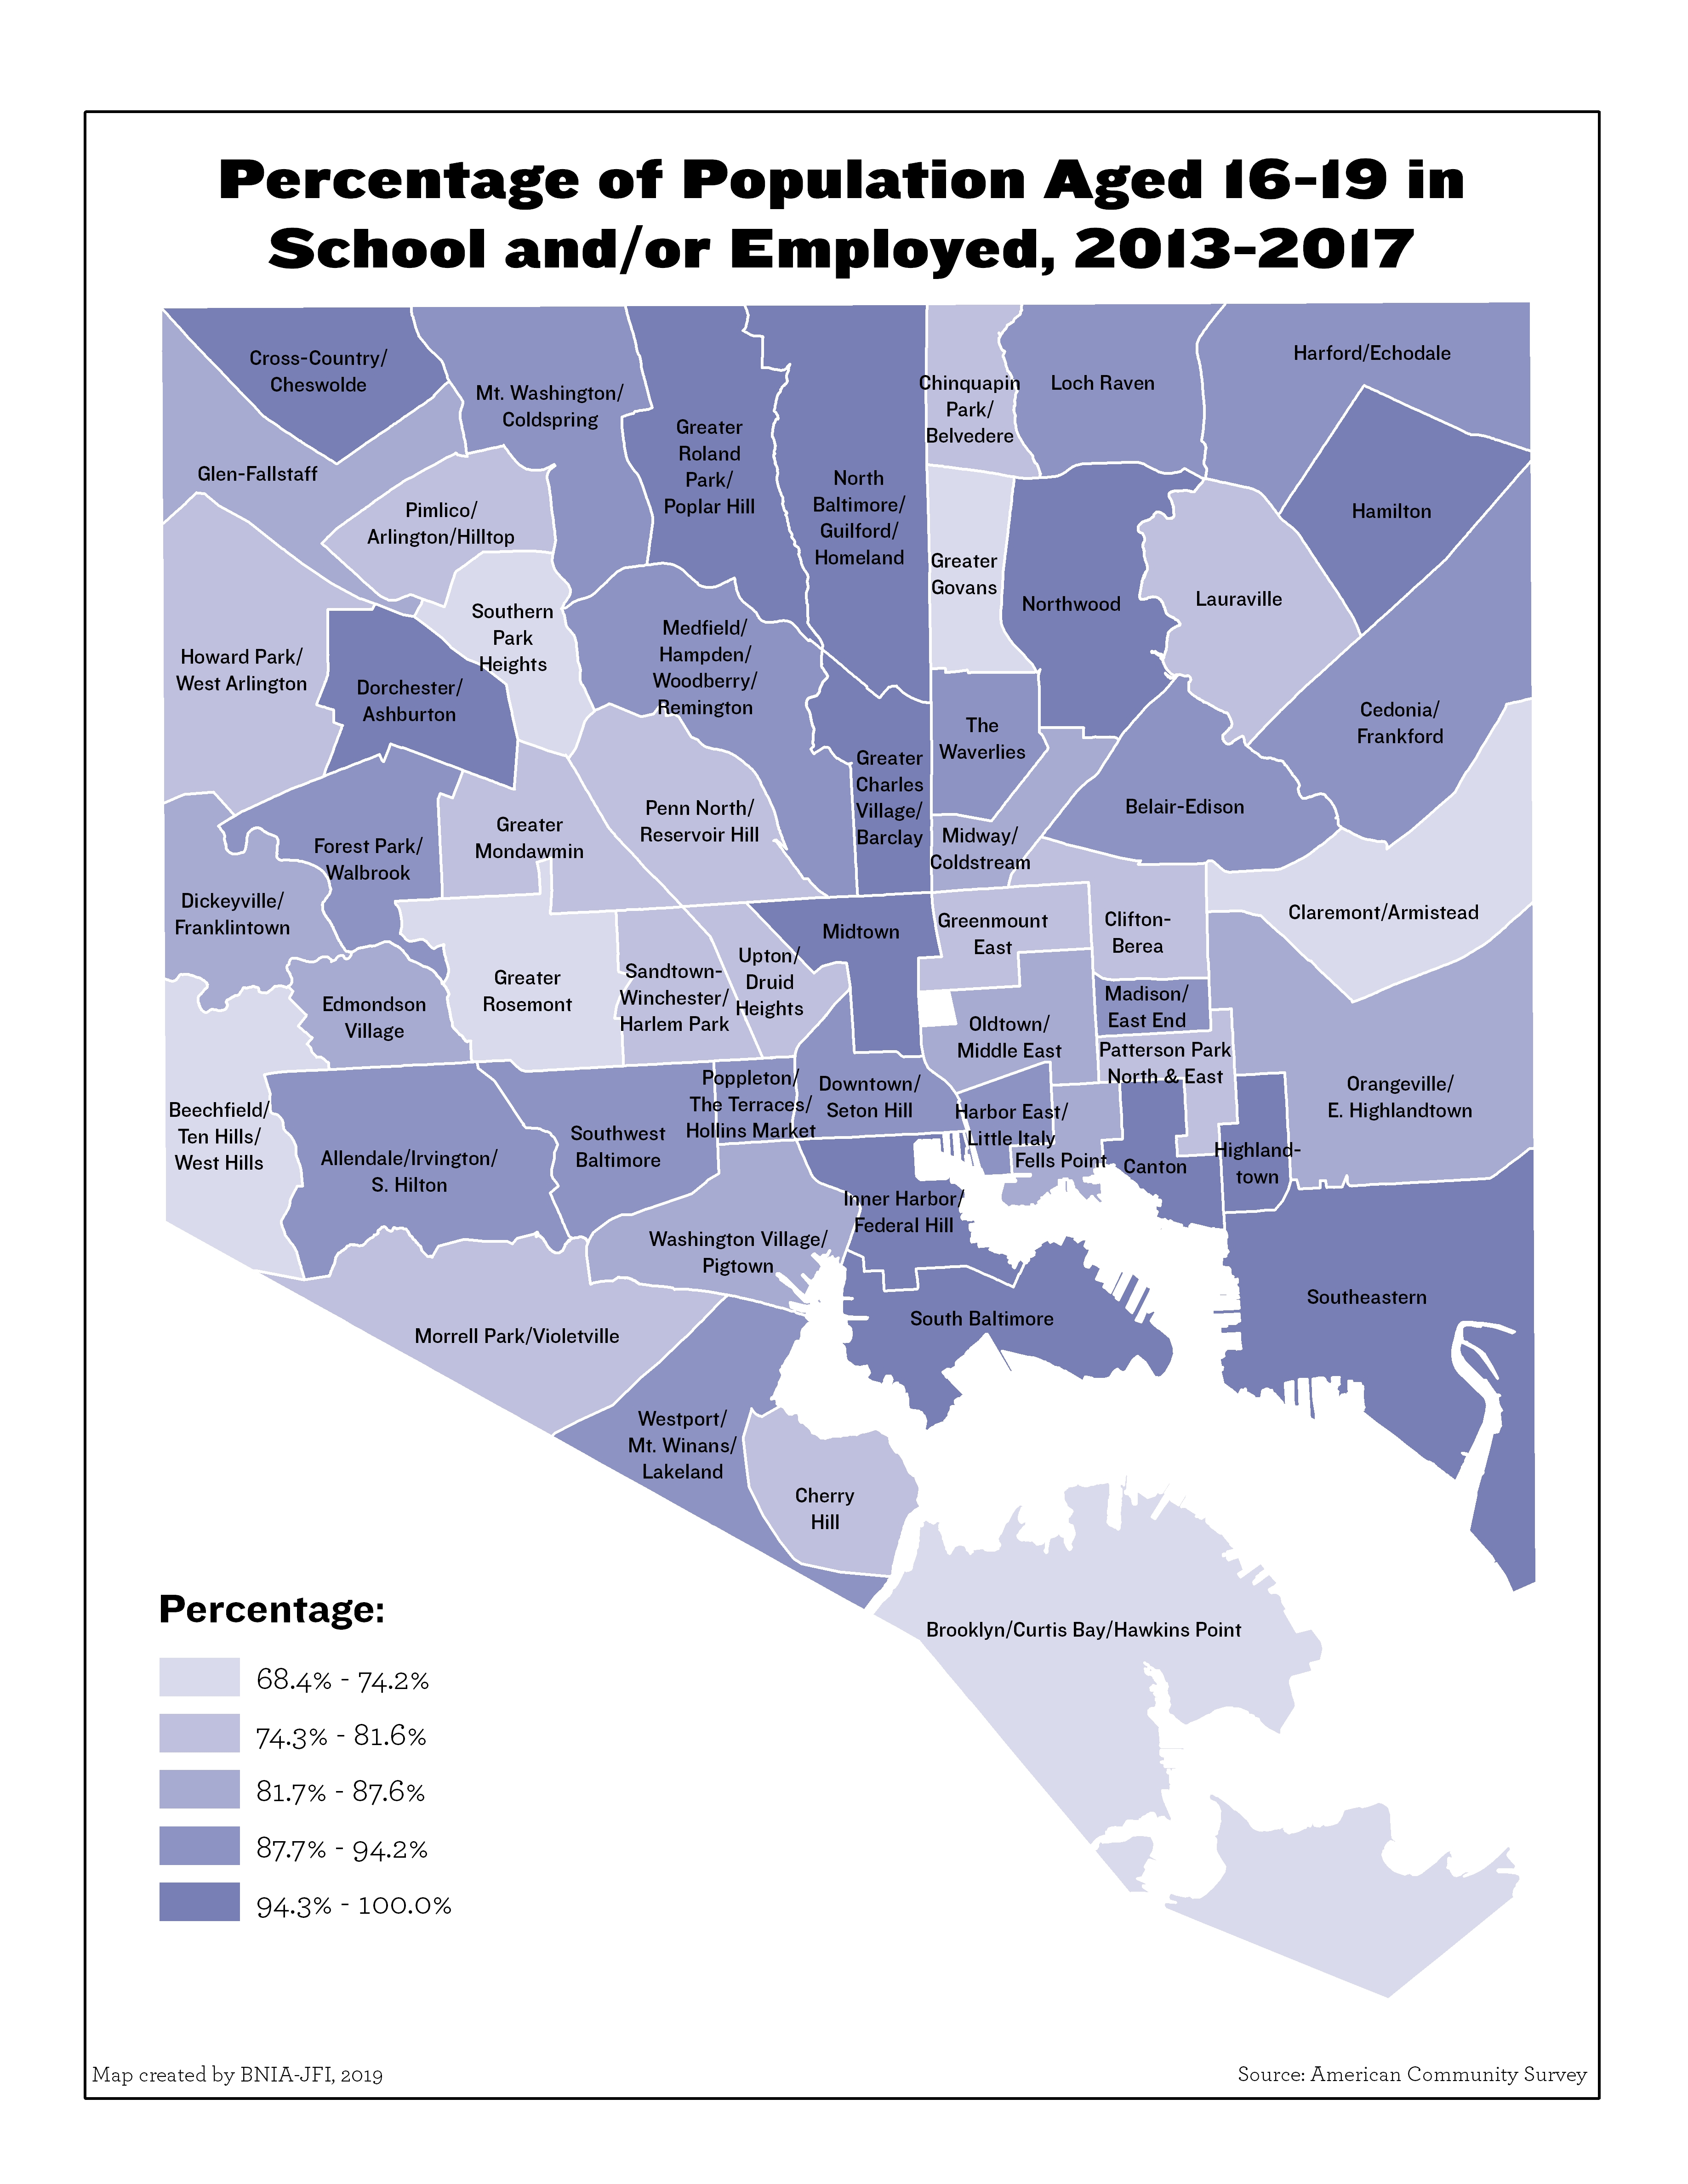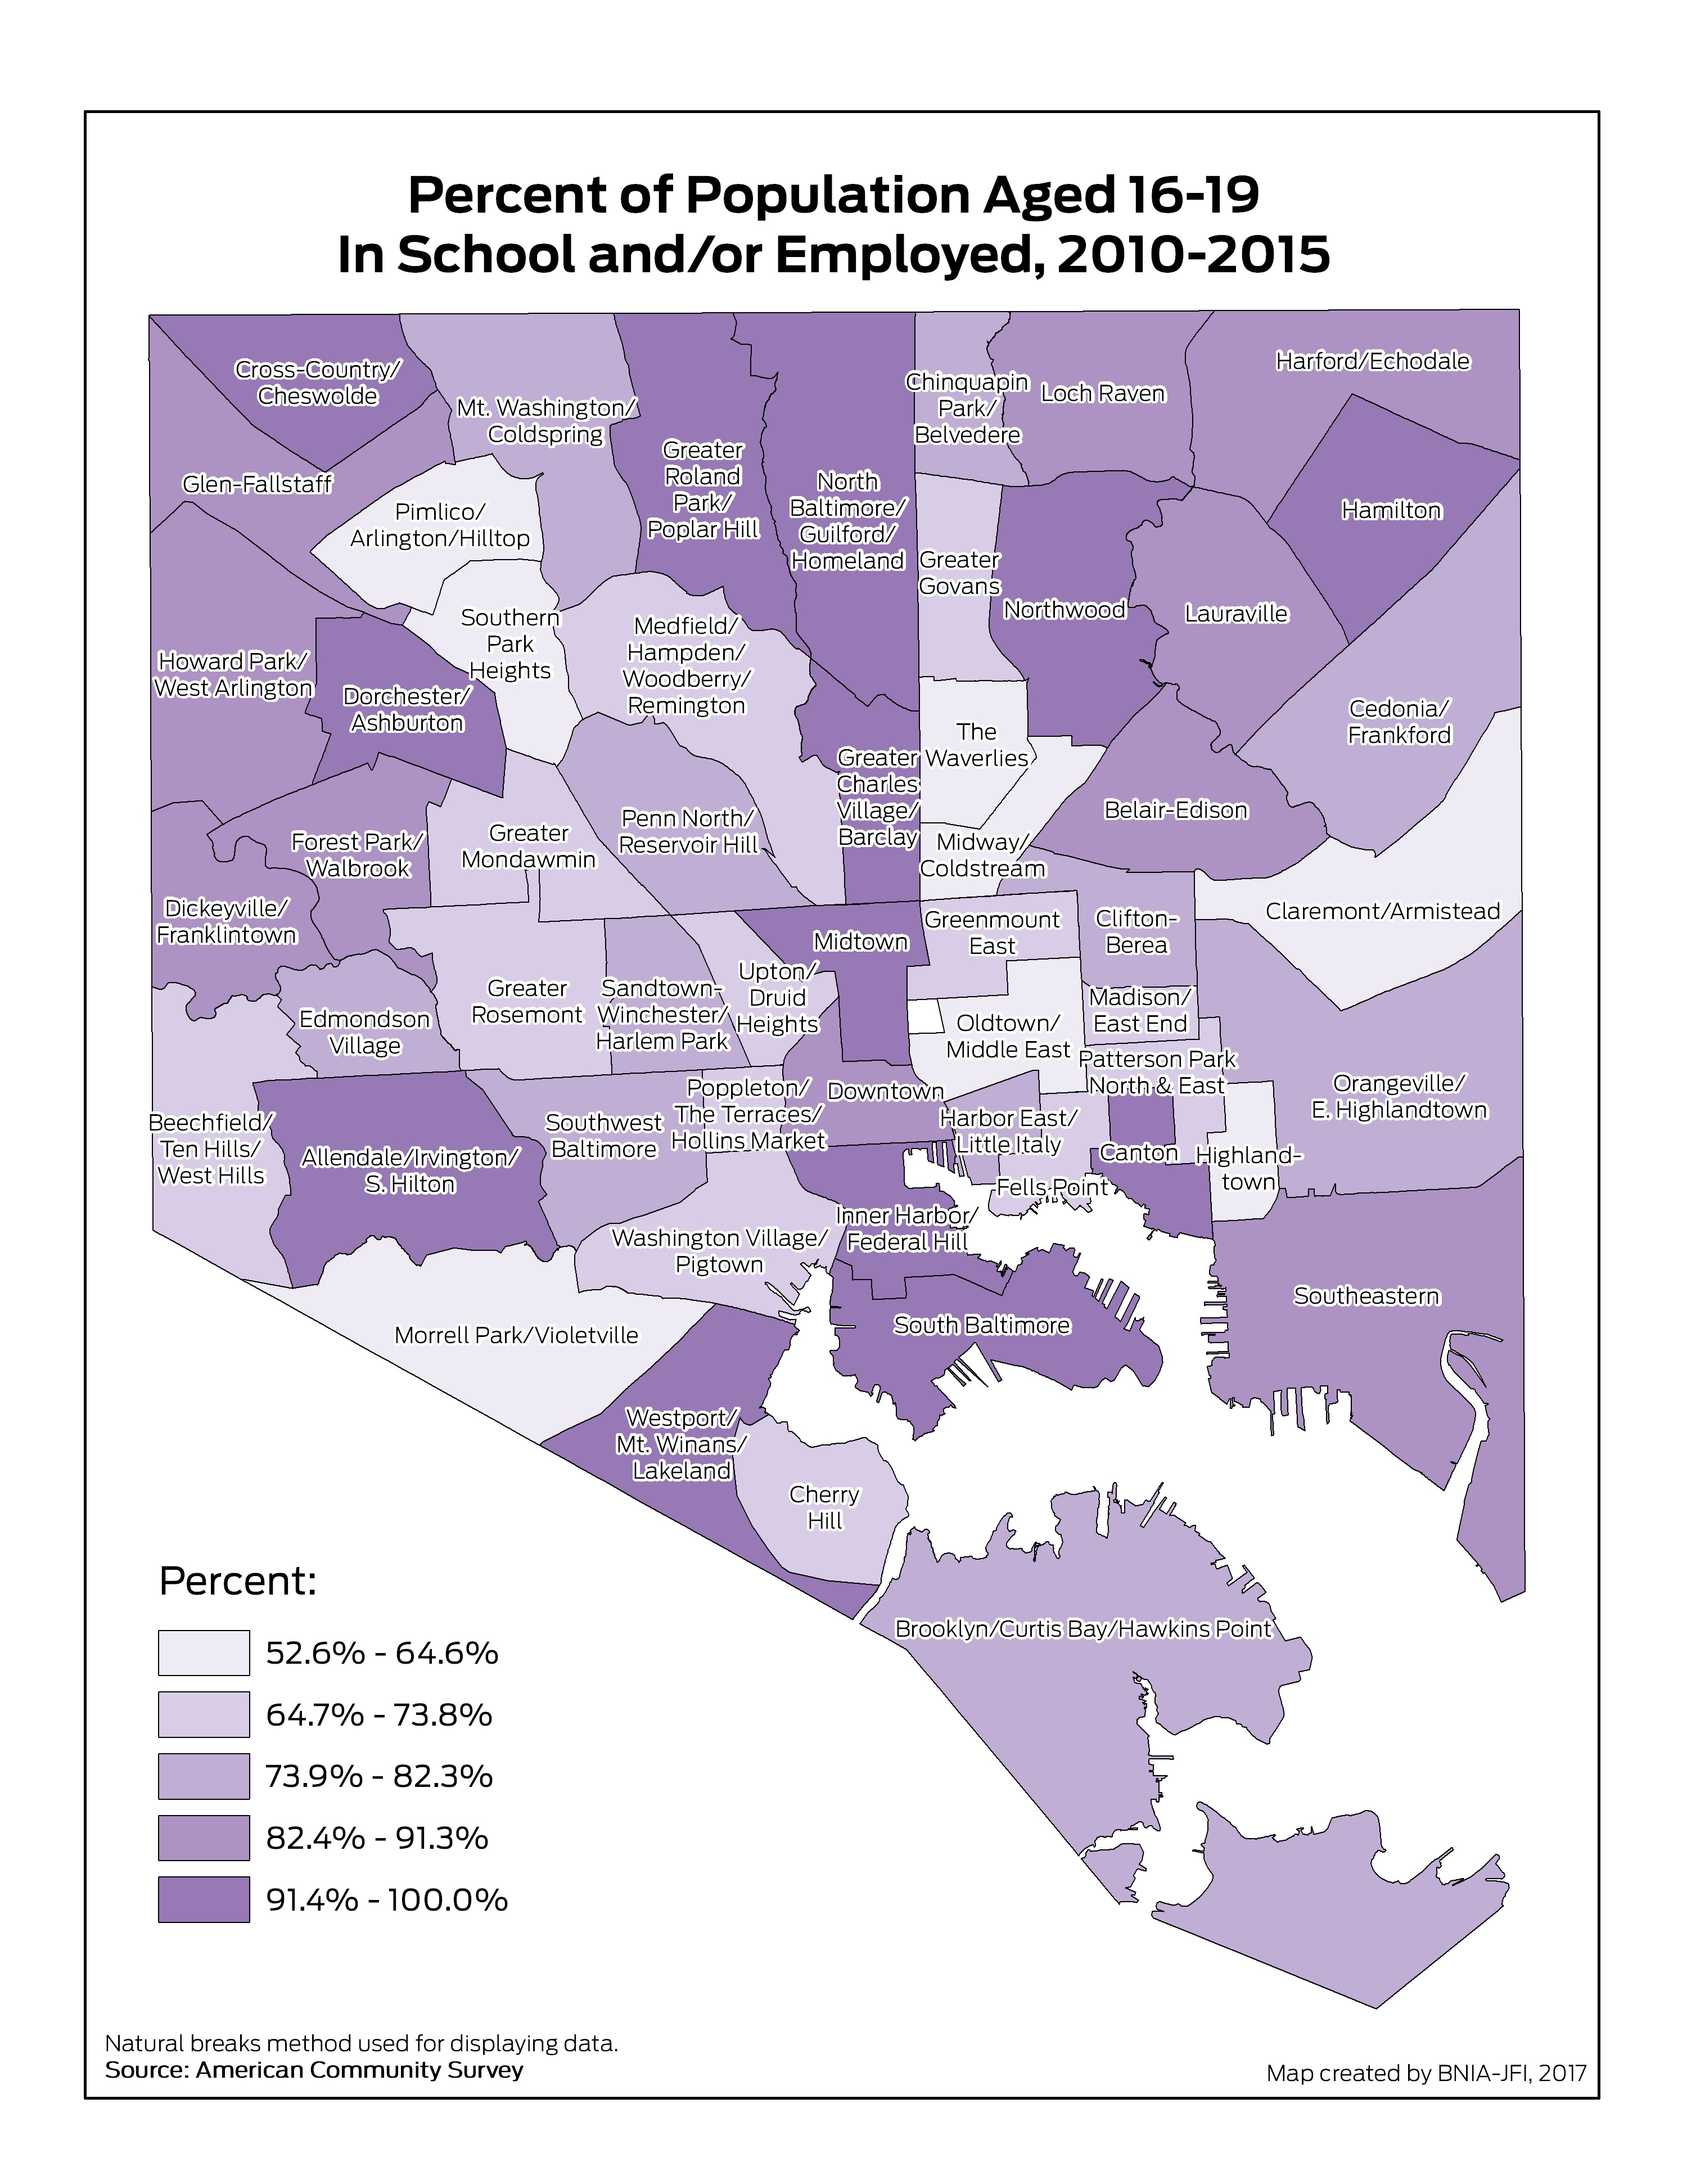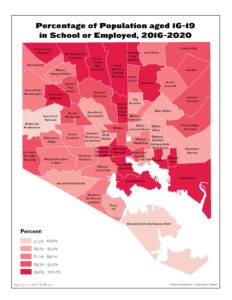
Percentage of Population aged 16-19 in School or Employed (2020)

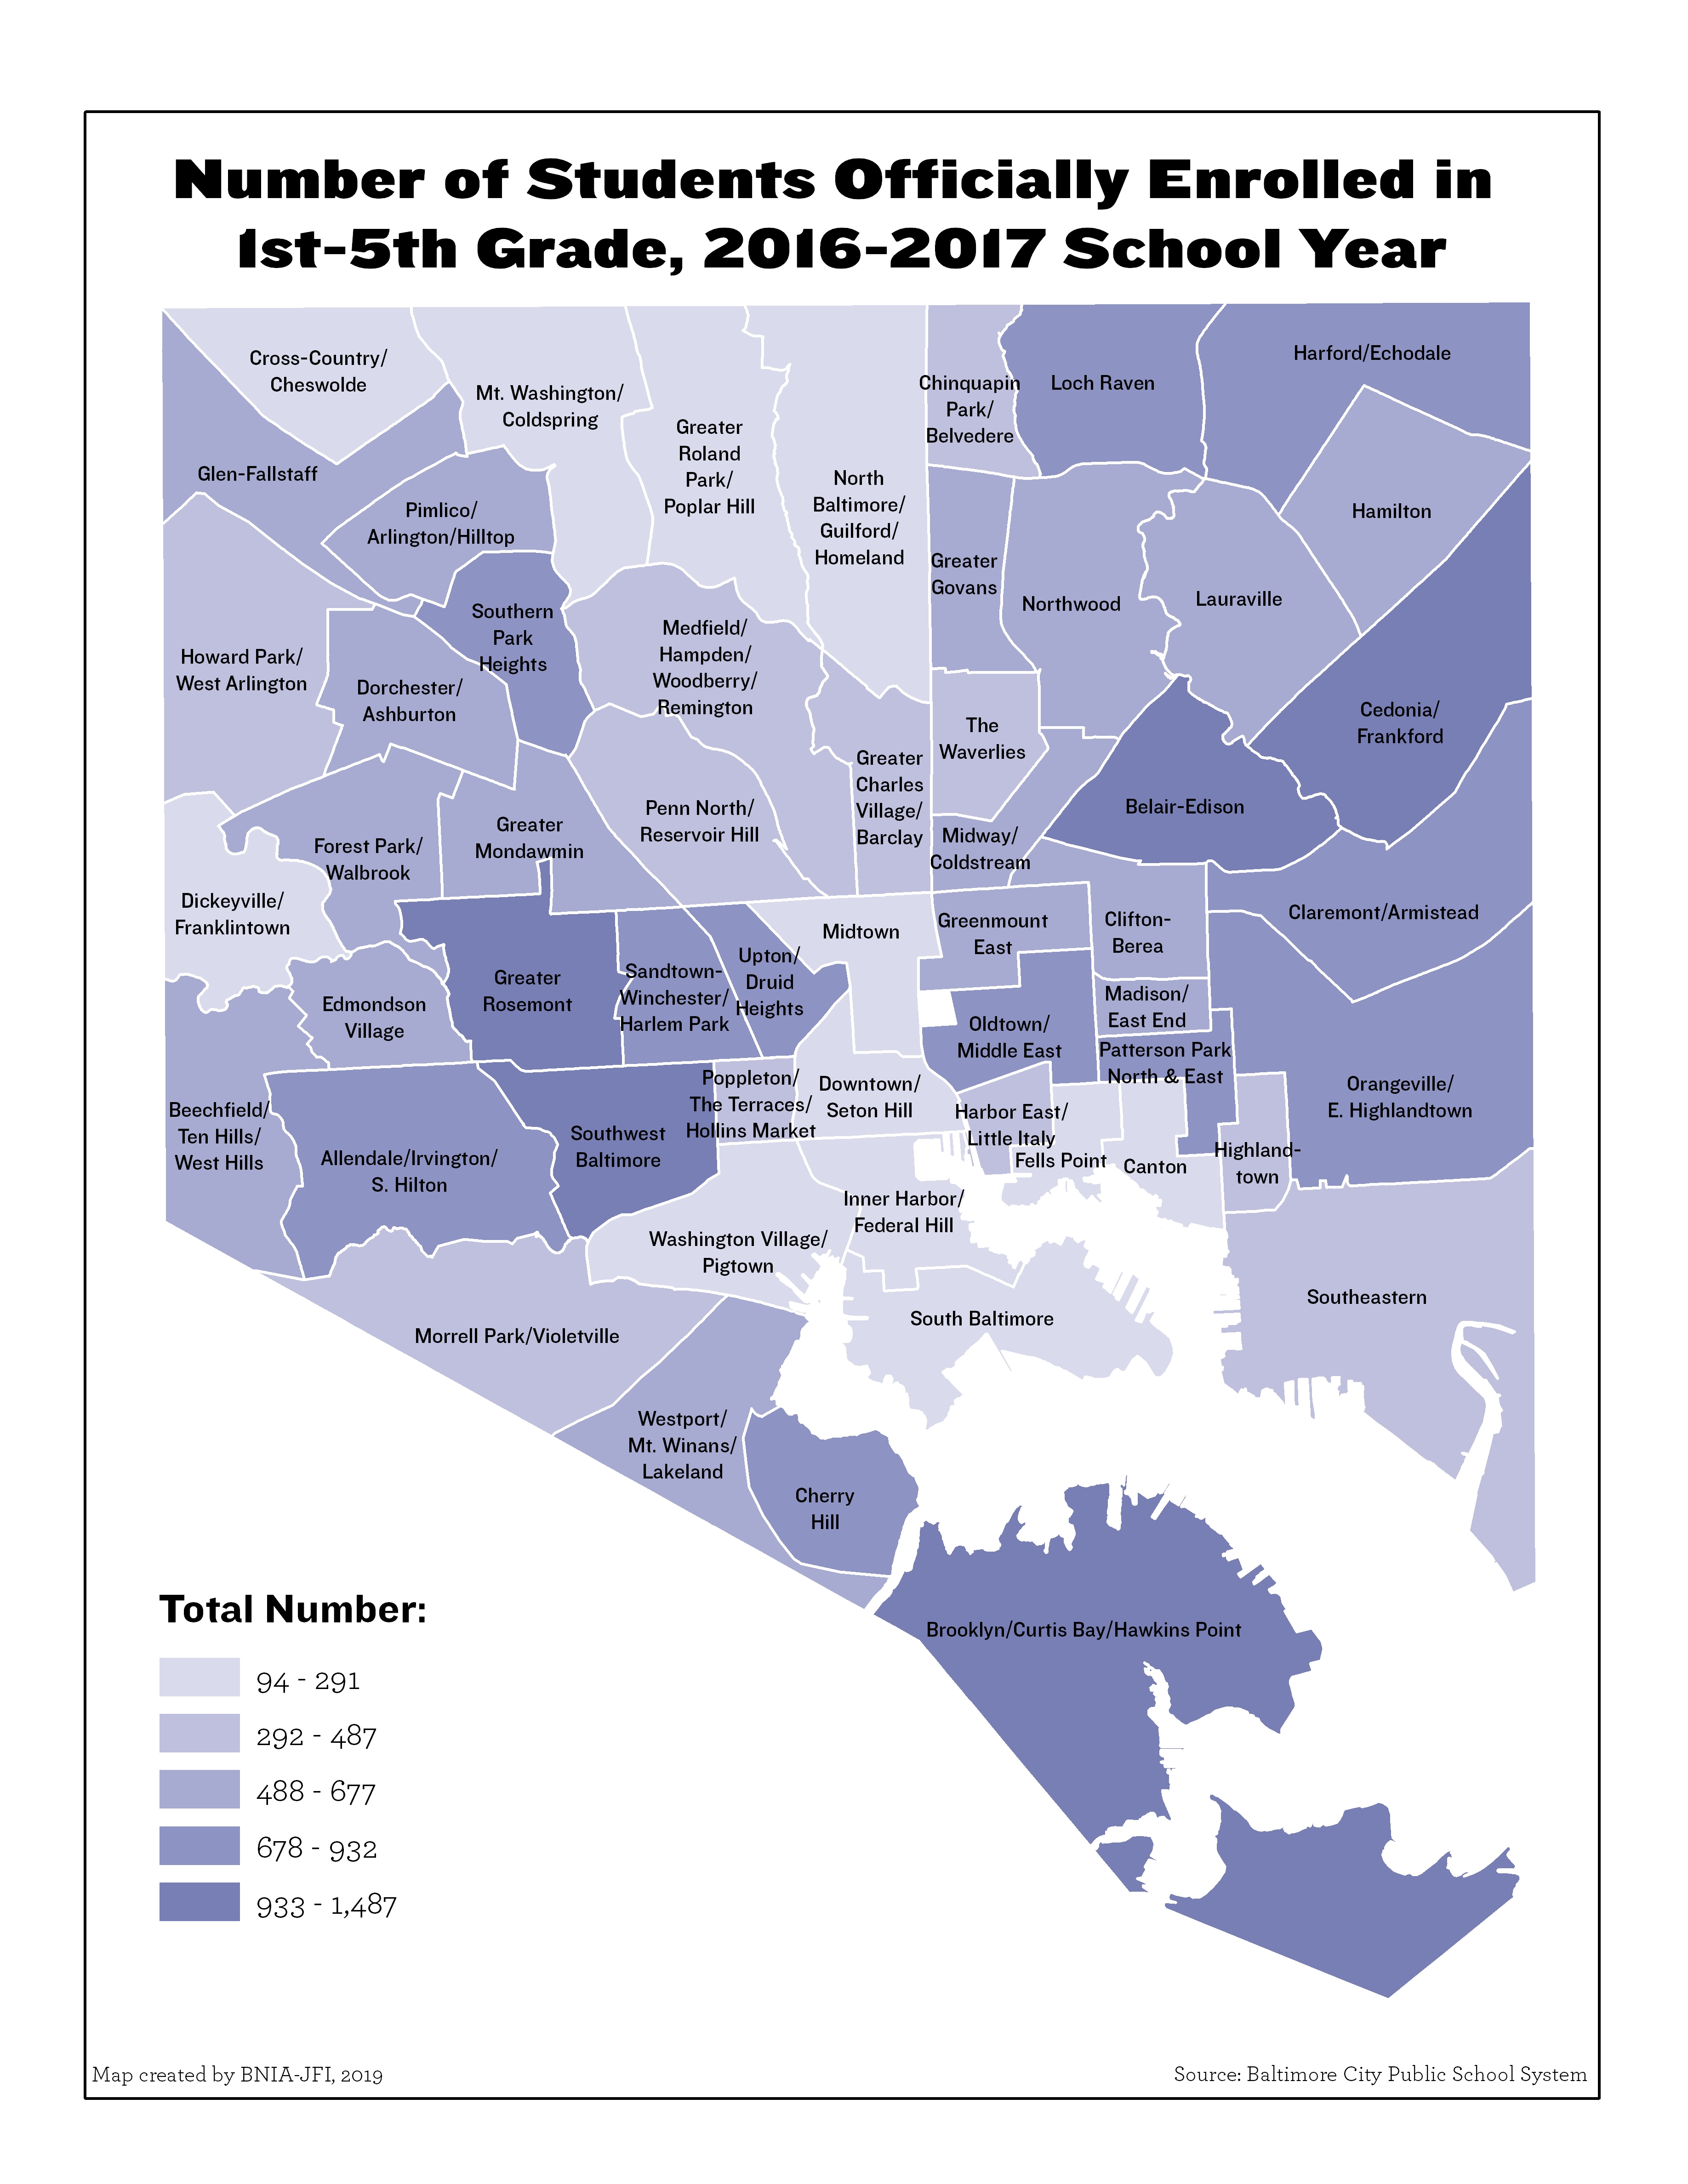
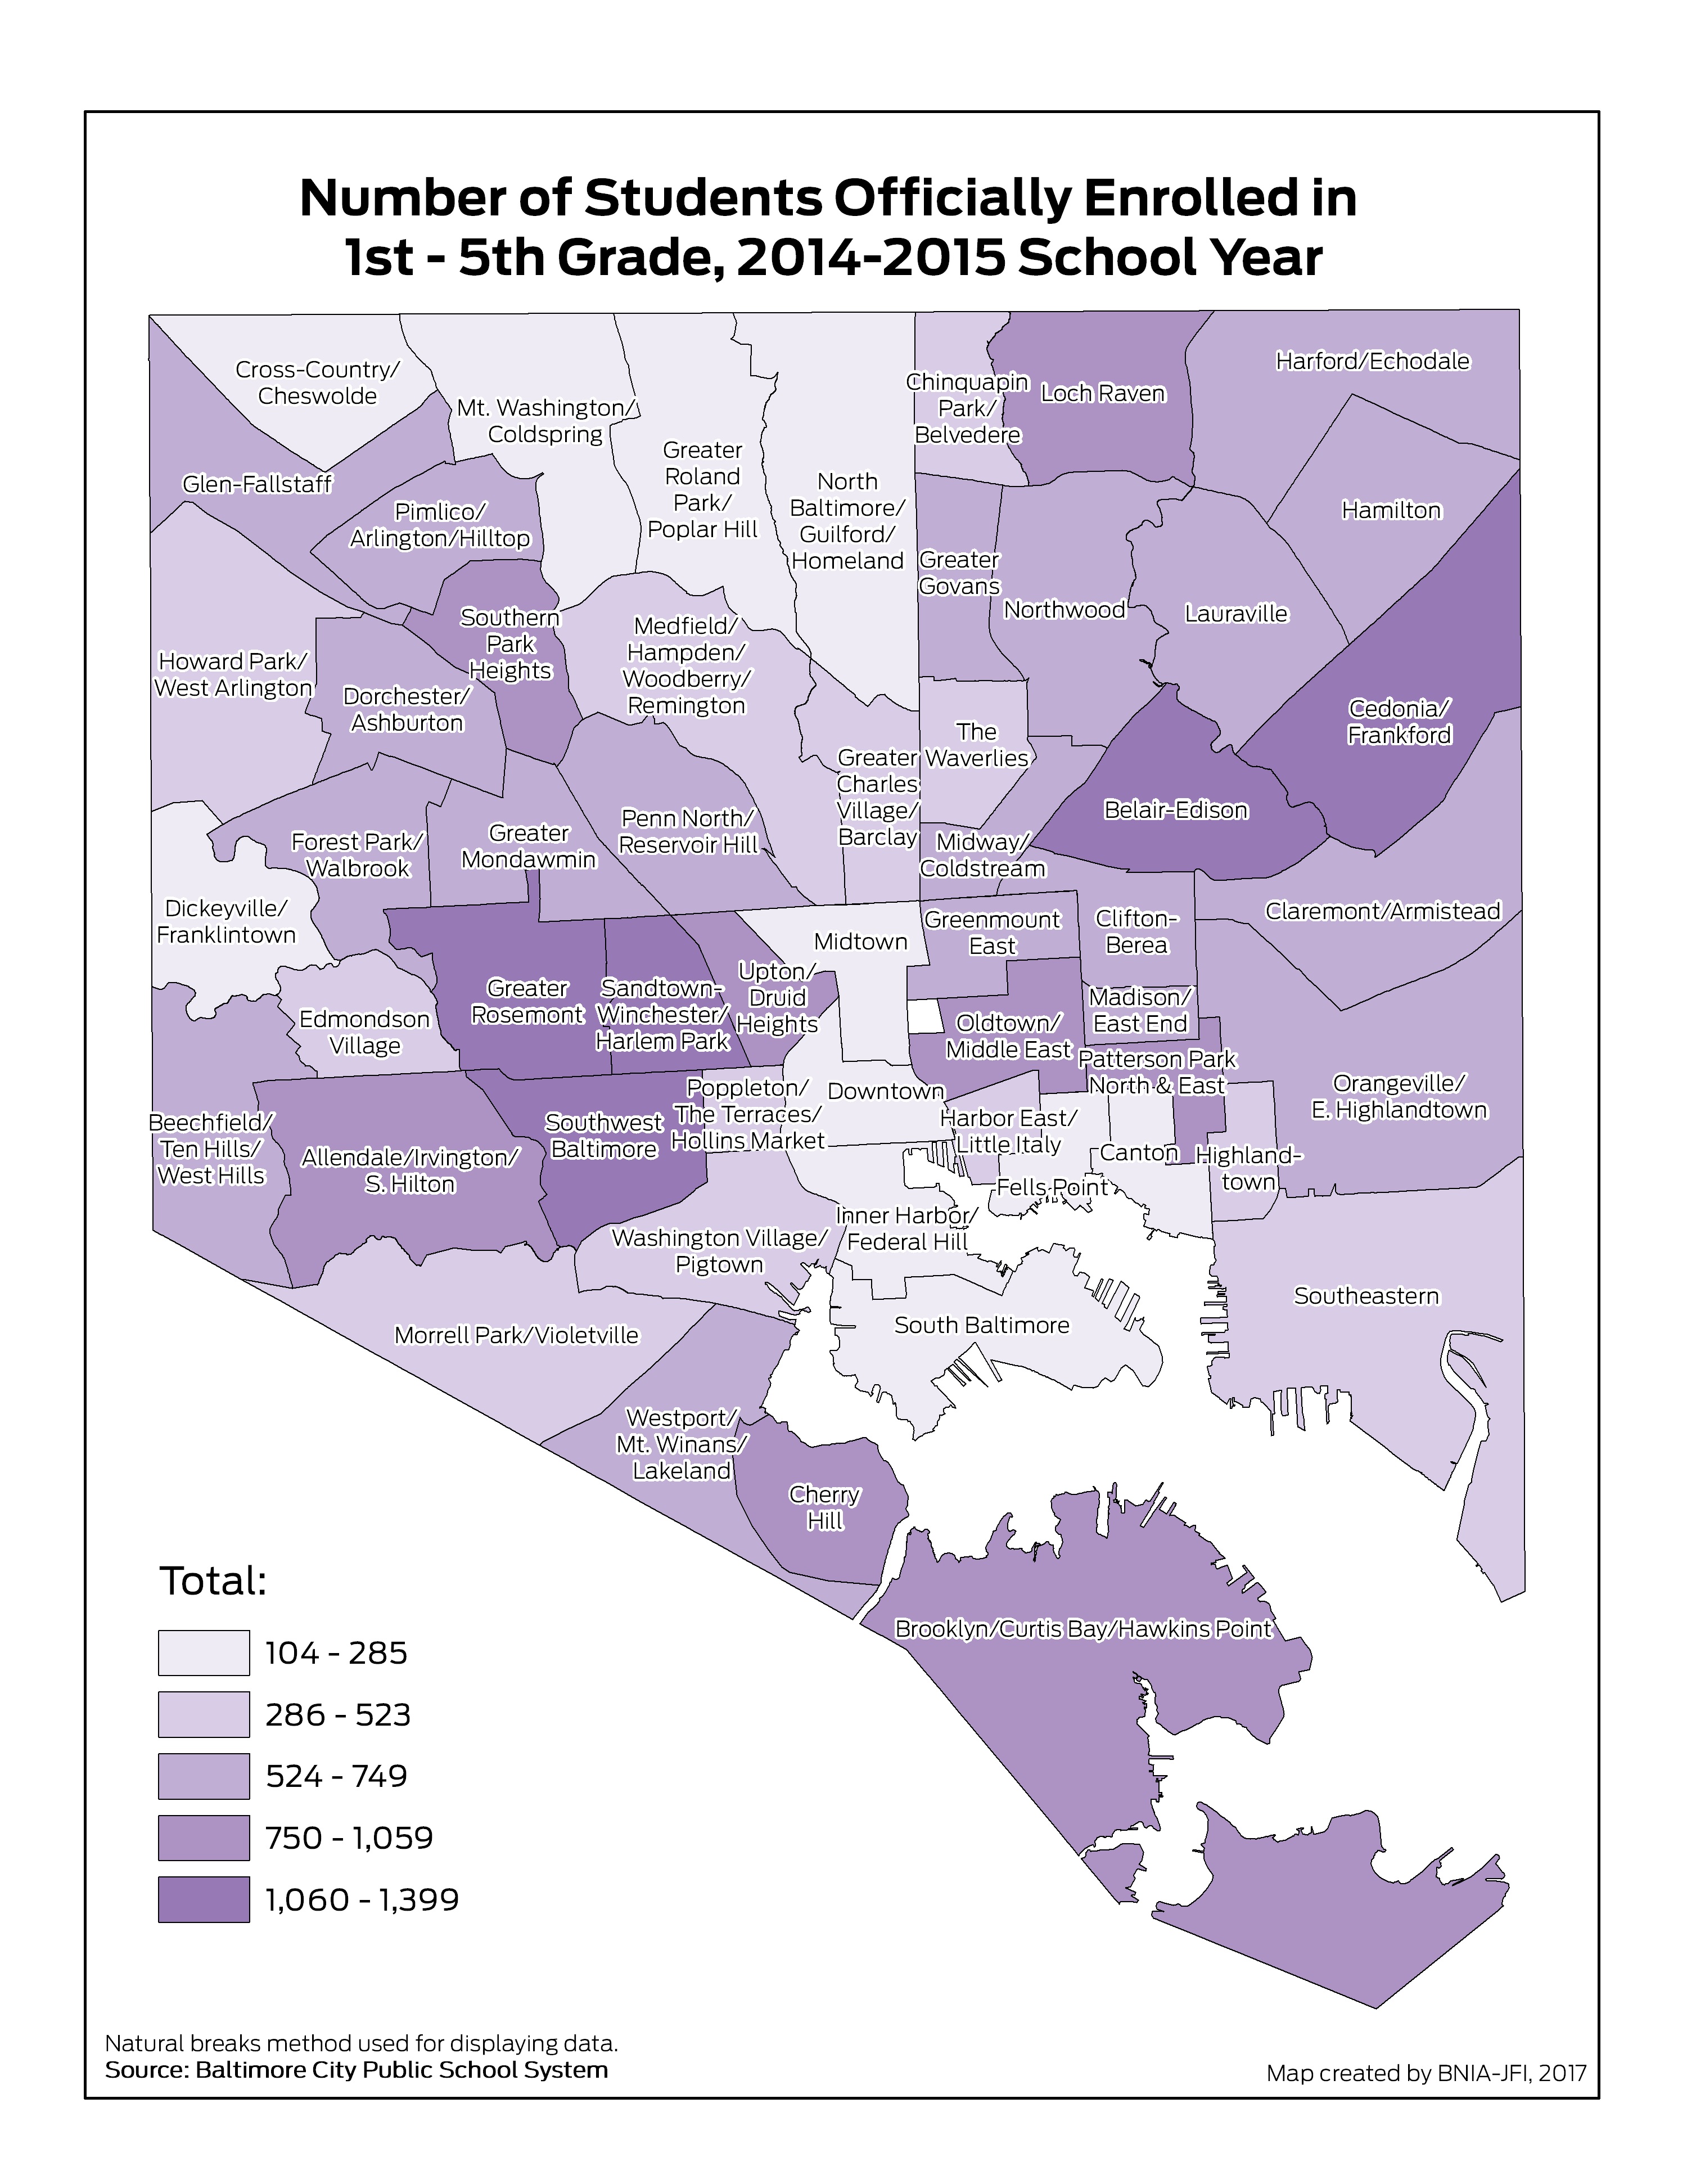
Number of Students Officially Enrolled in 1st-5th Grade (2019-2020)

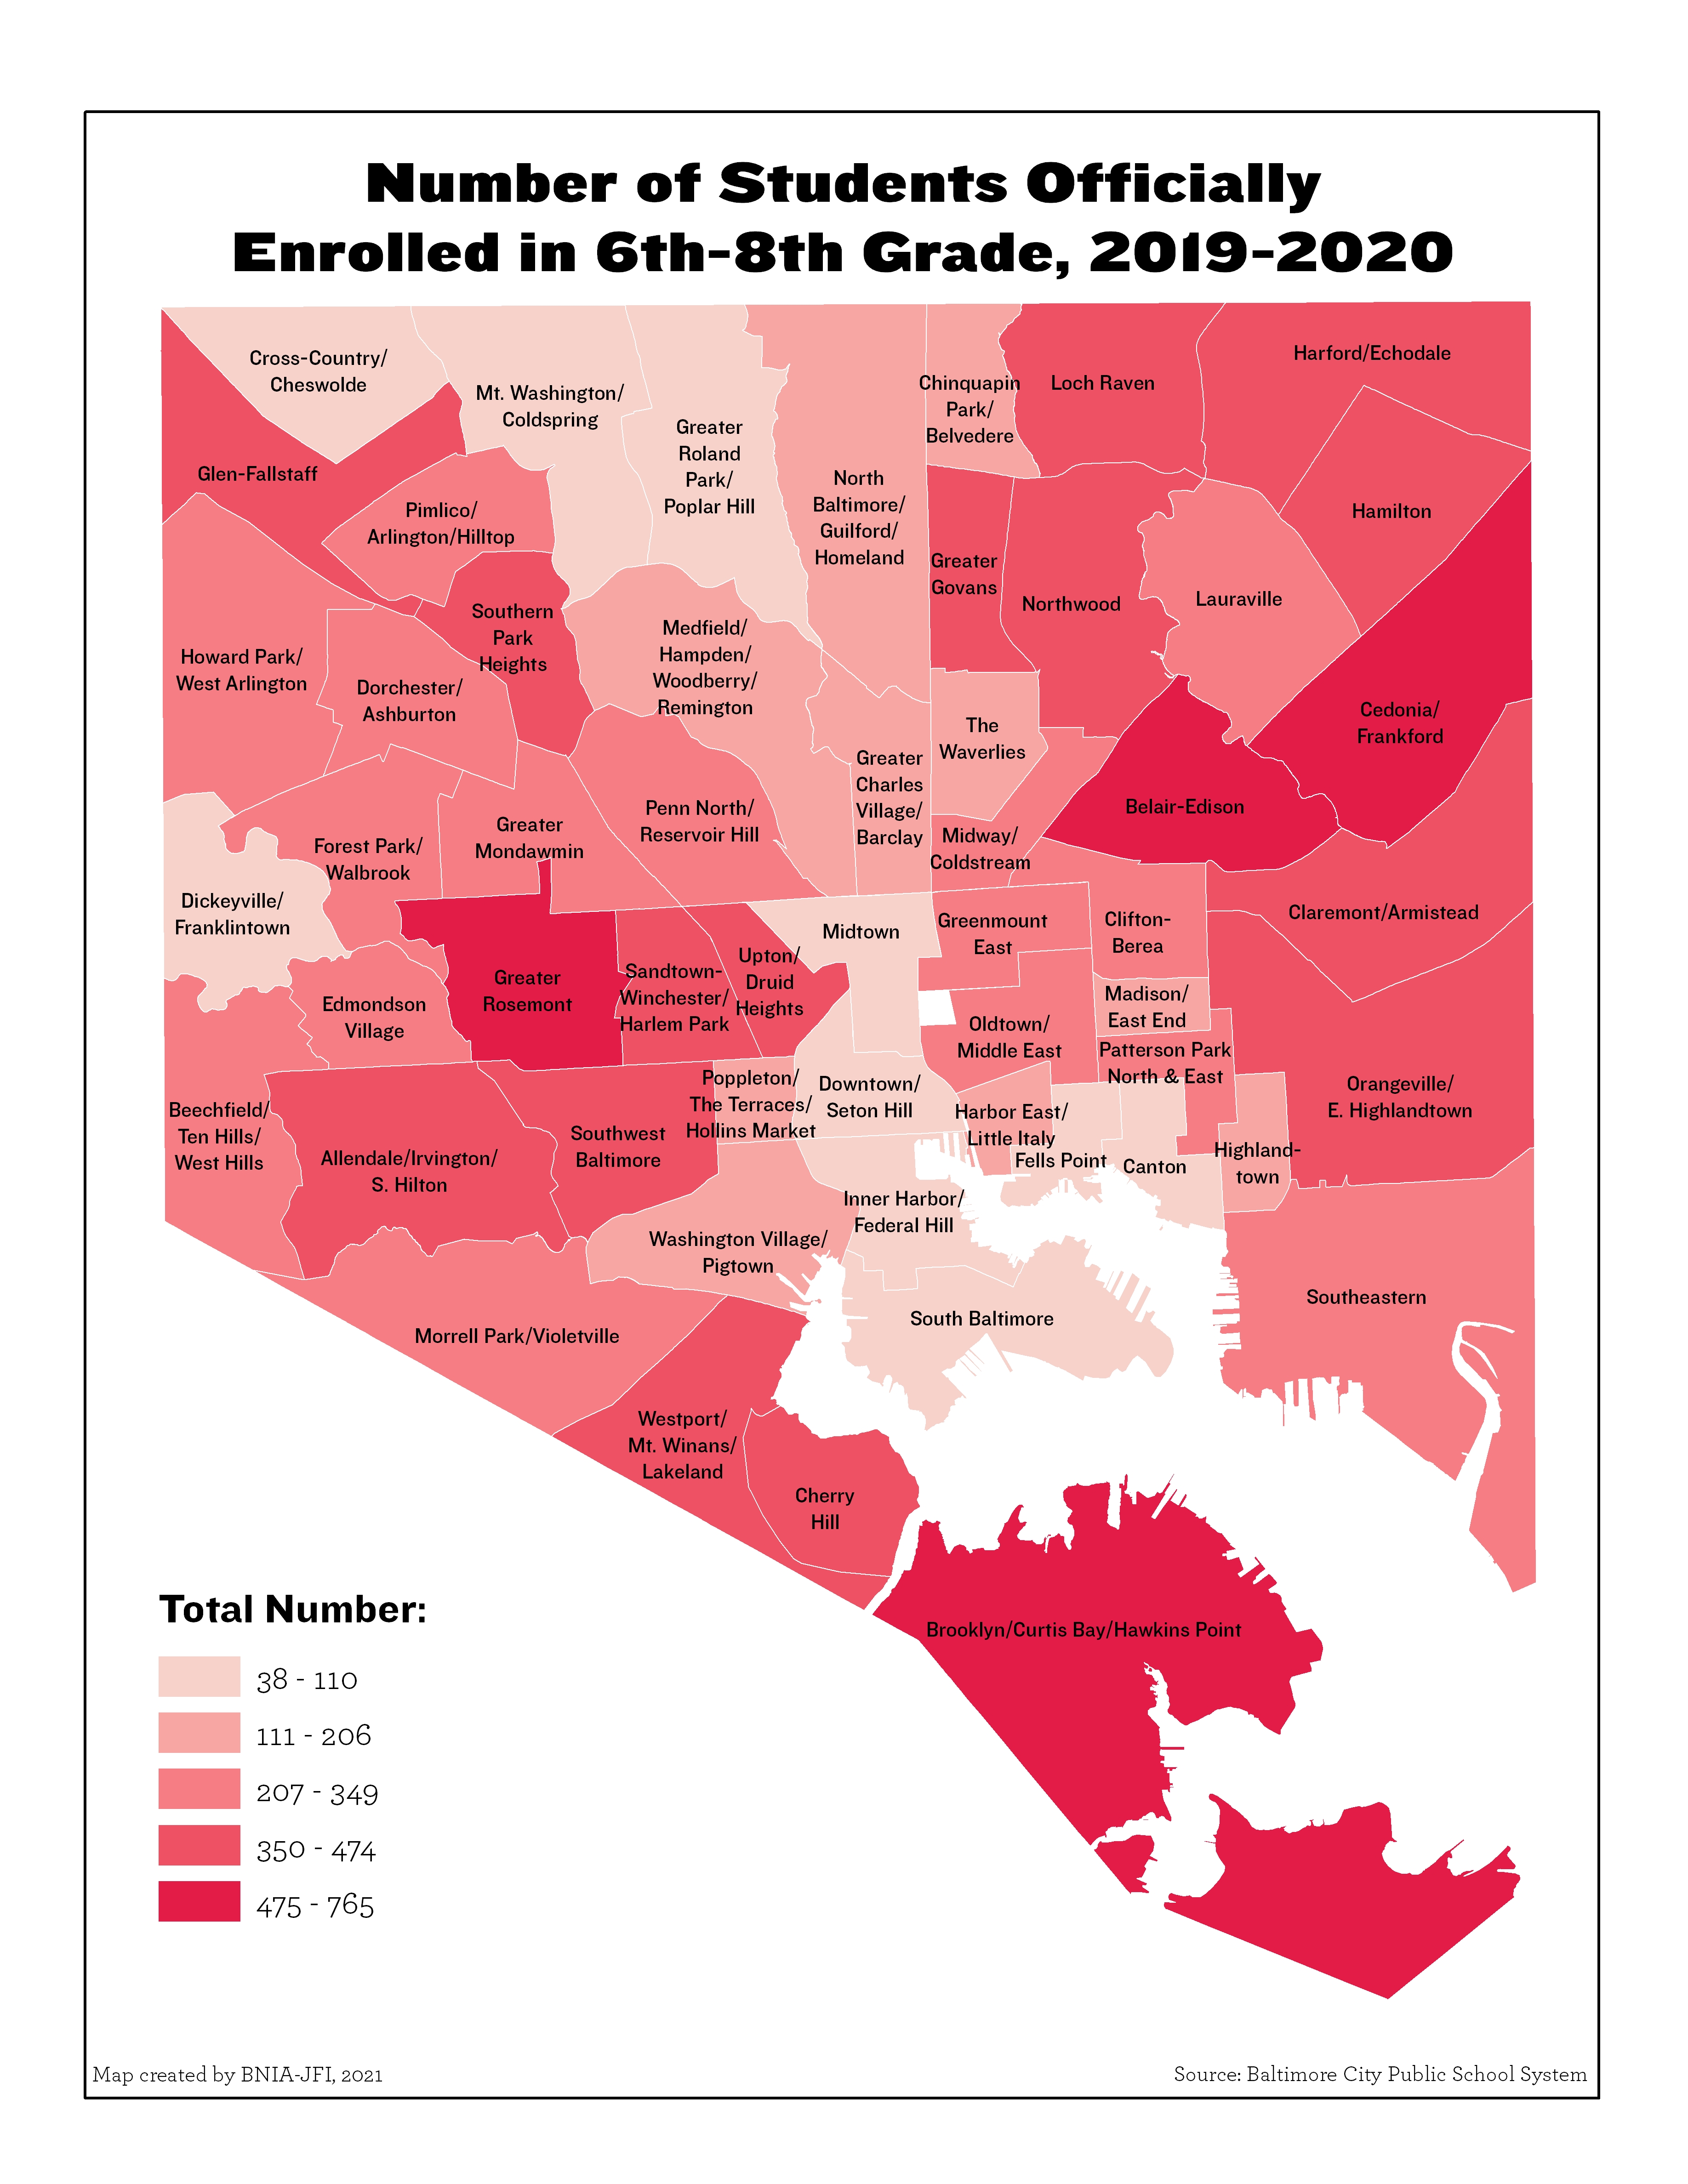
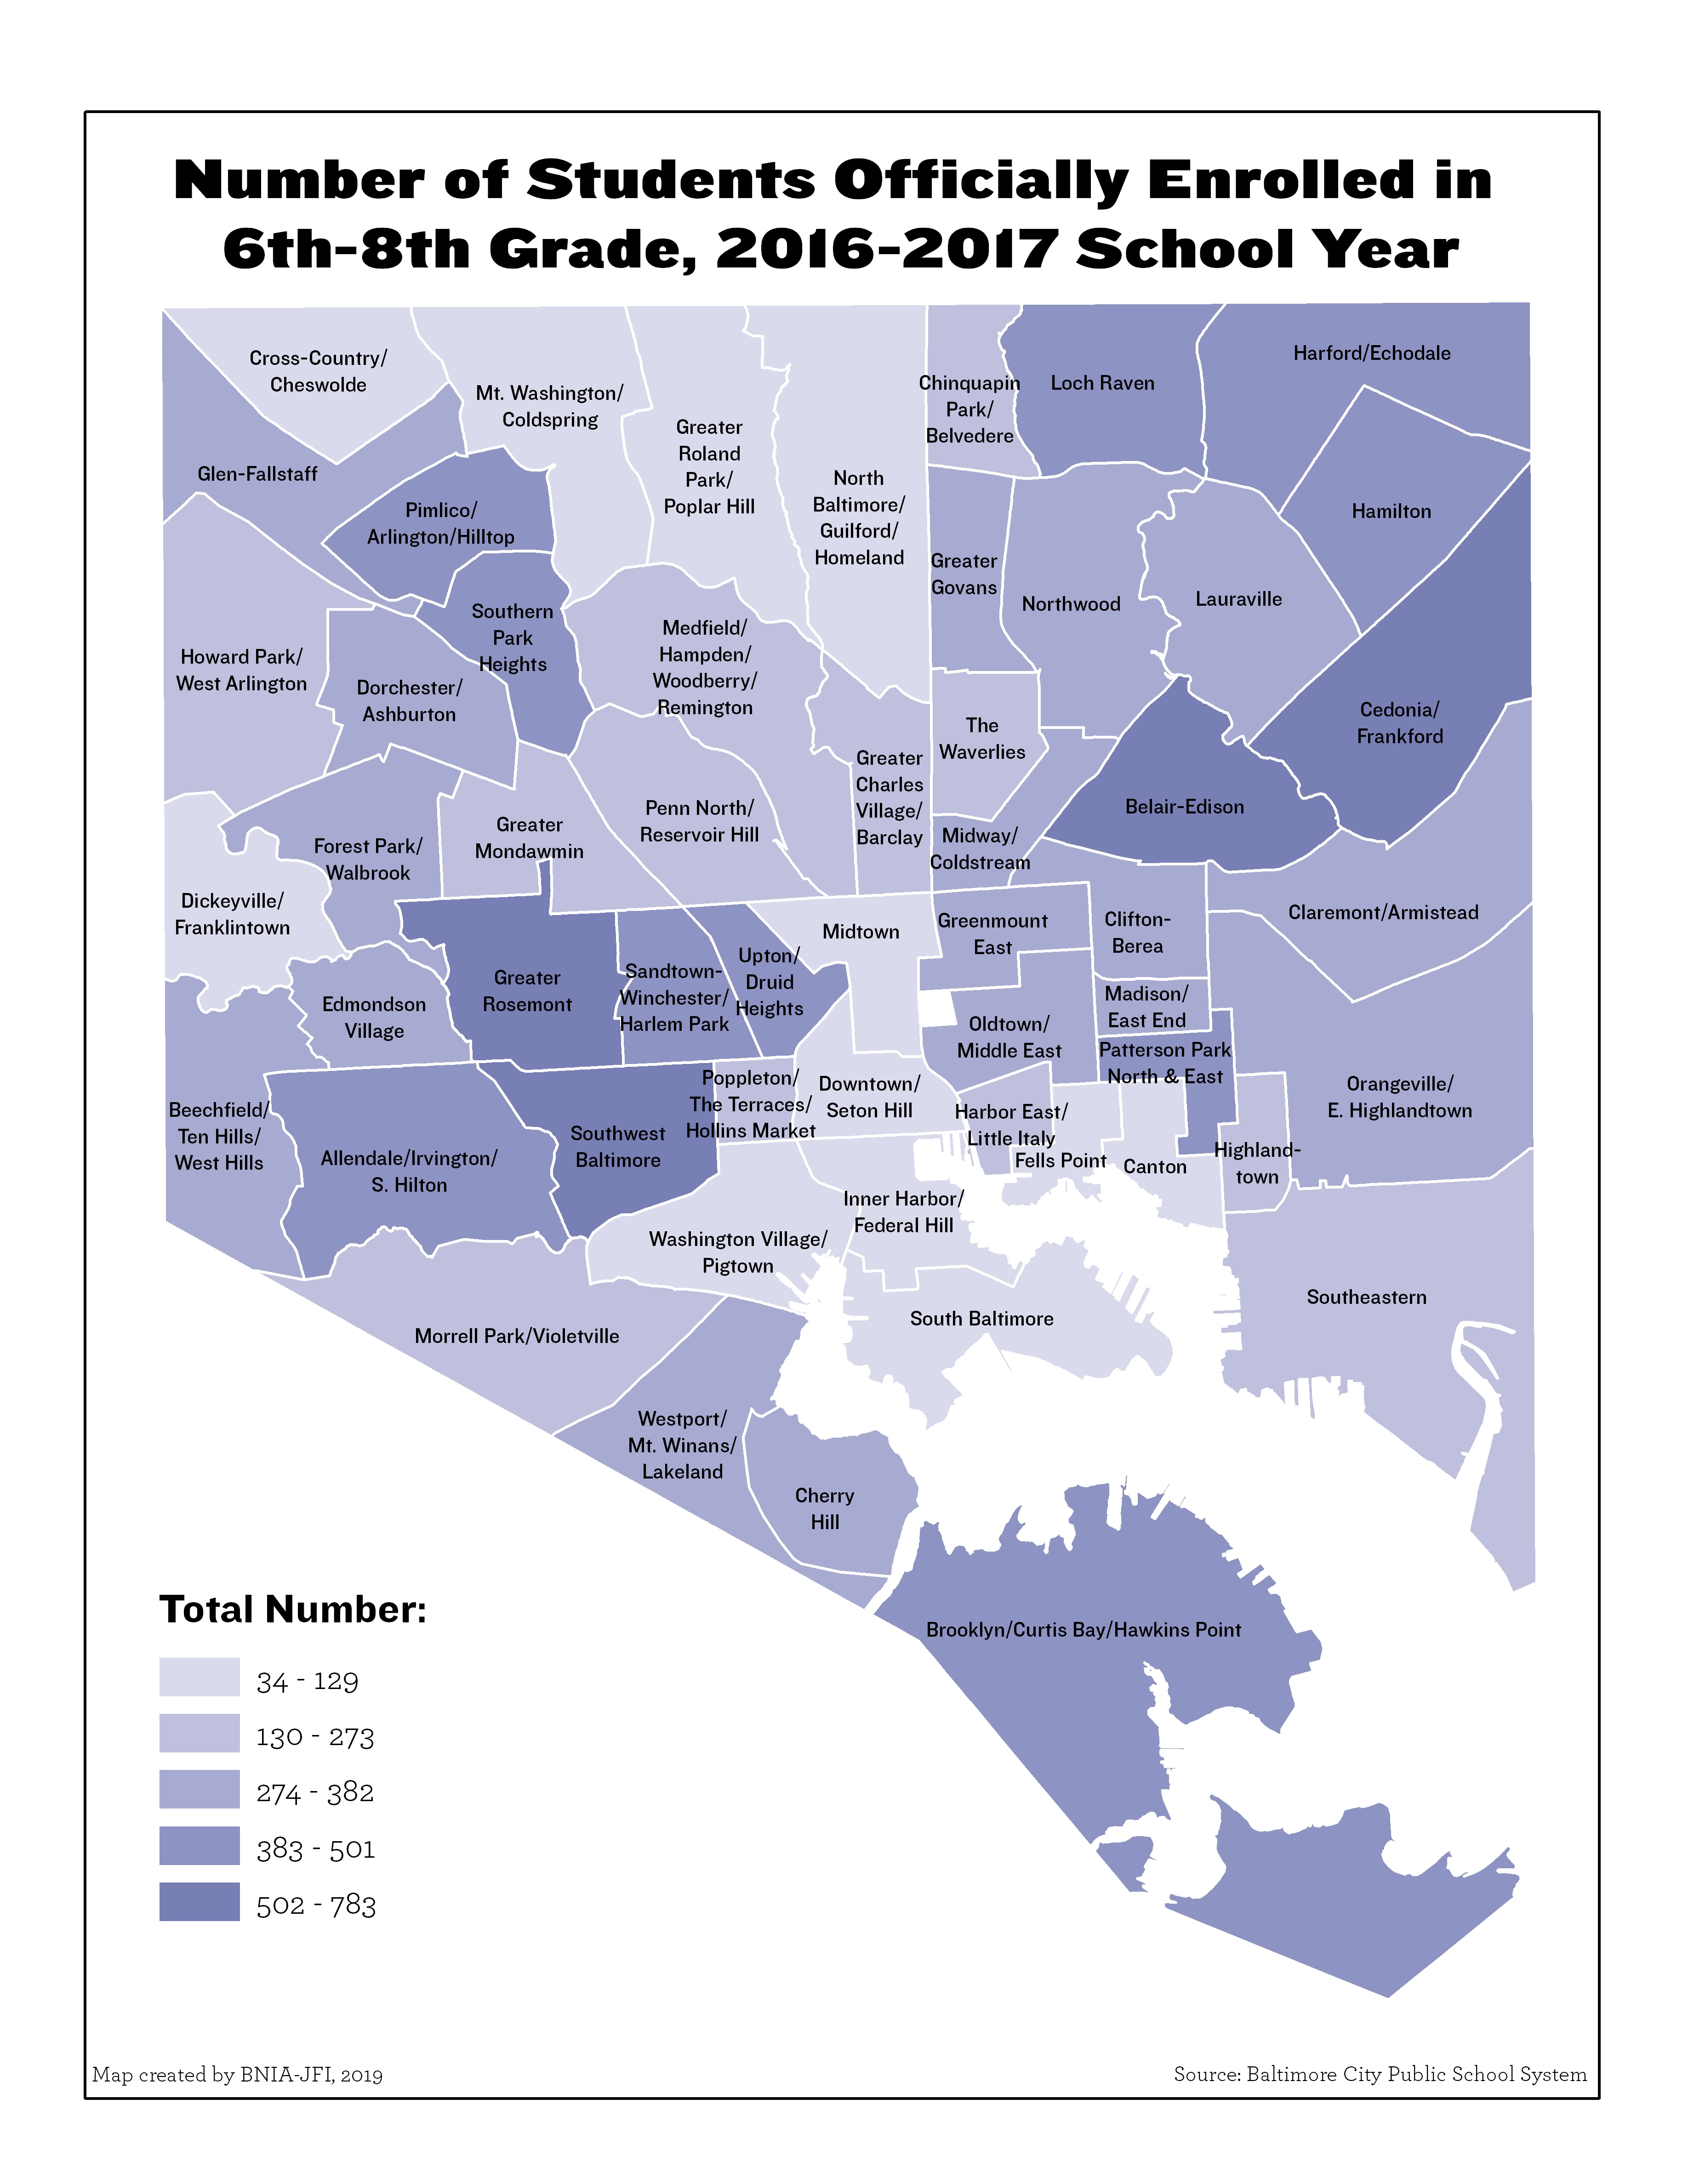
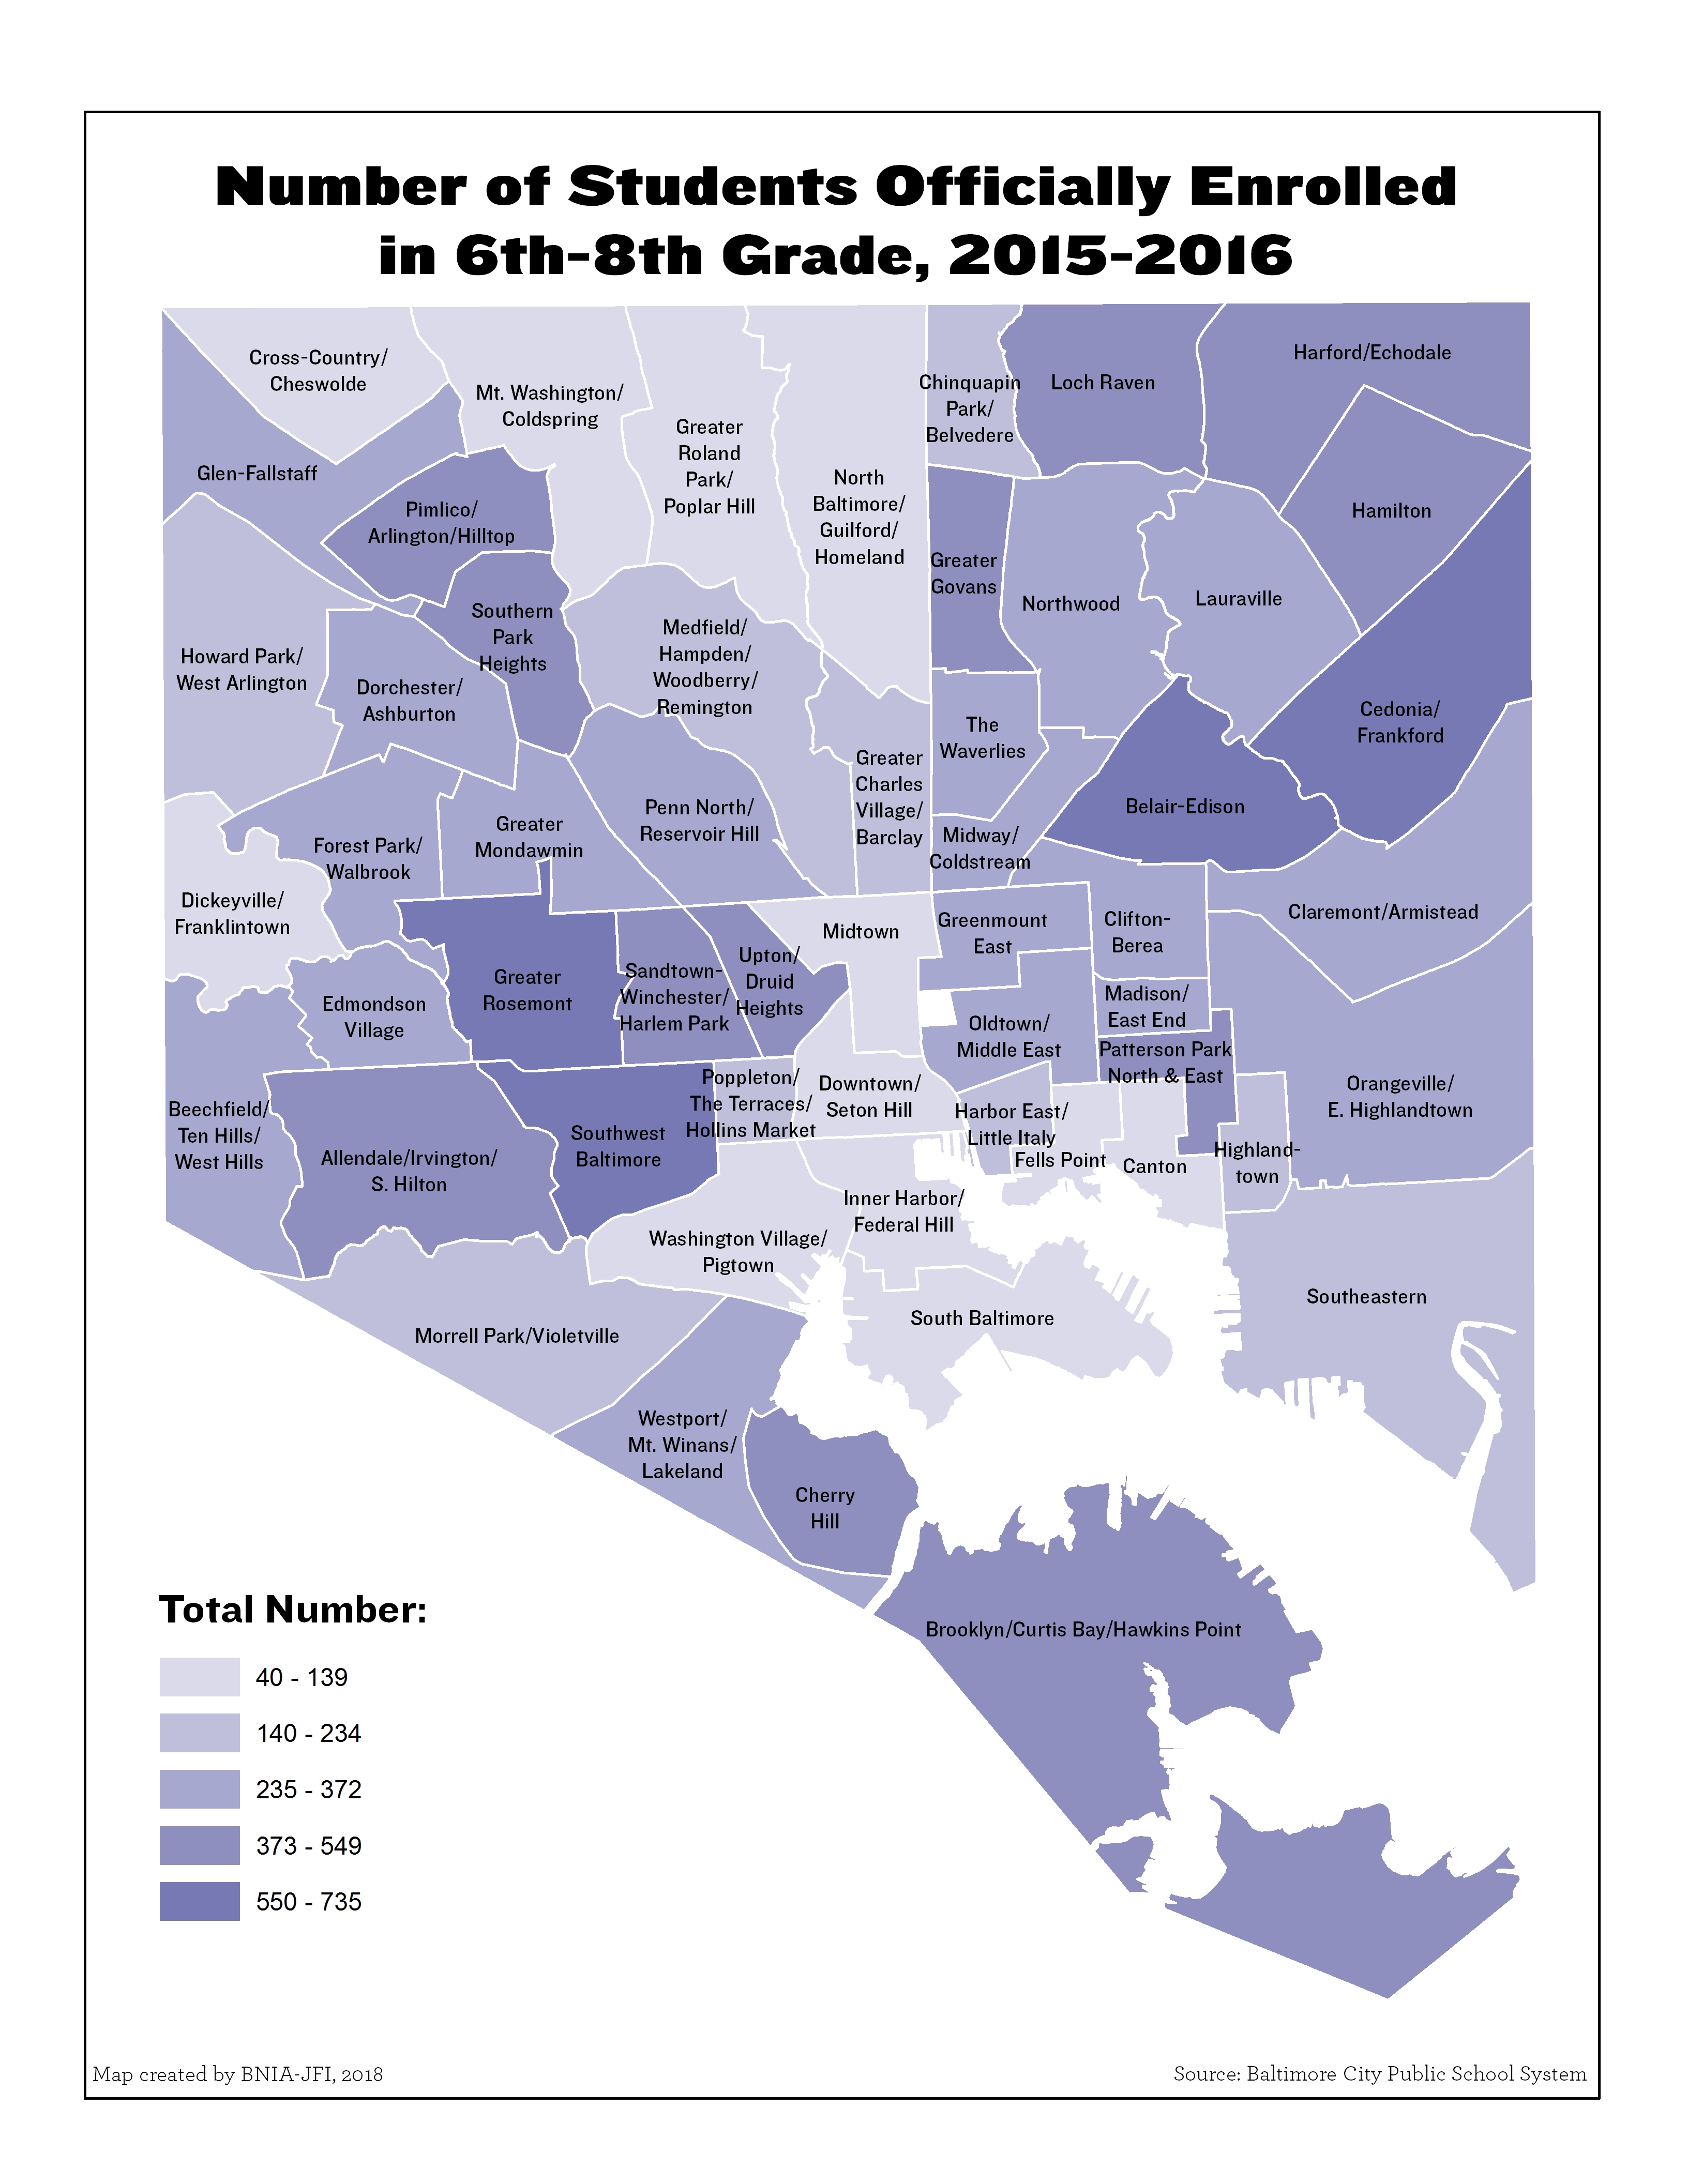
Number of Students Officially Enrolled in 6th-8th Grade (2019-2020)

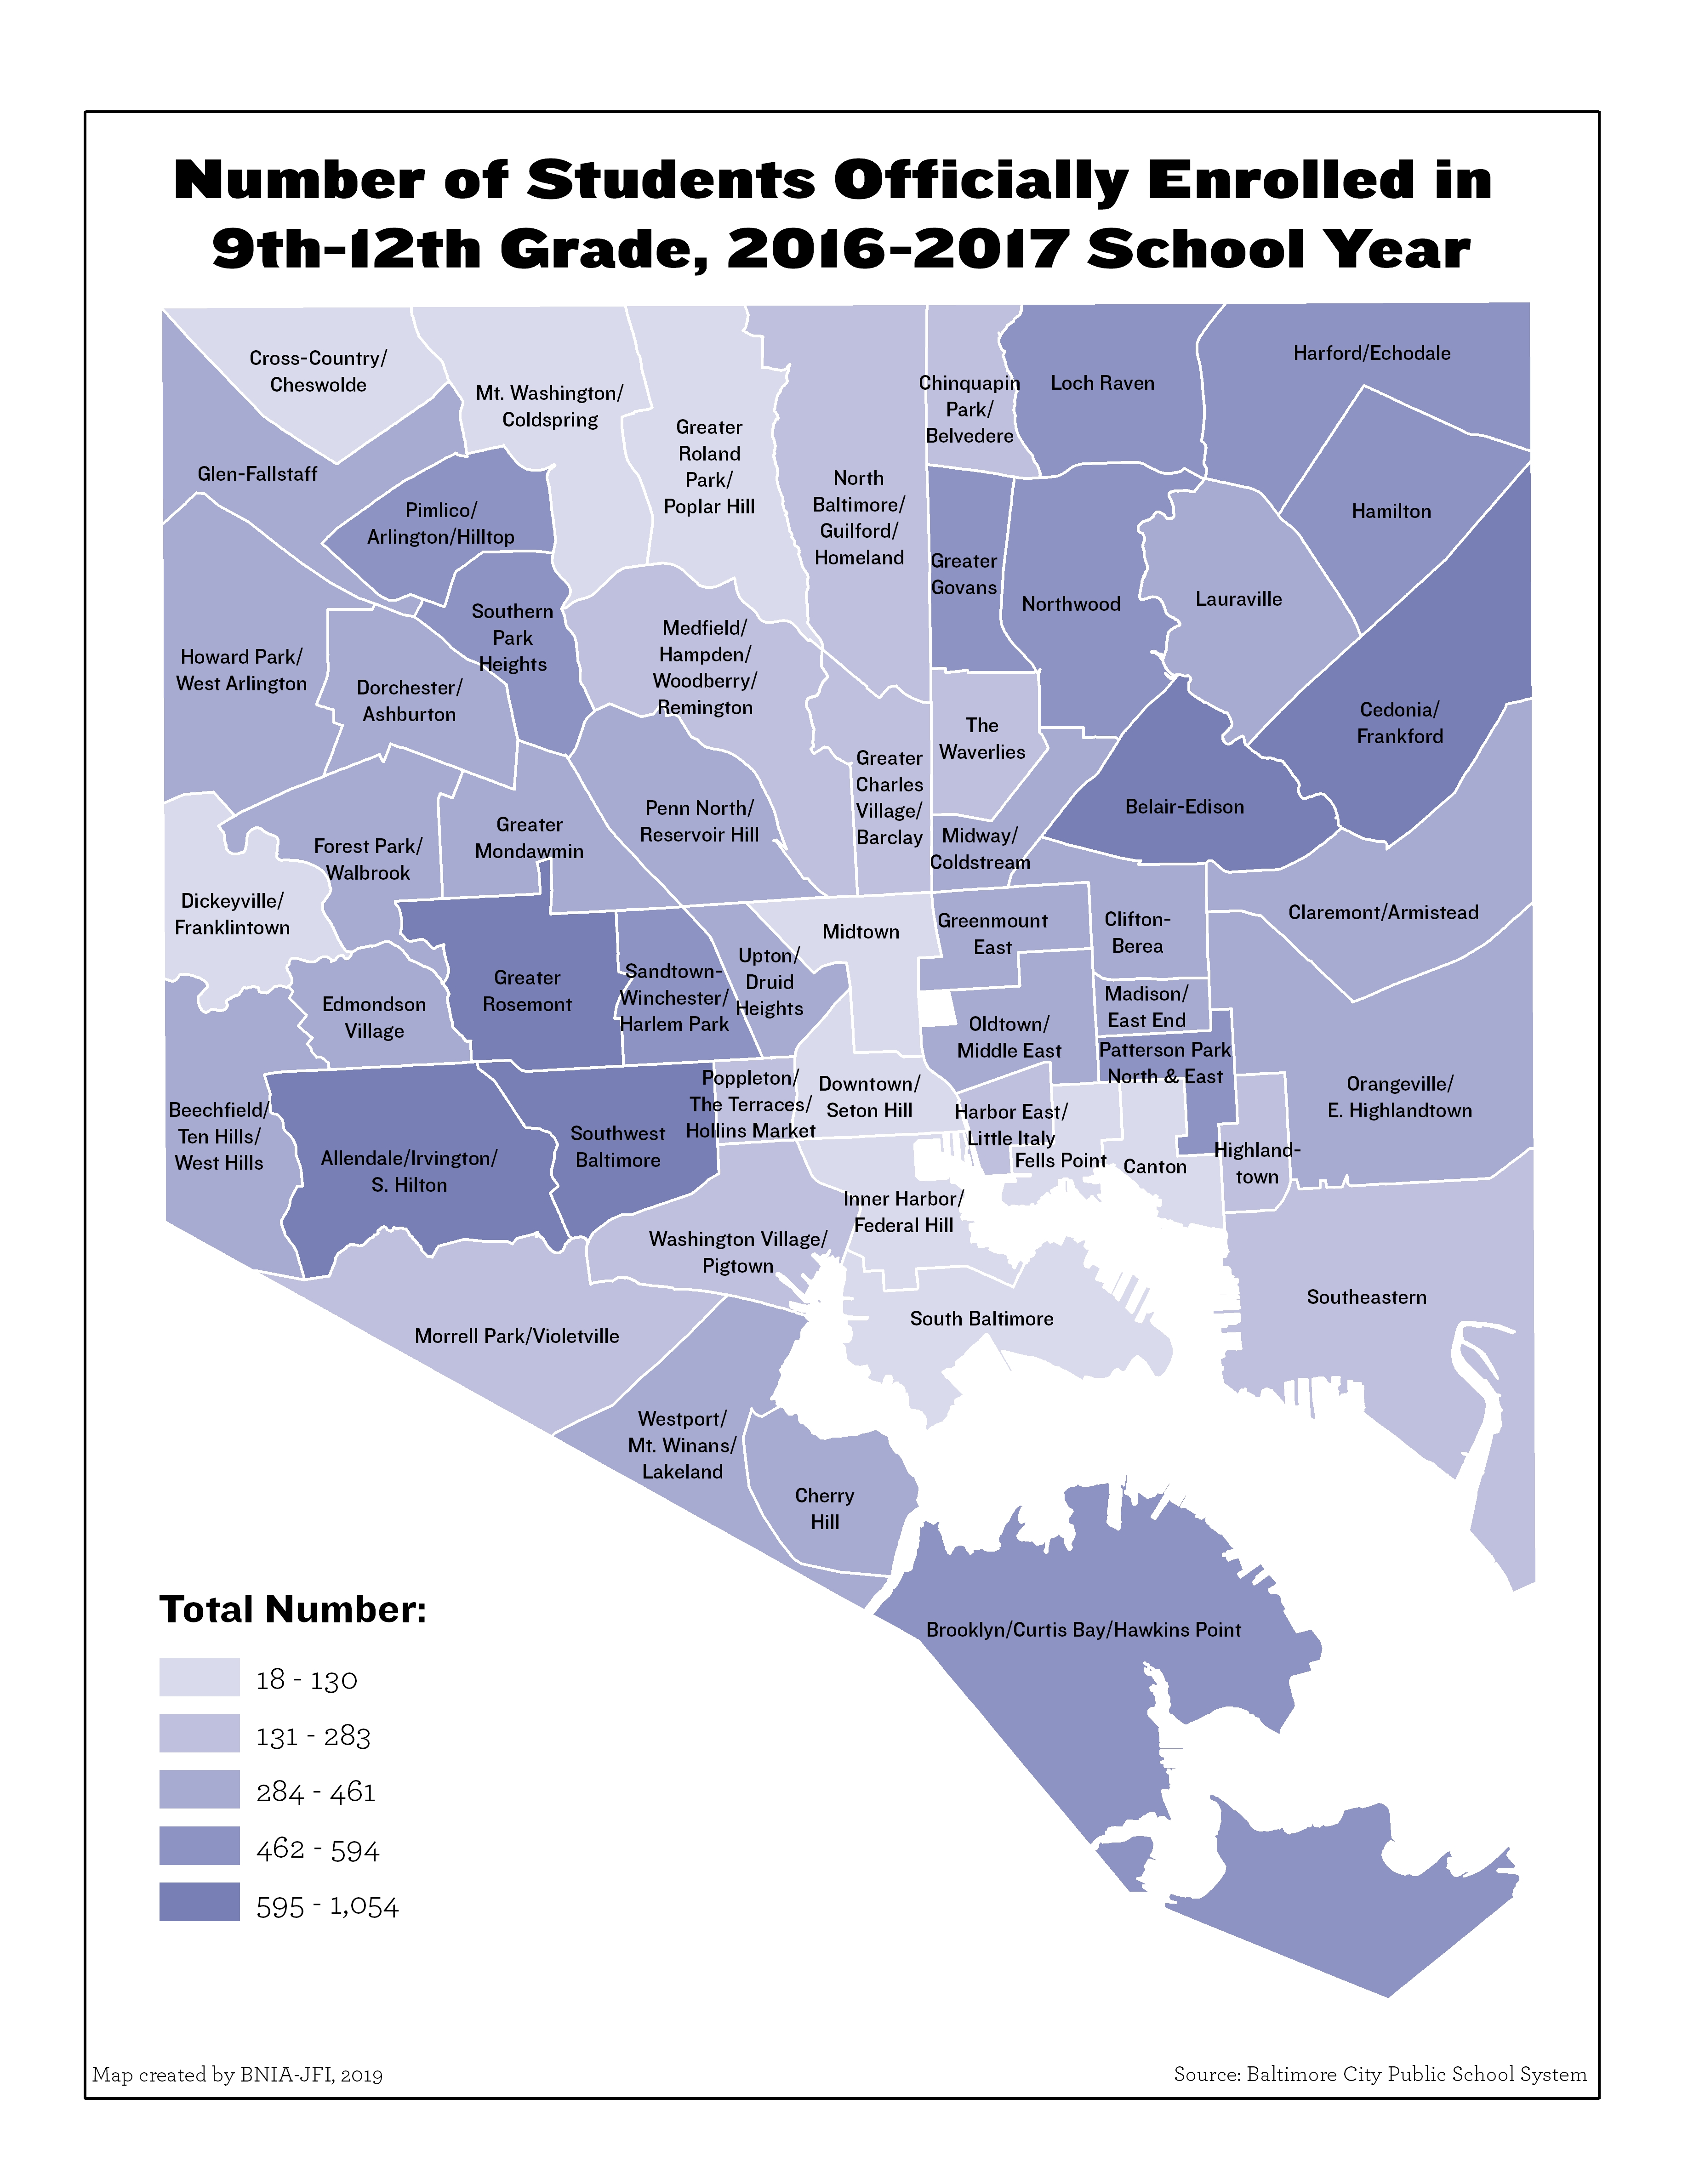
Number of Students Officially Enrolled in 9th-12th Grade (2019-2020)
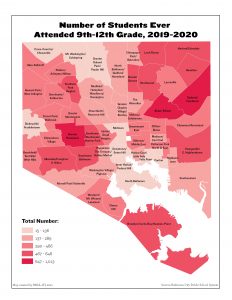
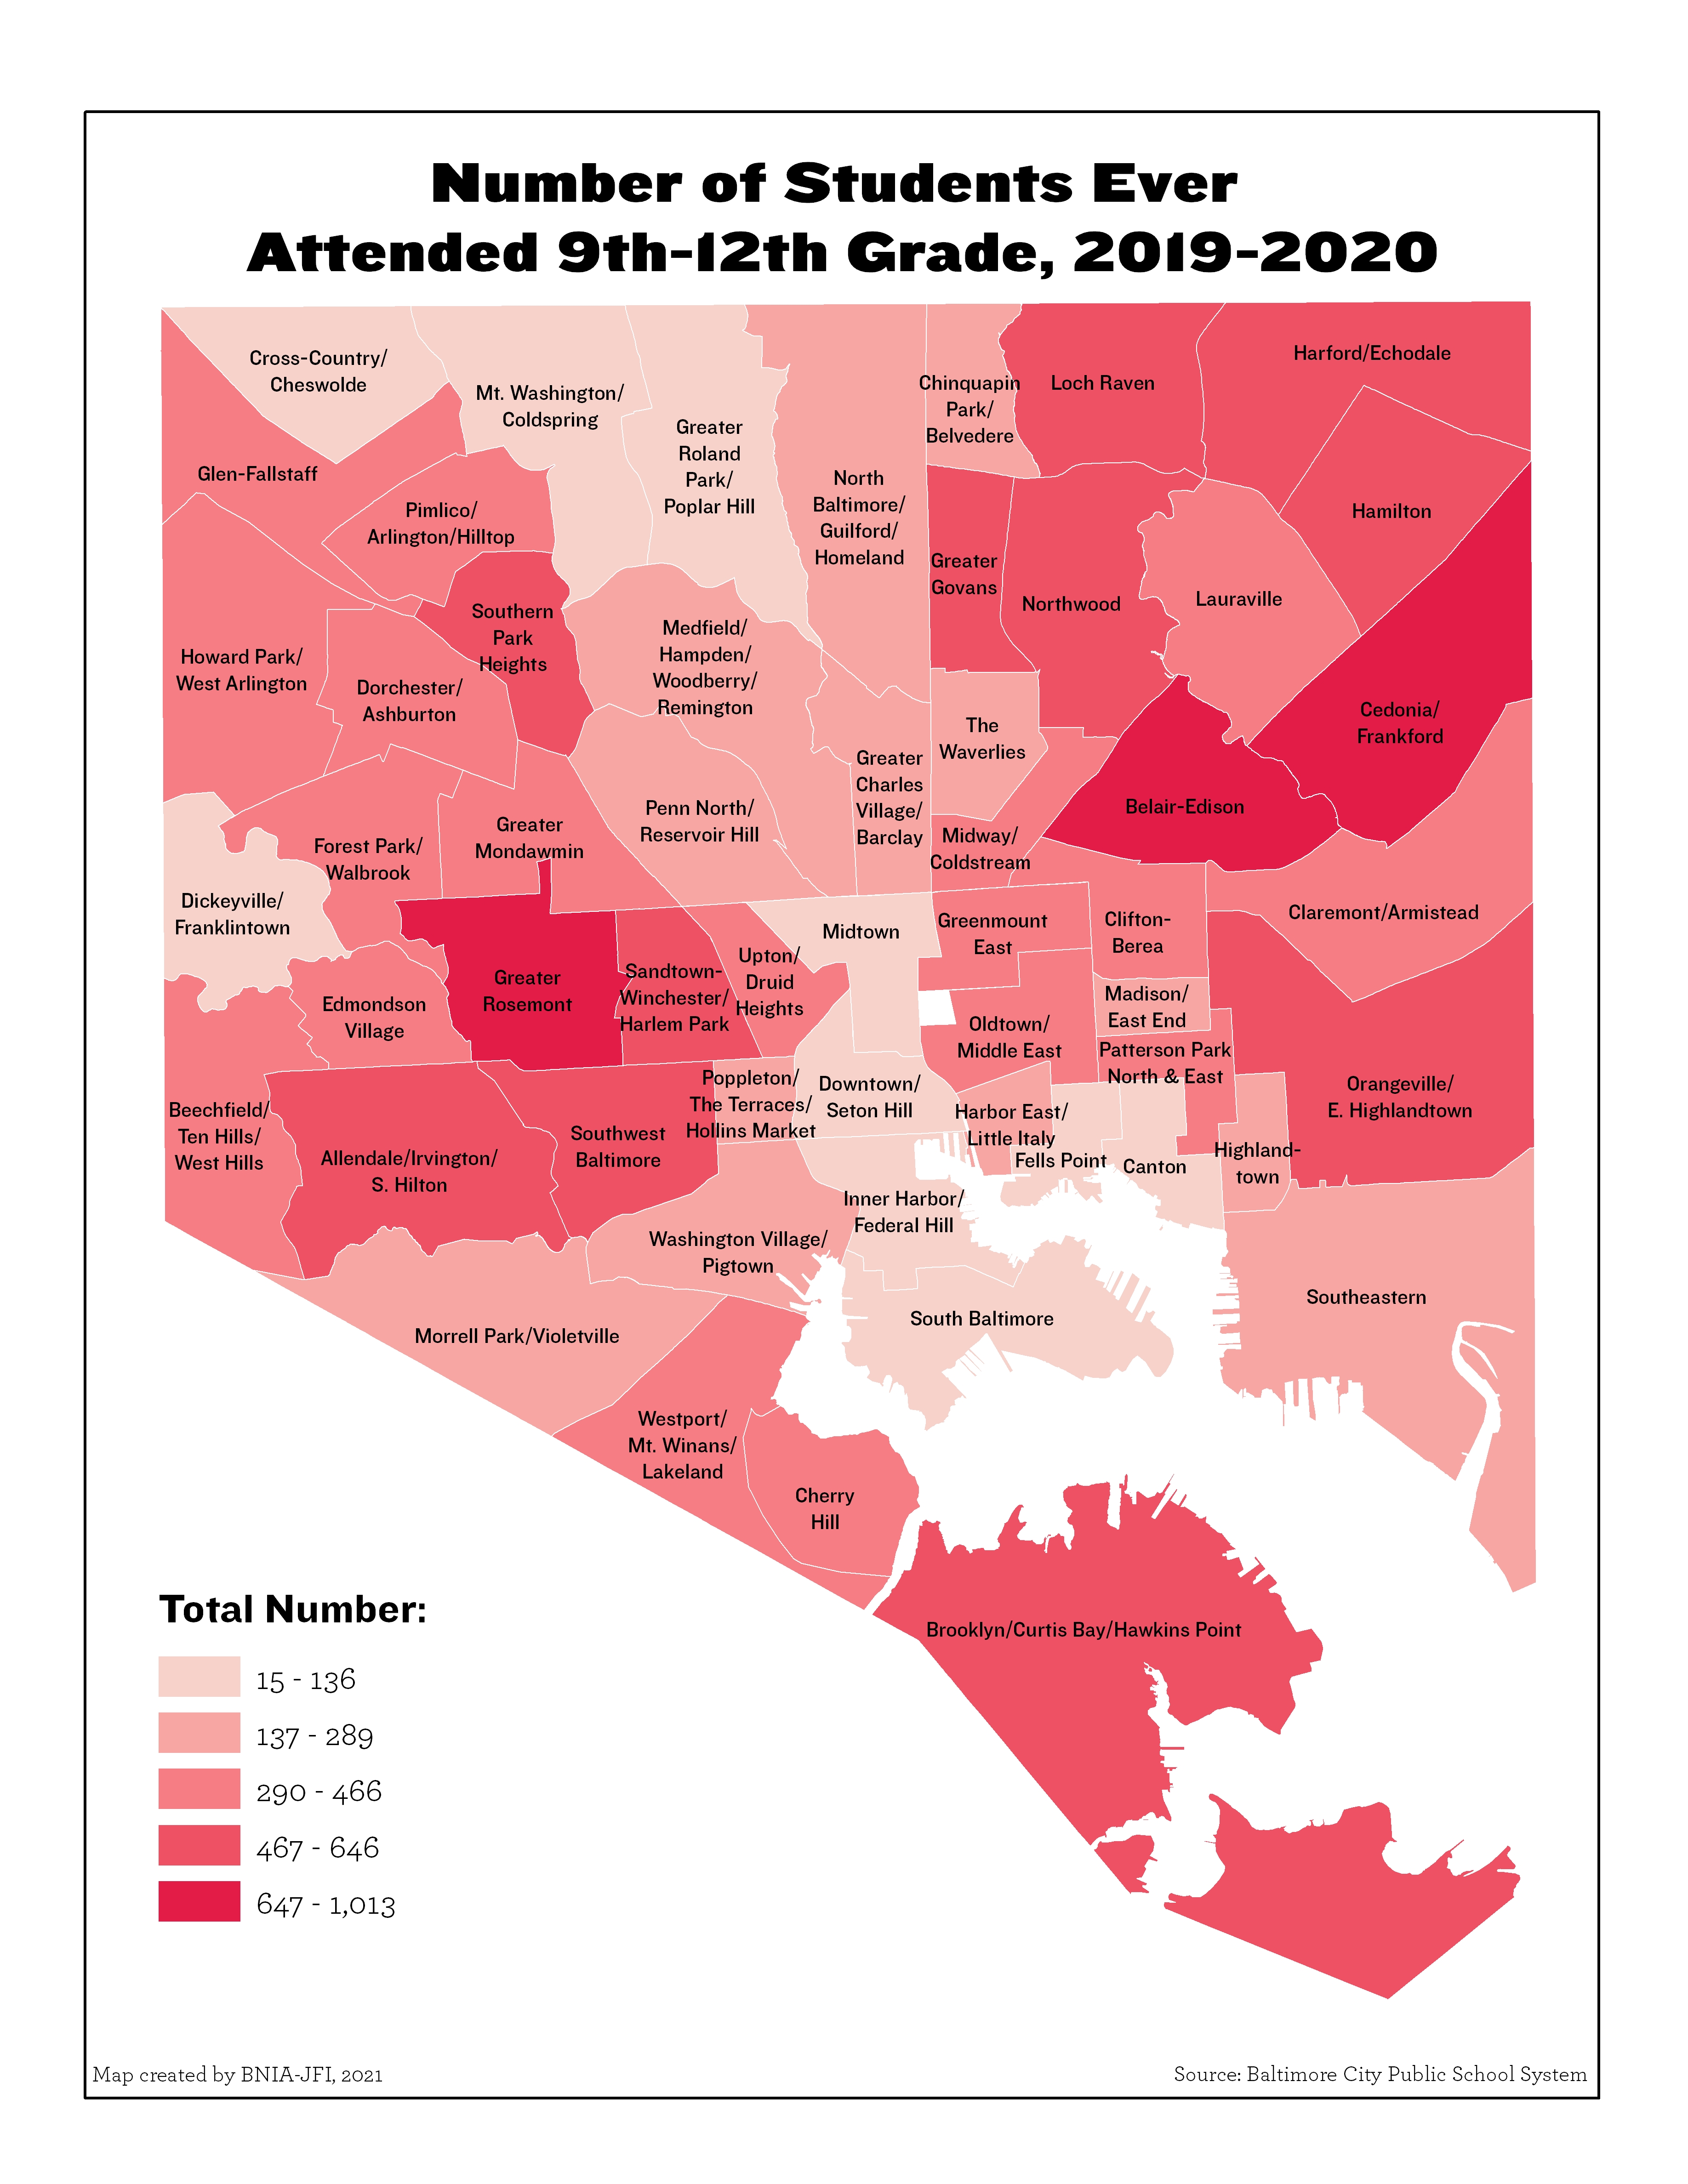
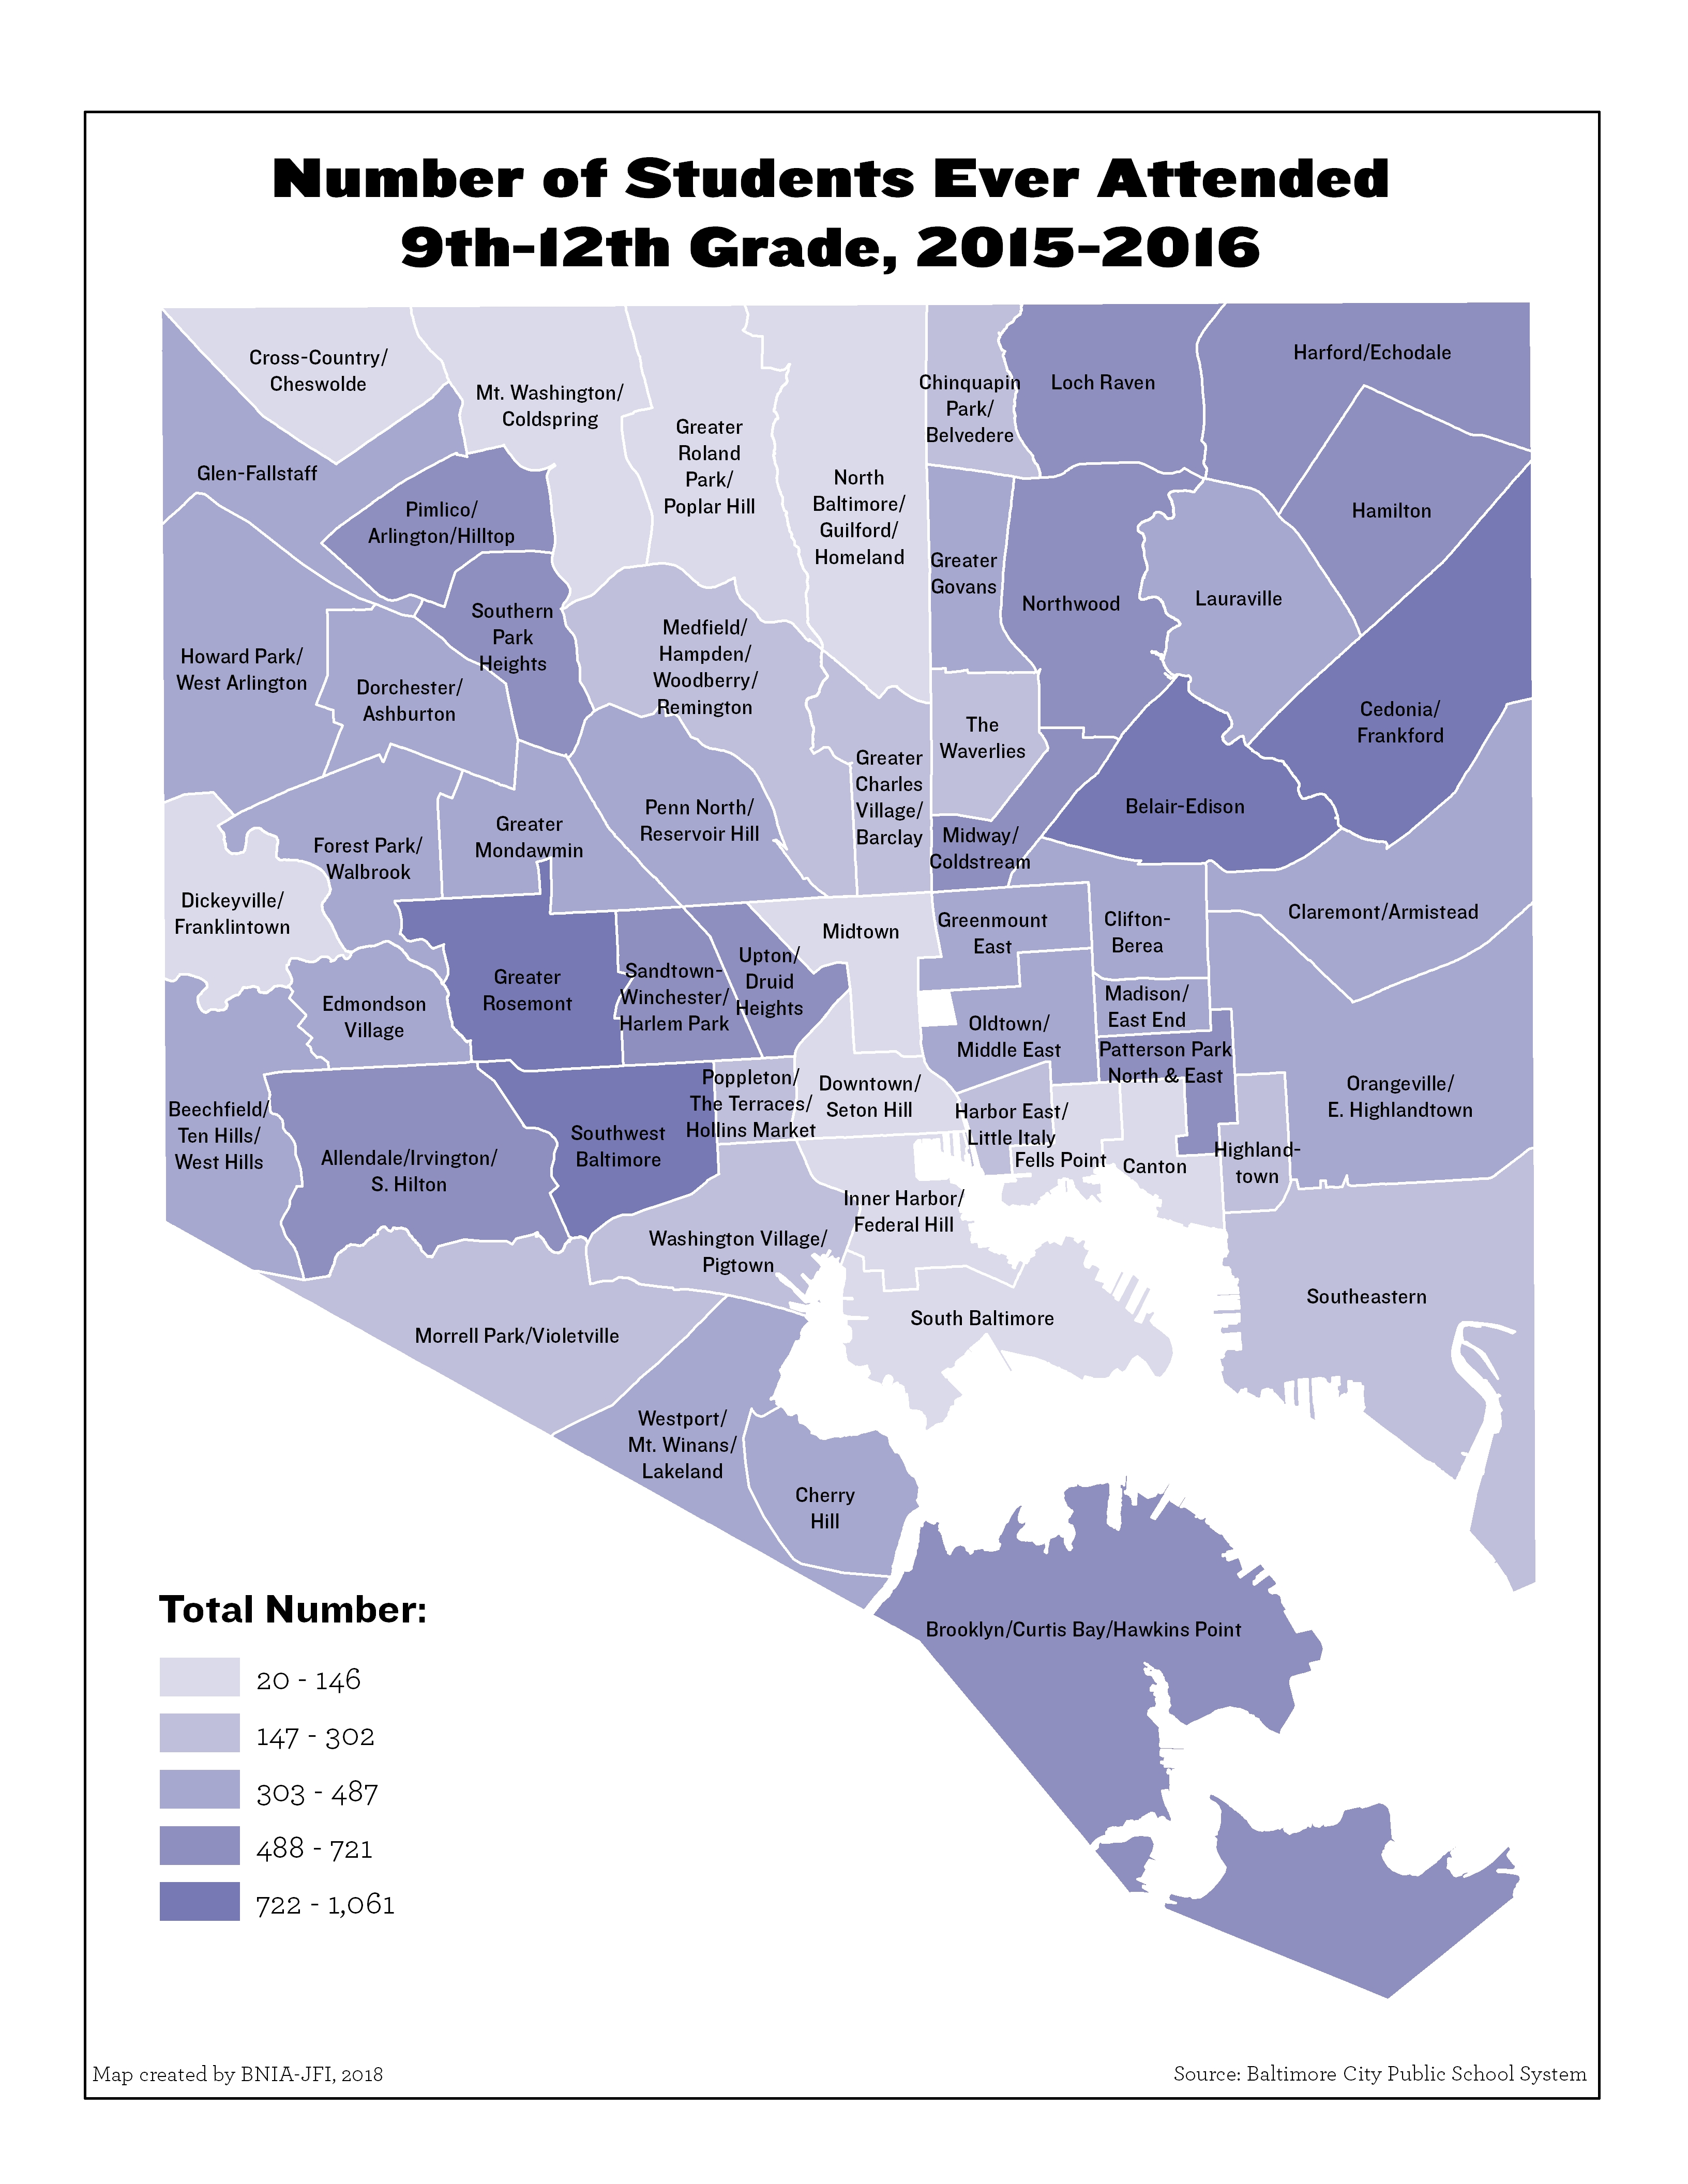
Number of Students Ever Attended 9th-12th Grade (2019-2020)
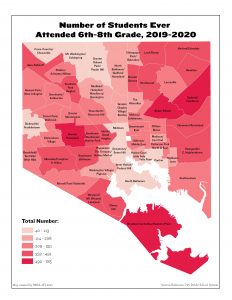
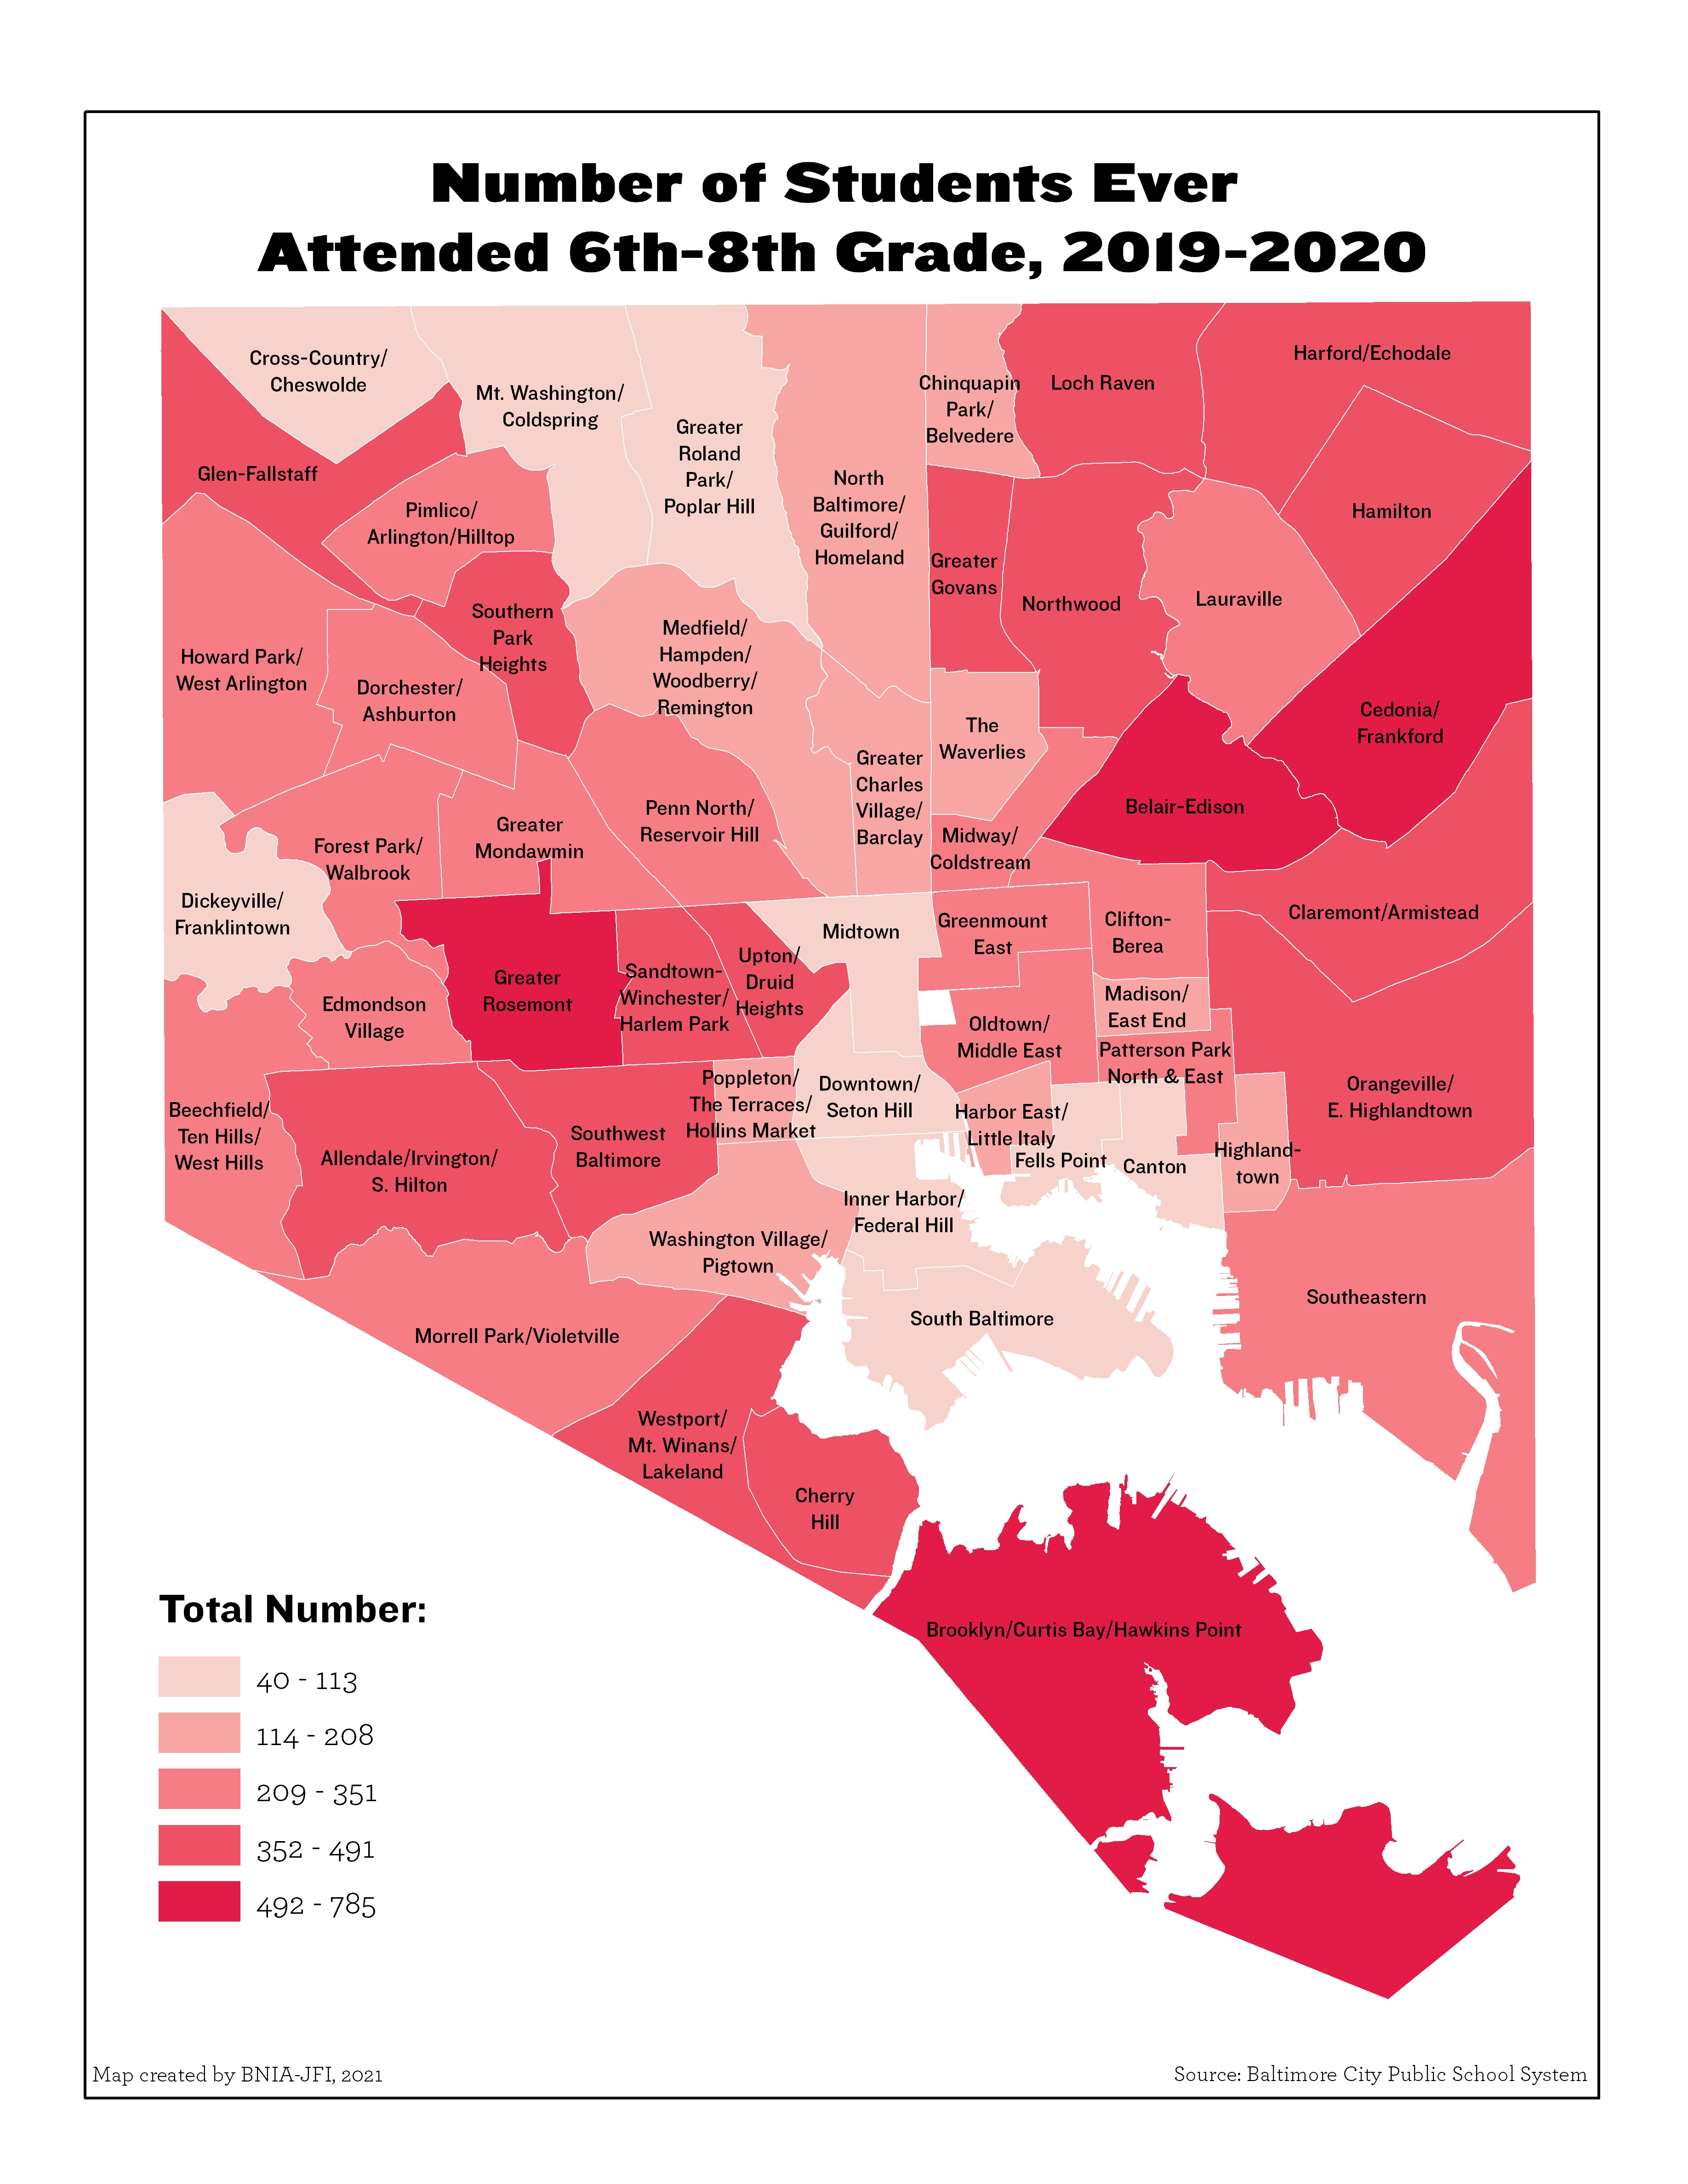
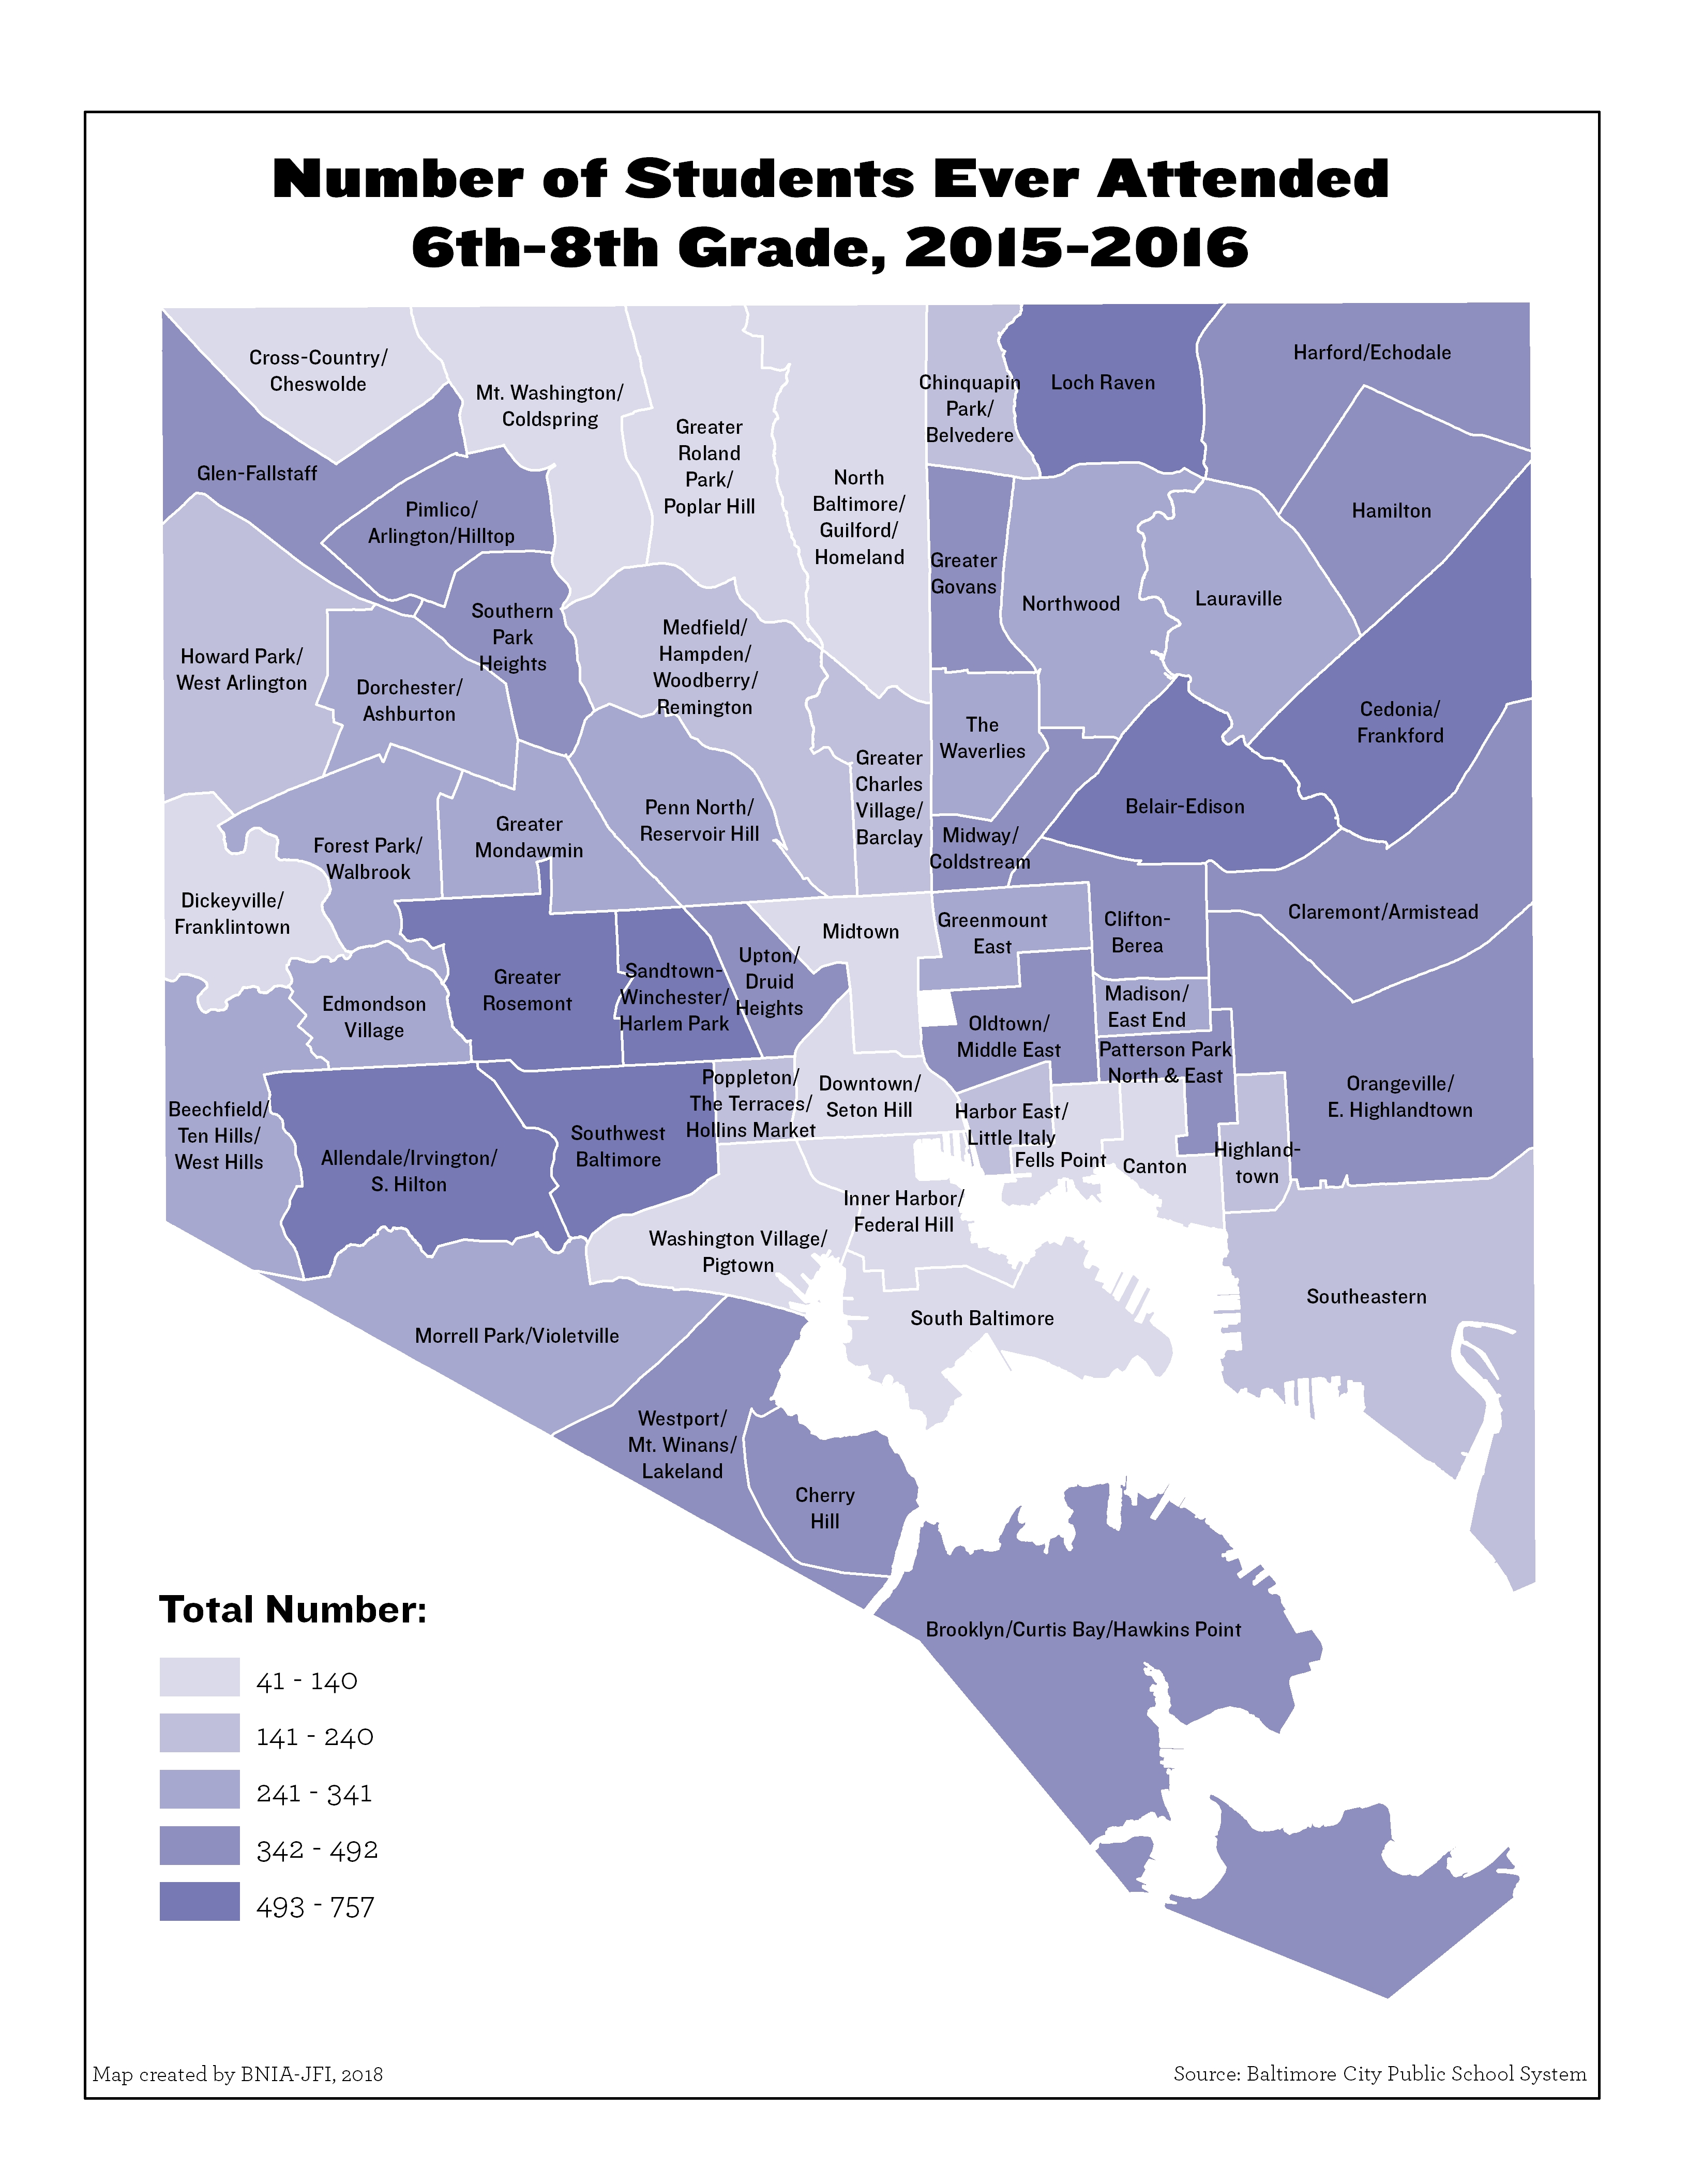
Number of Students Ever Attended 6th-8th Grade (2019-2020)
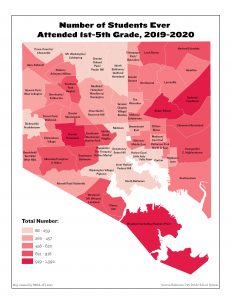
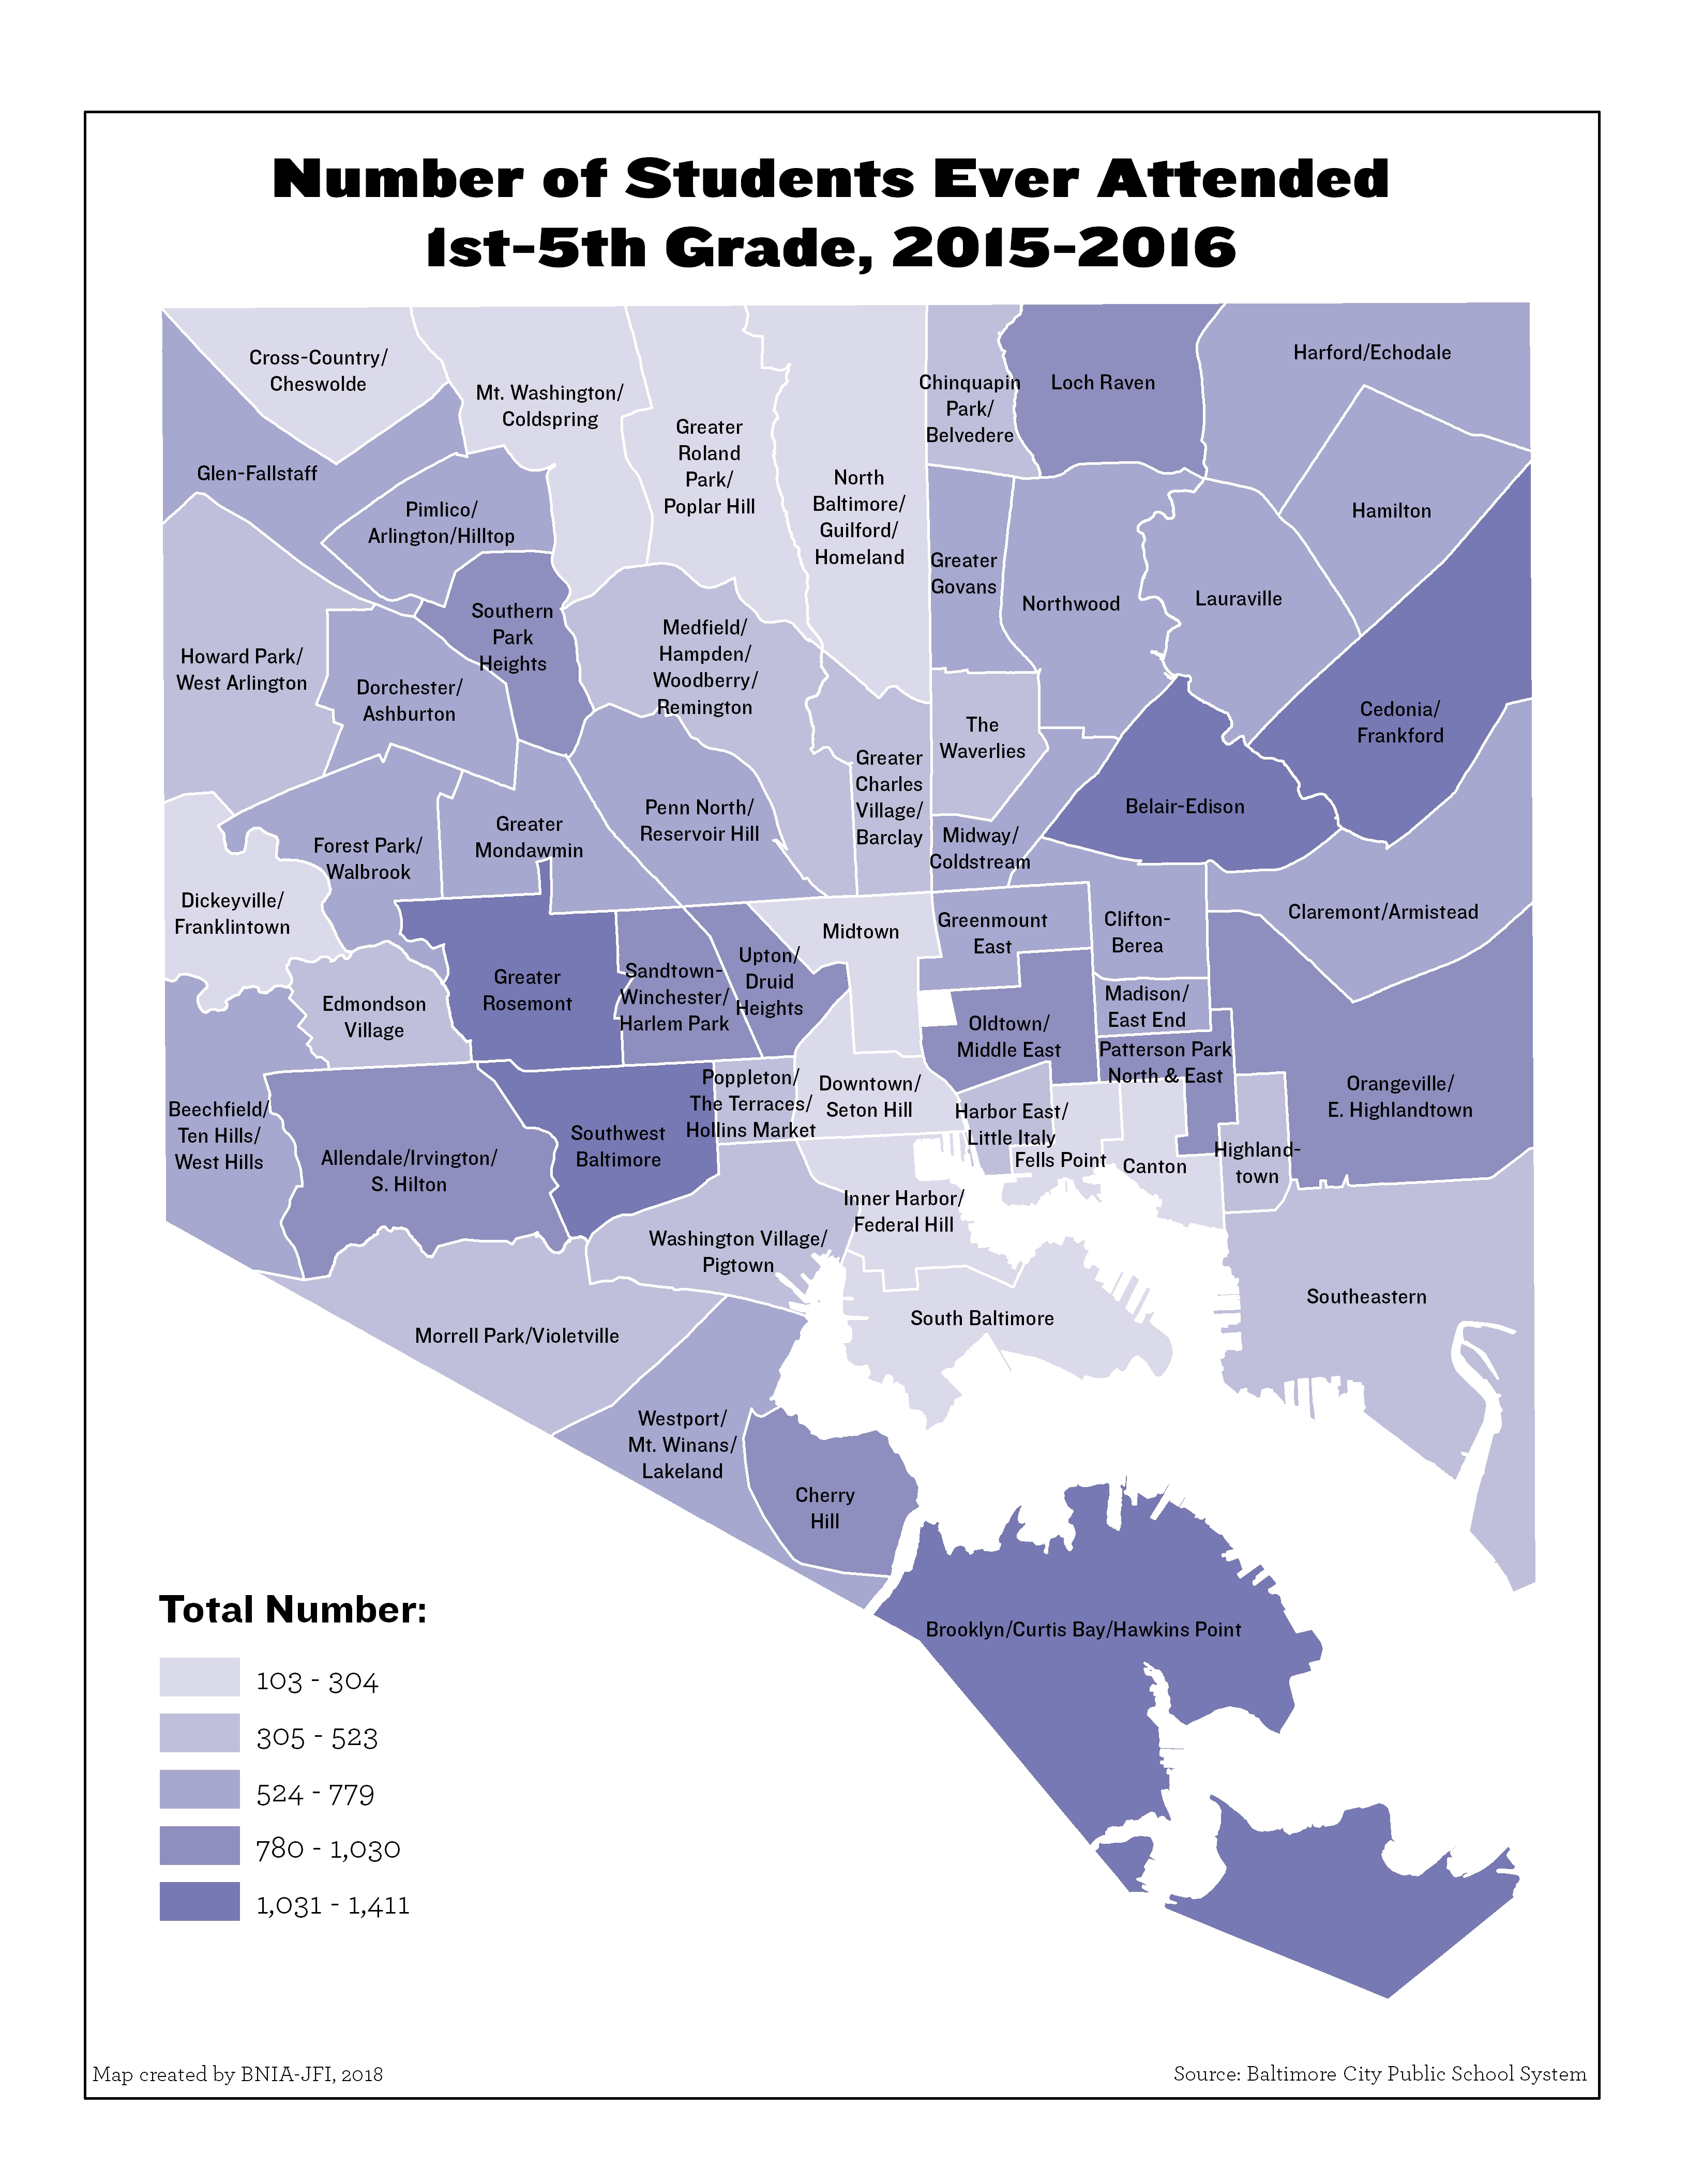
Number of Students Ever Attended 1st-5th Grade (2019-2020)
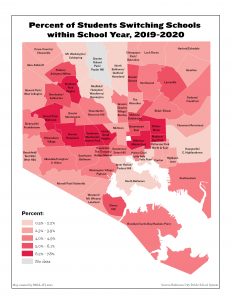
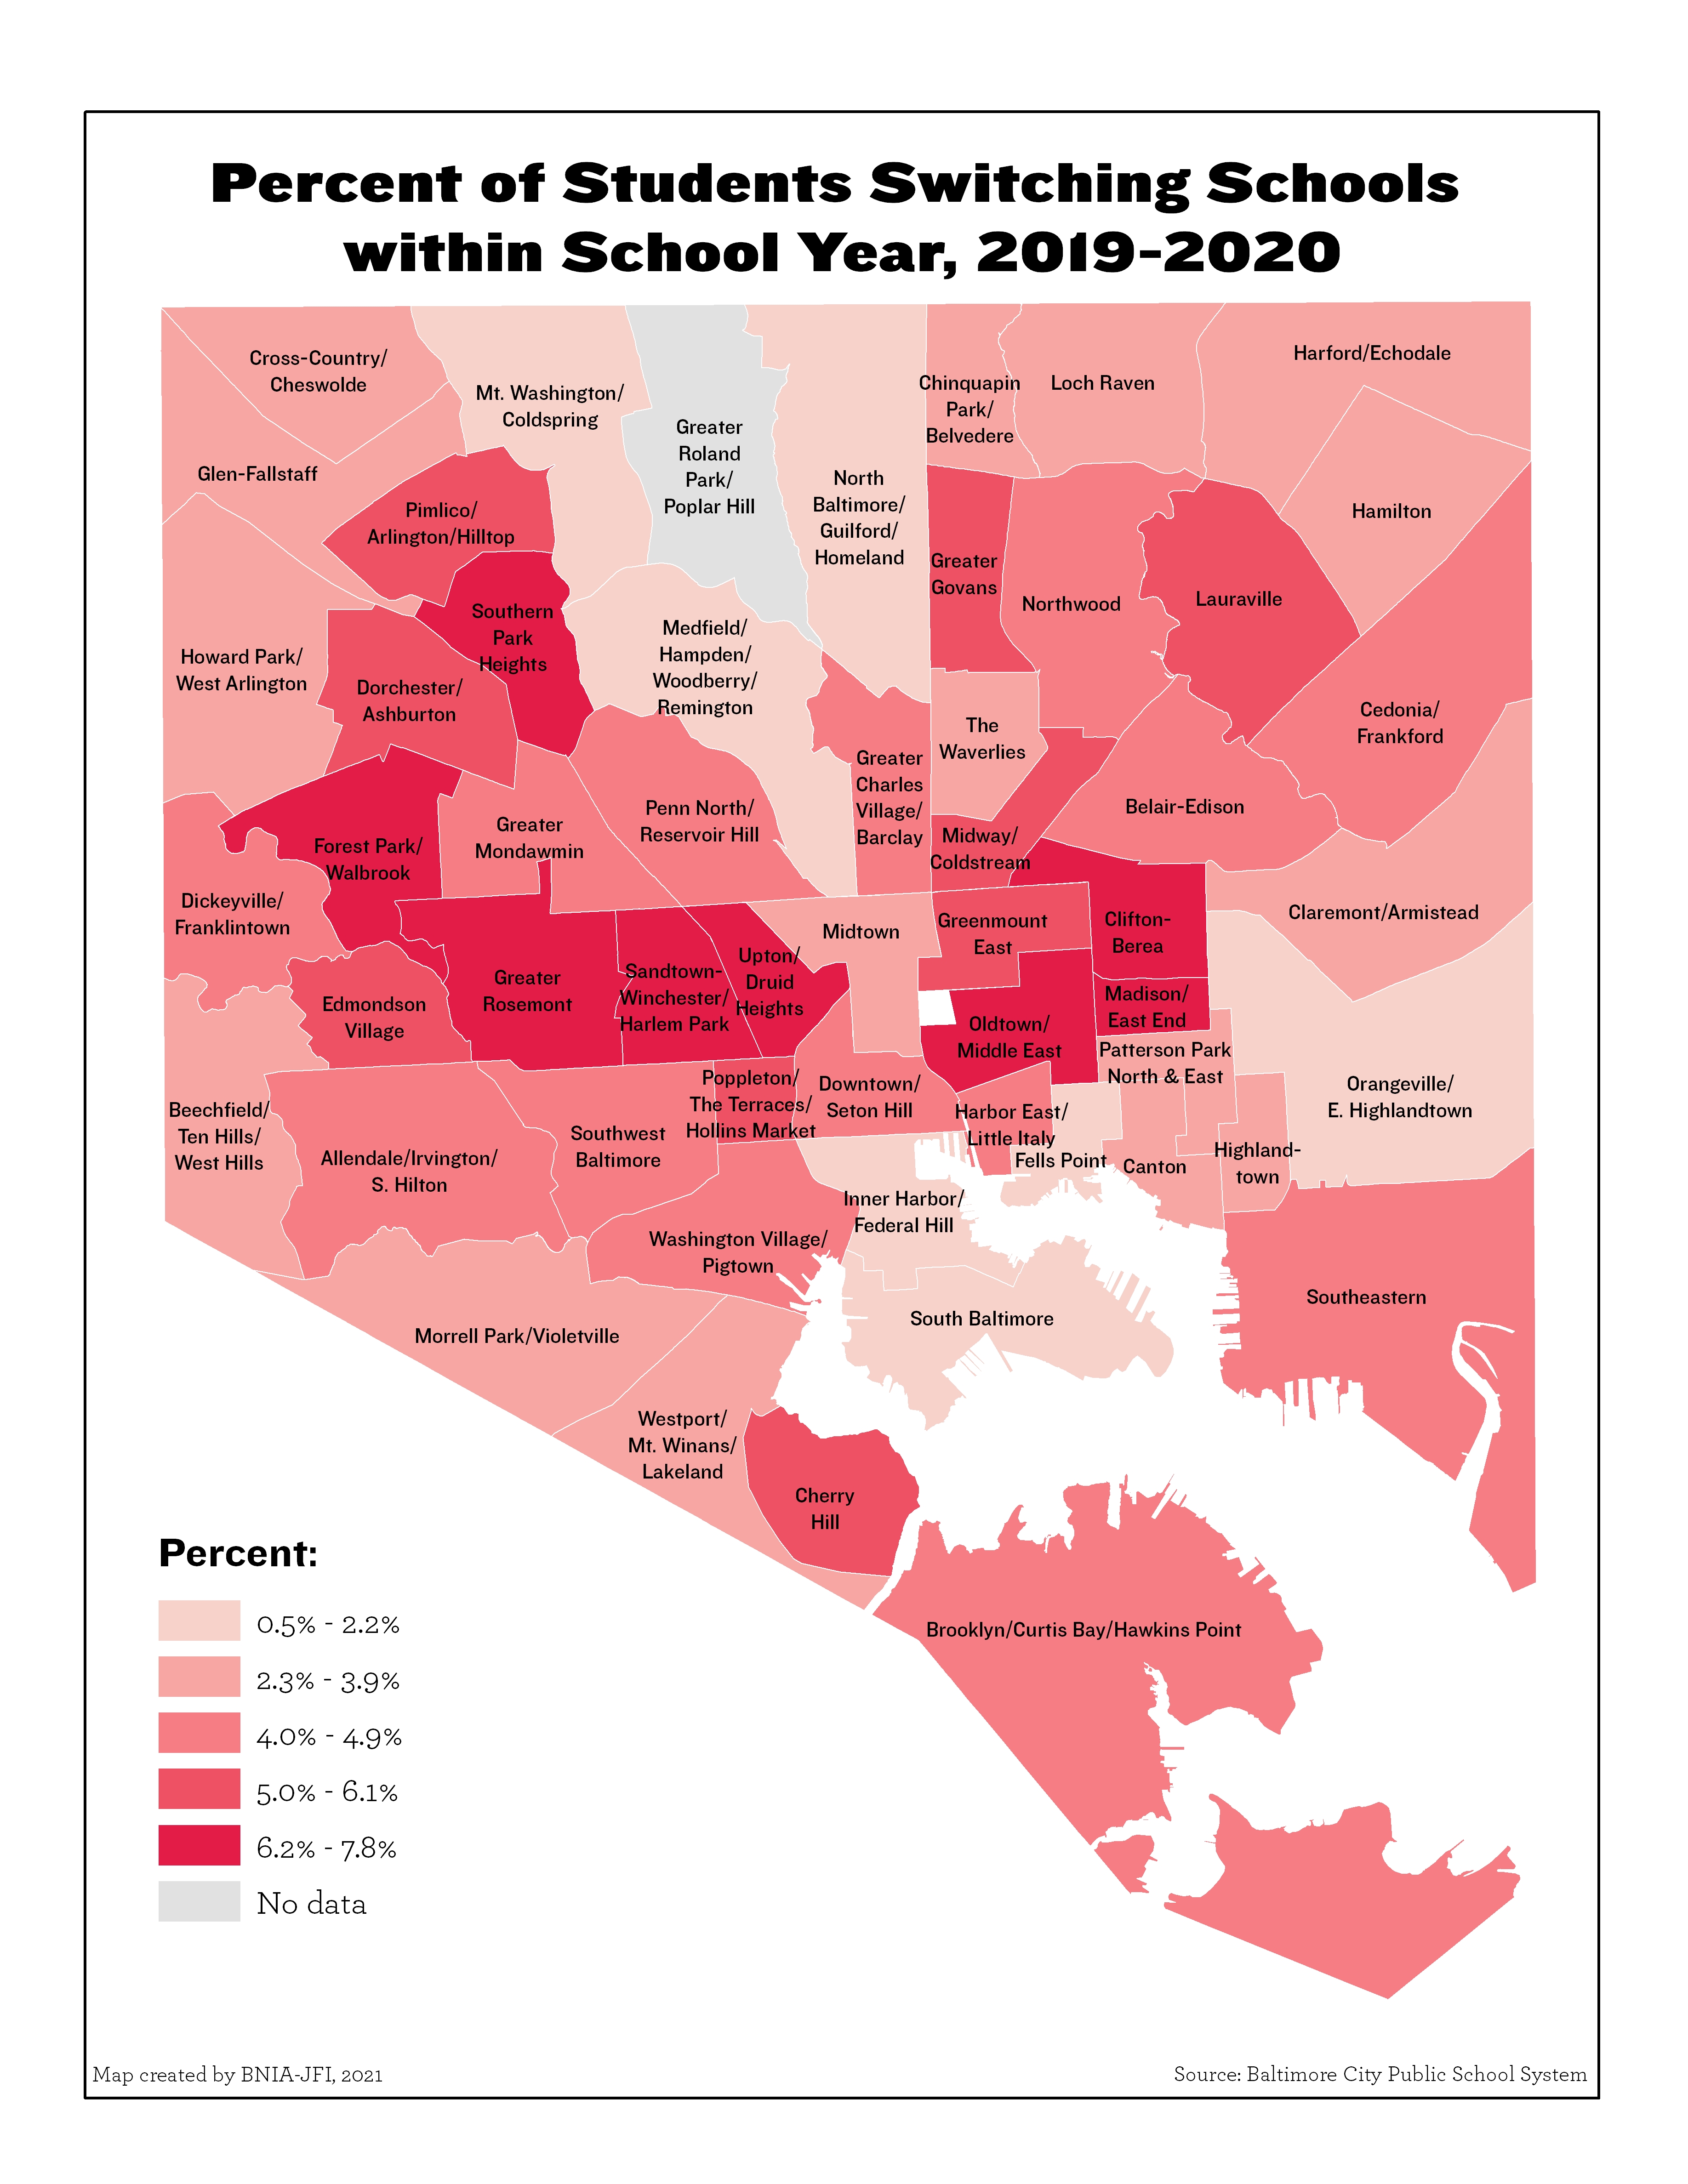
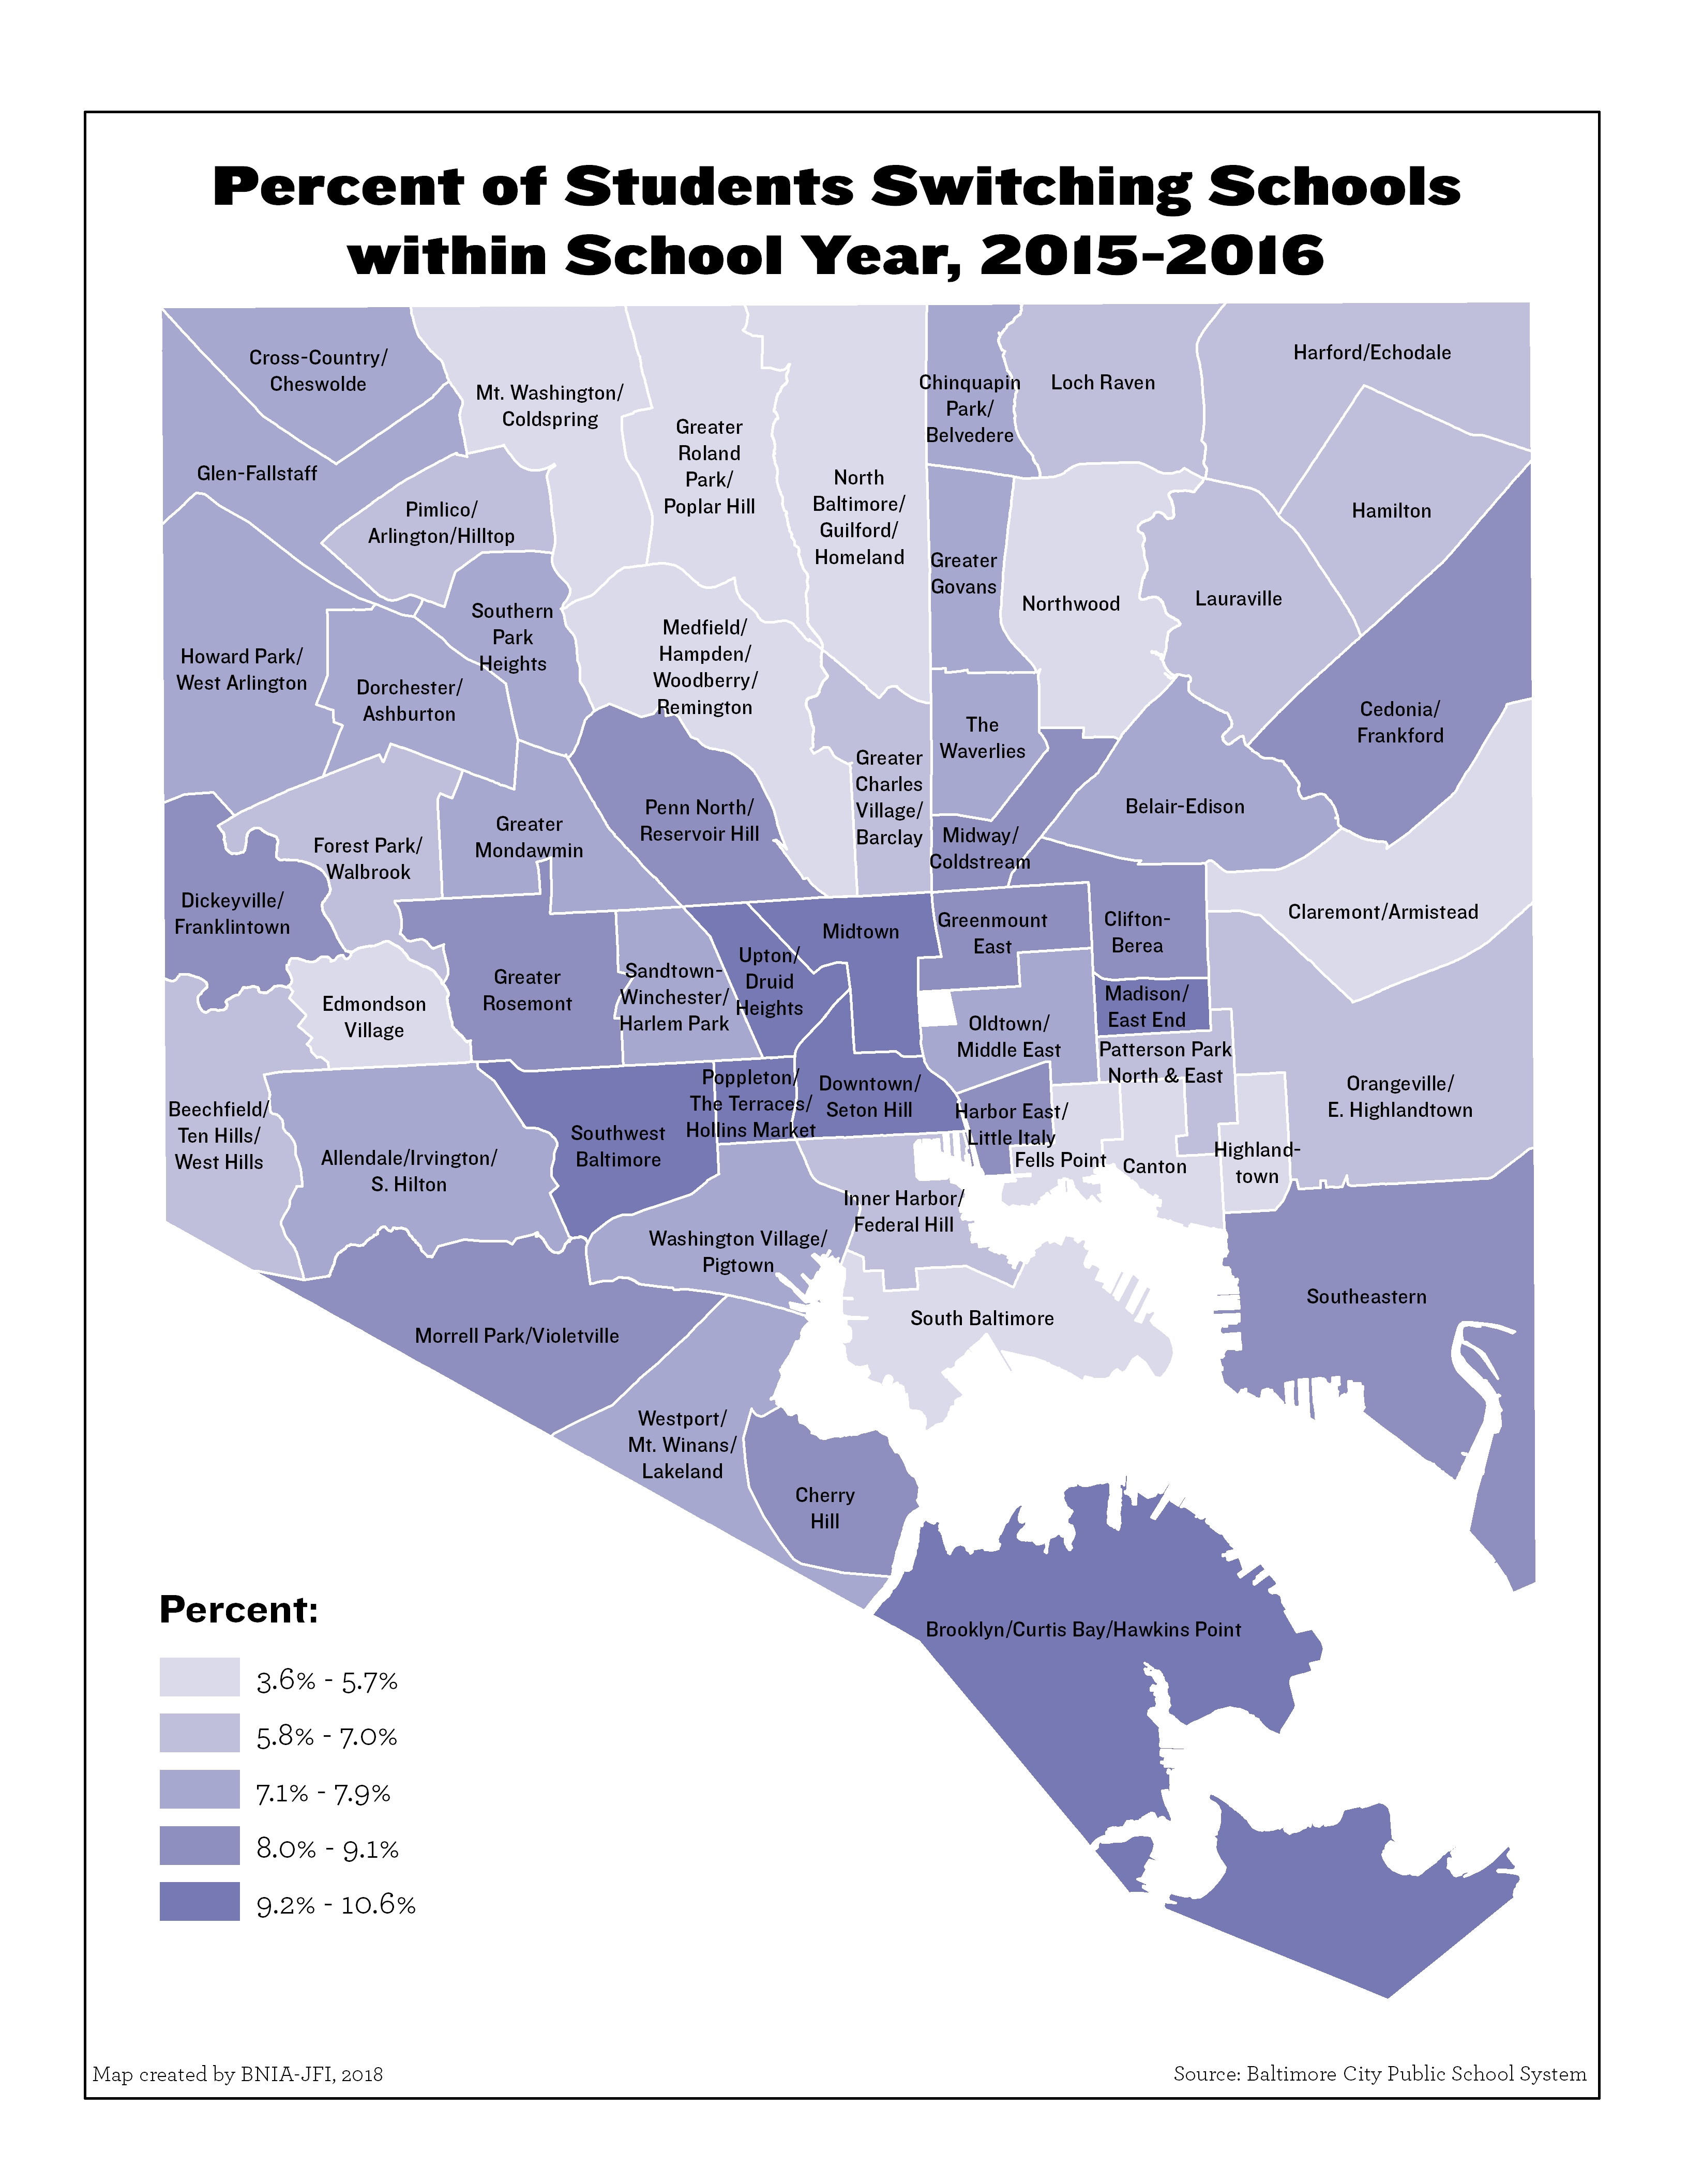
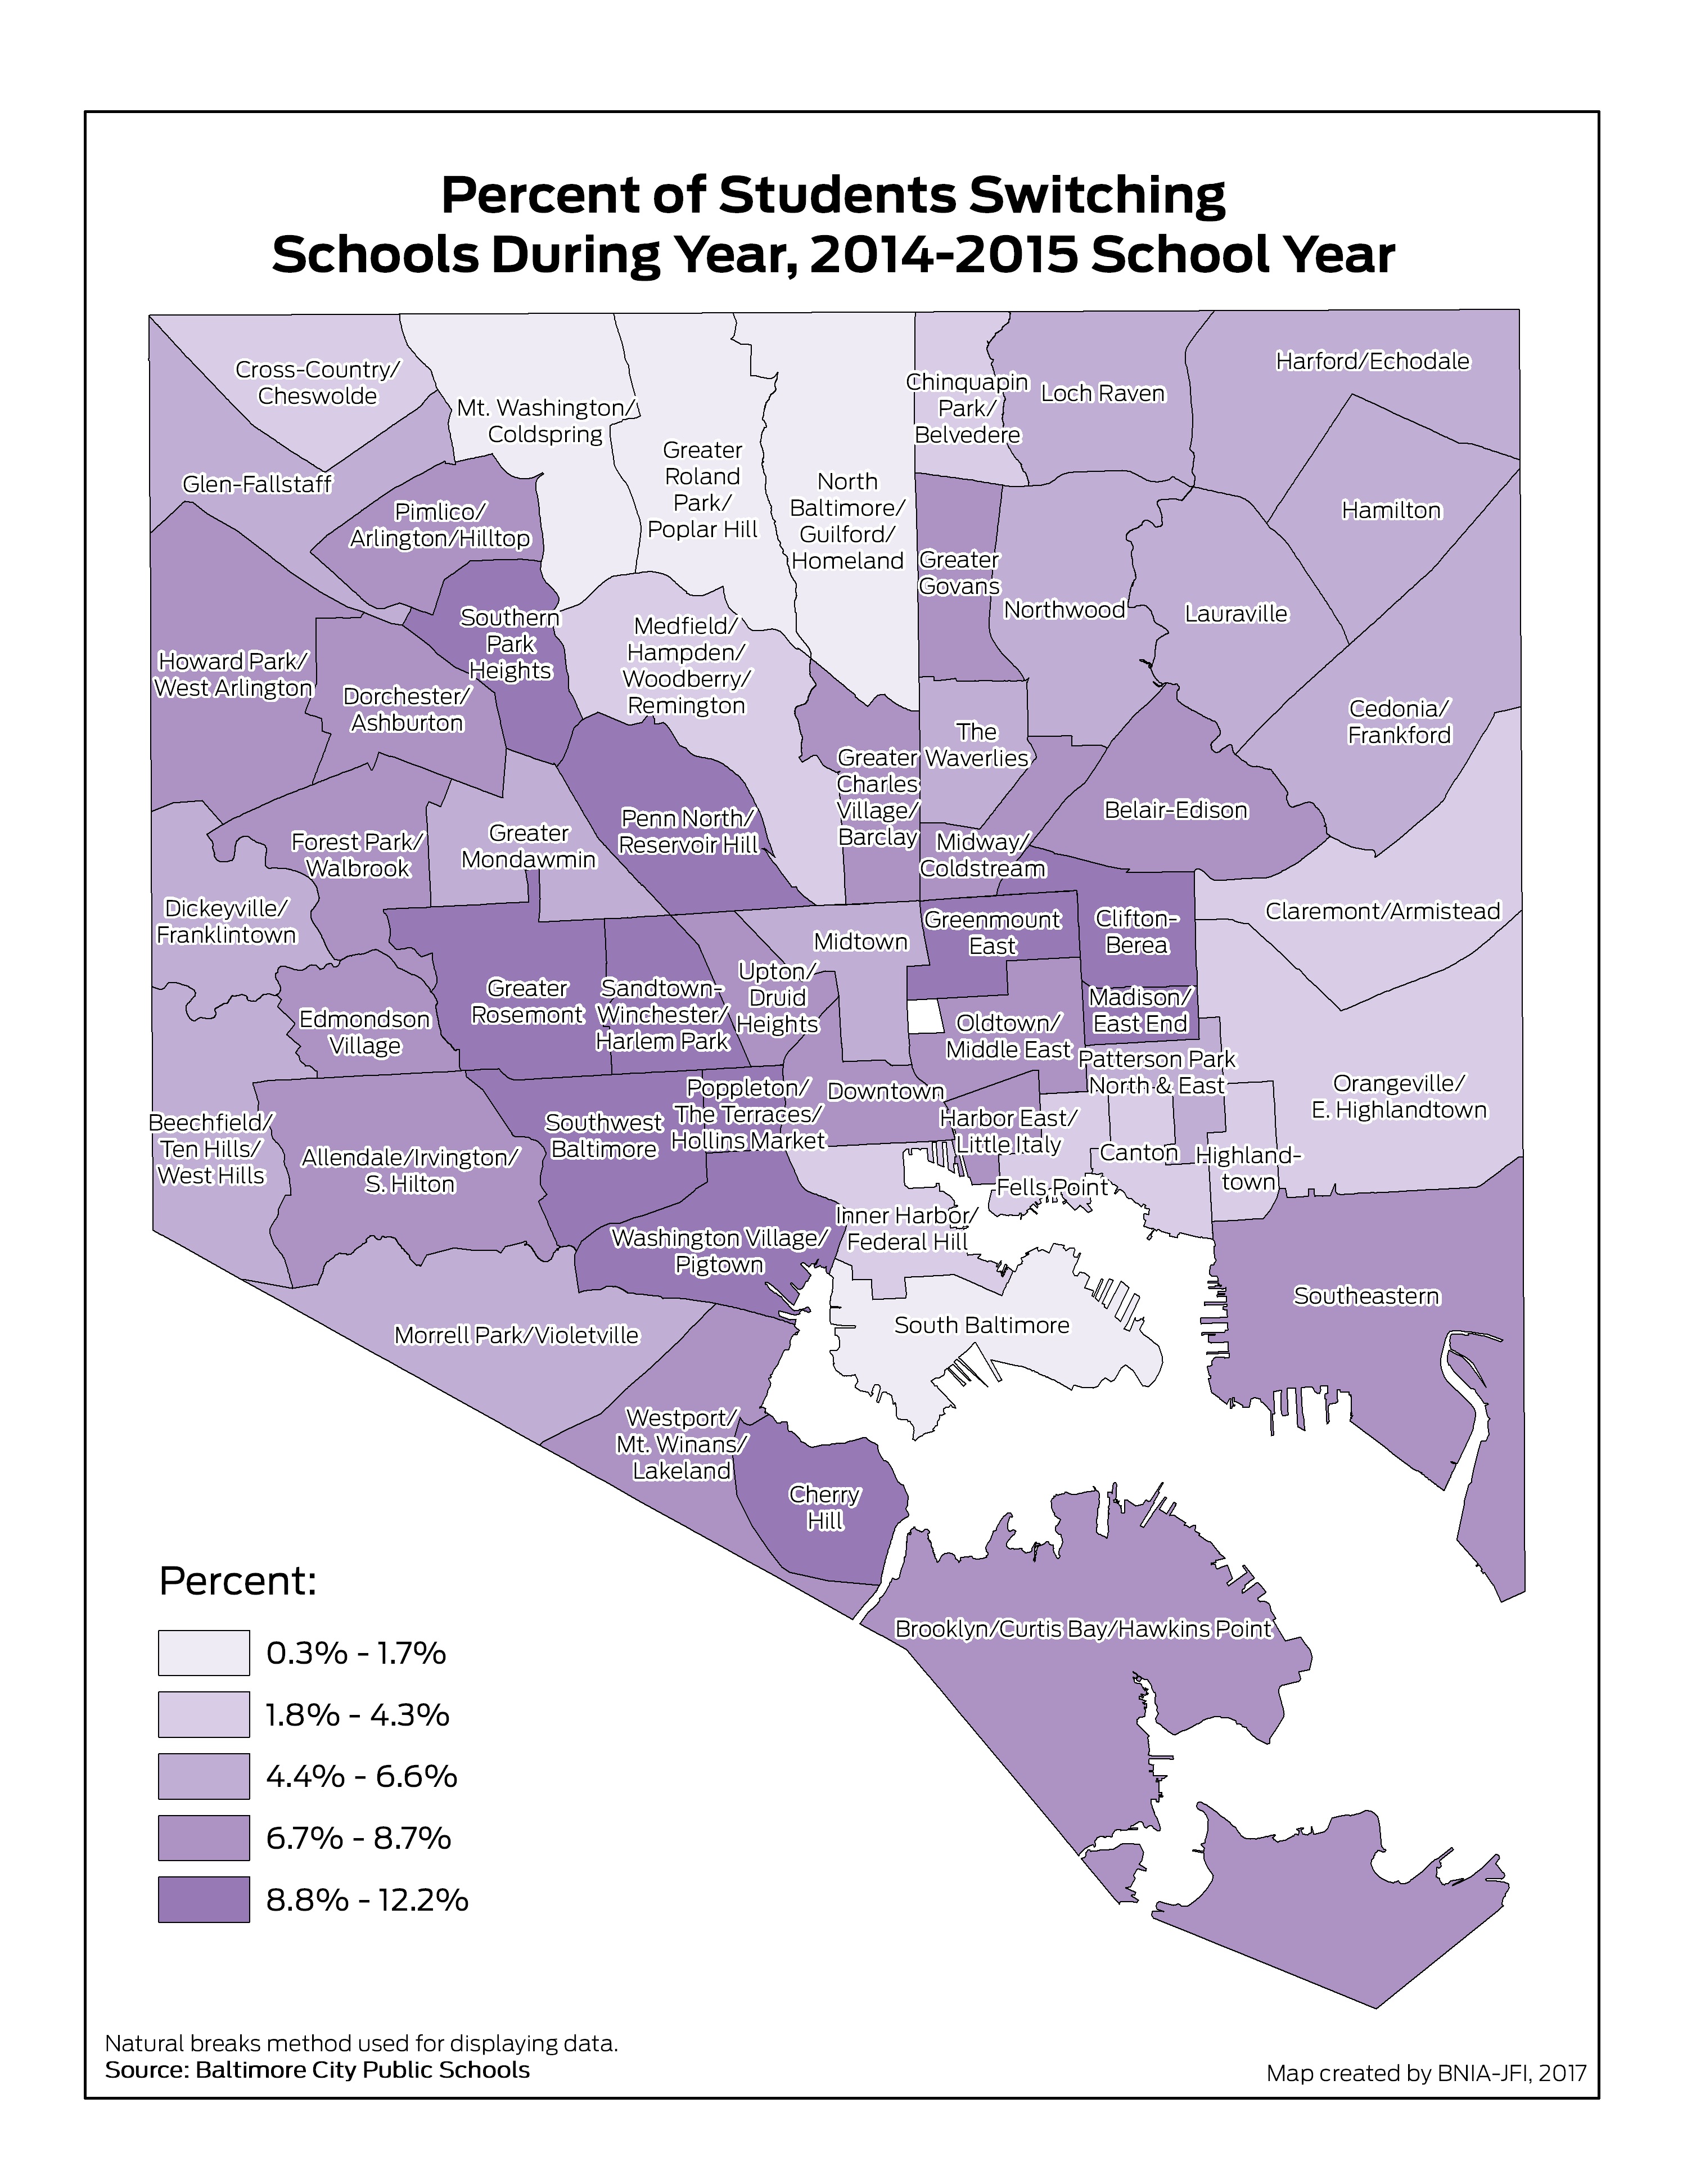
Percent of Students Switching Schools within School Year (2019-2020)
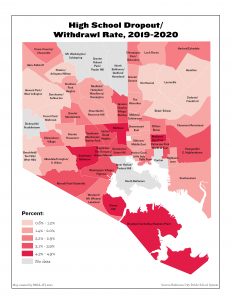
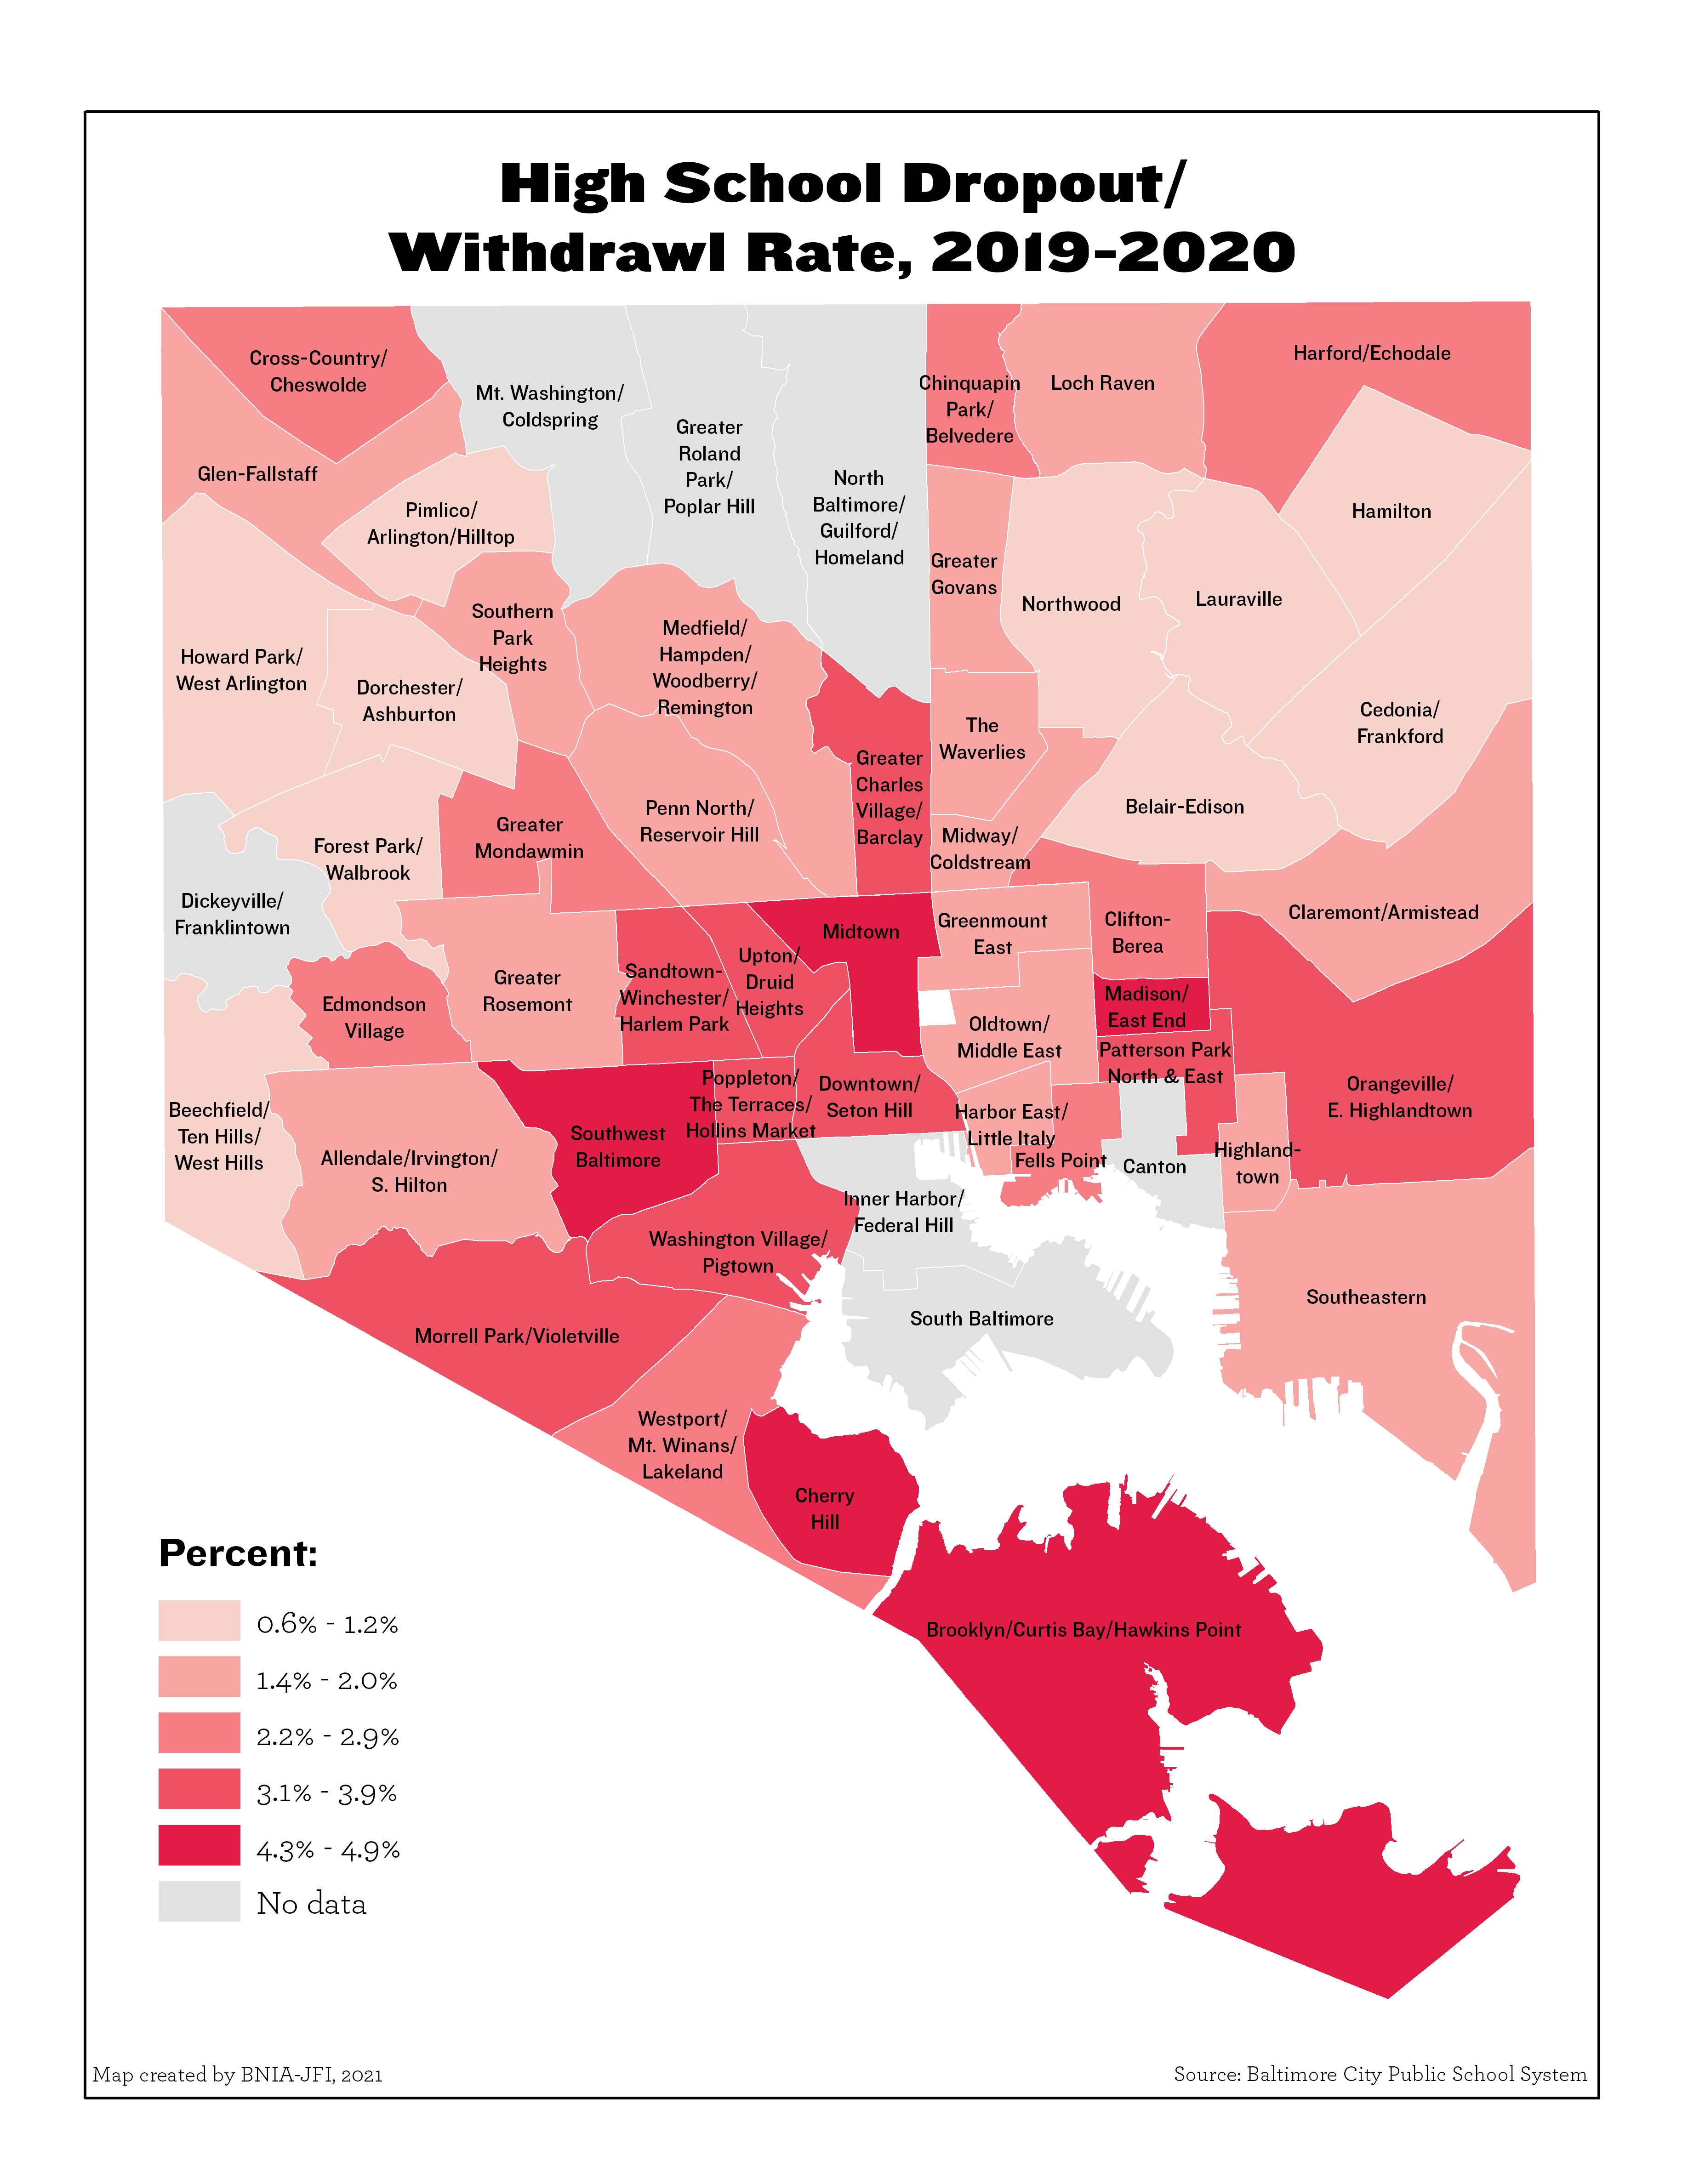
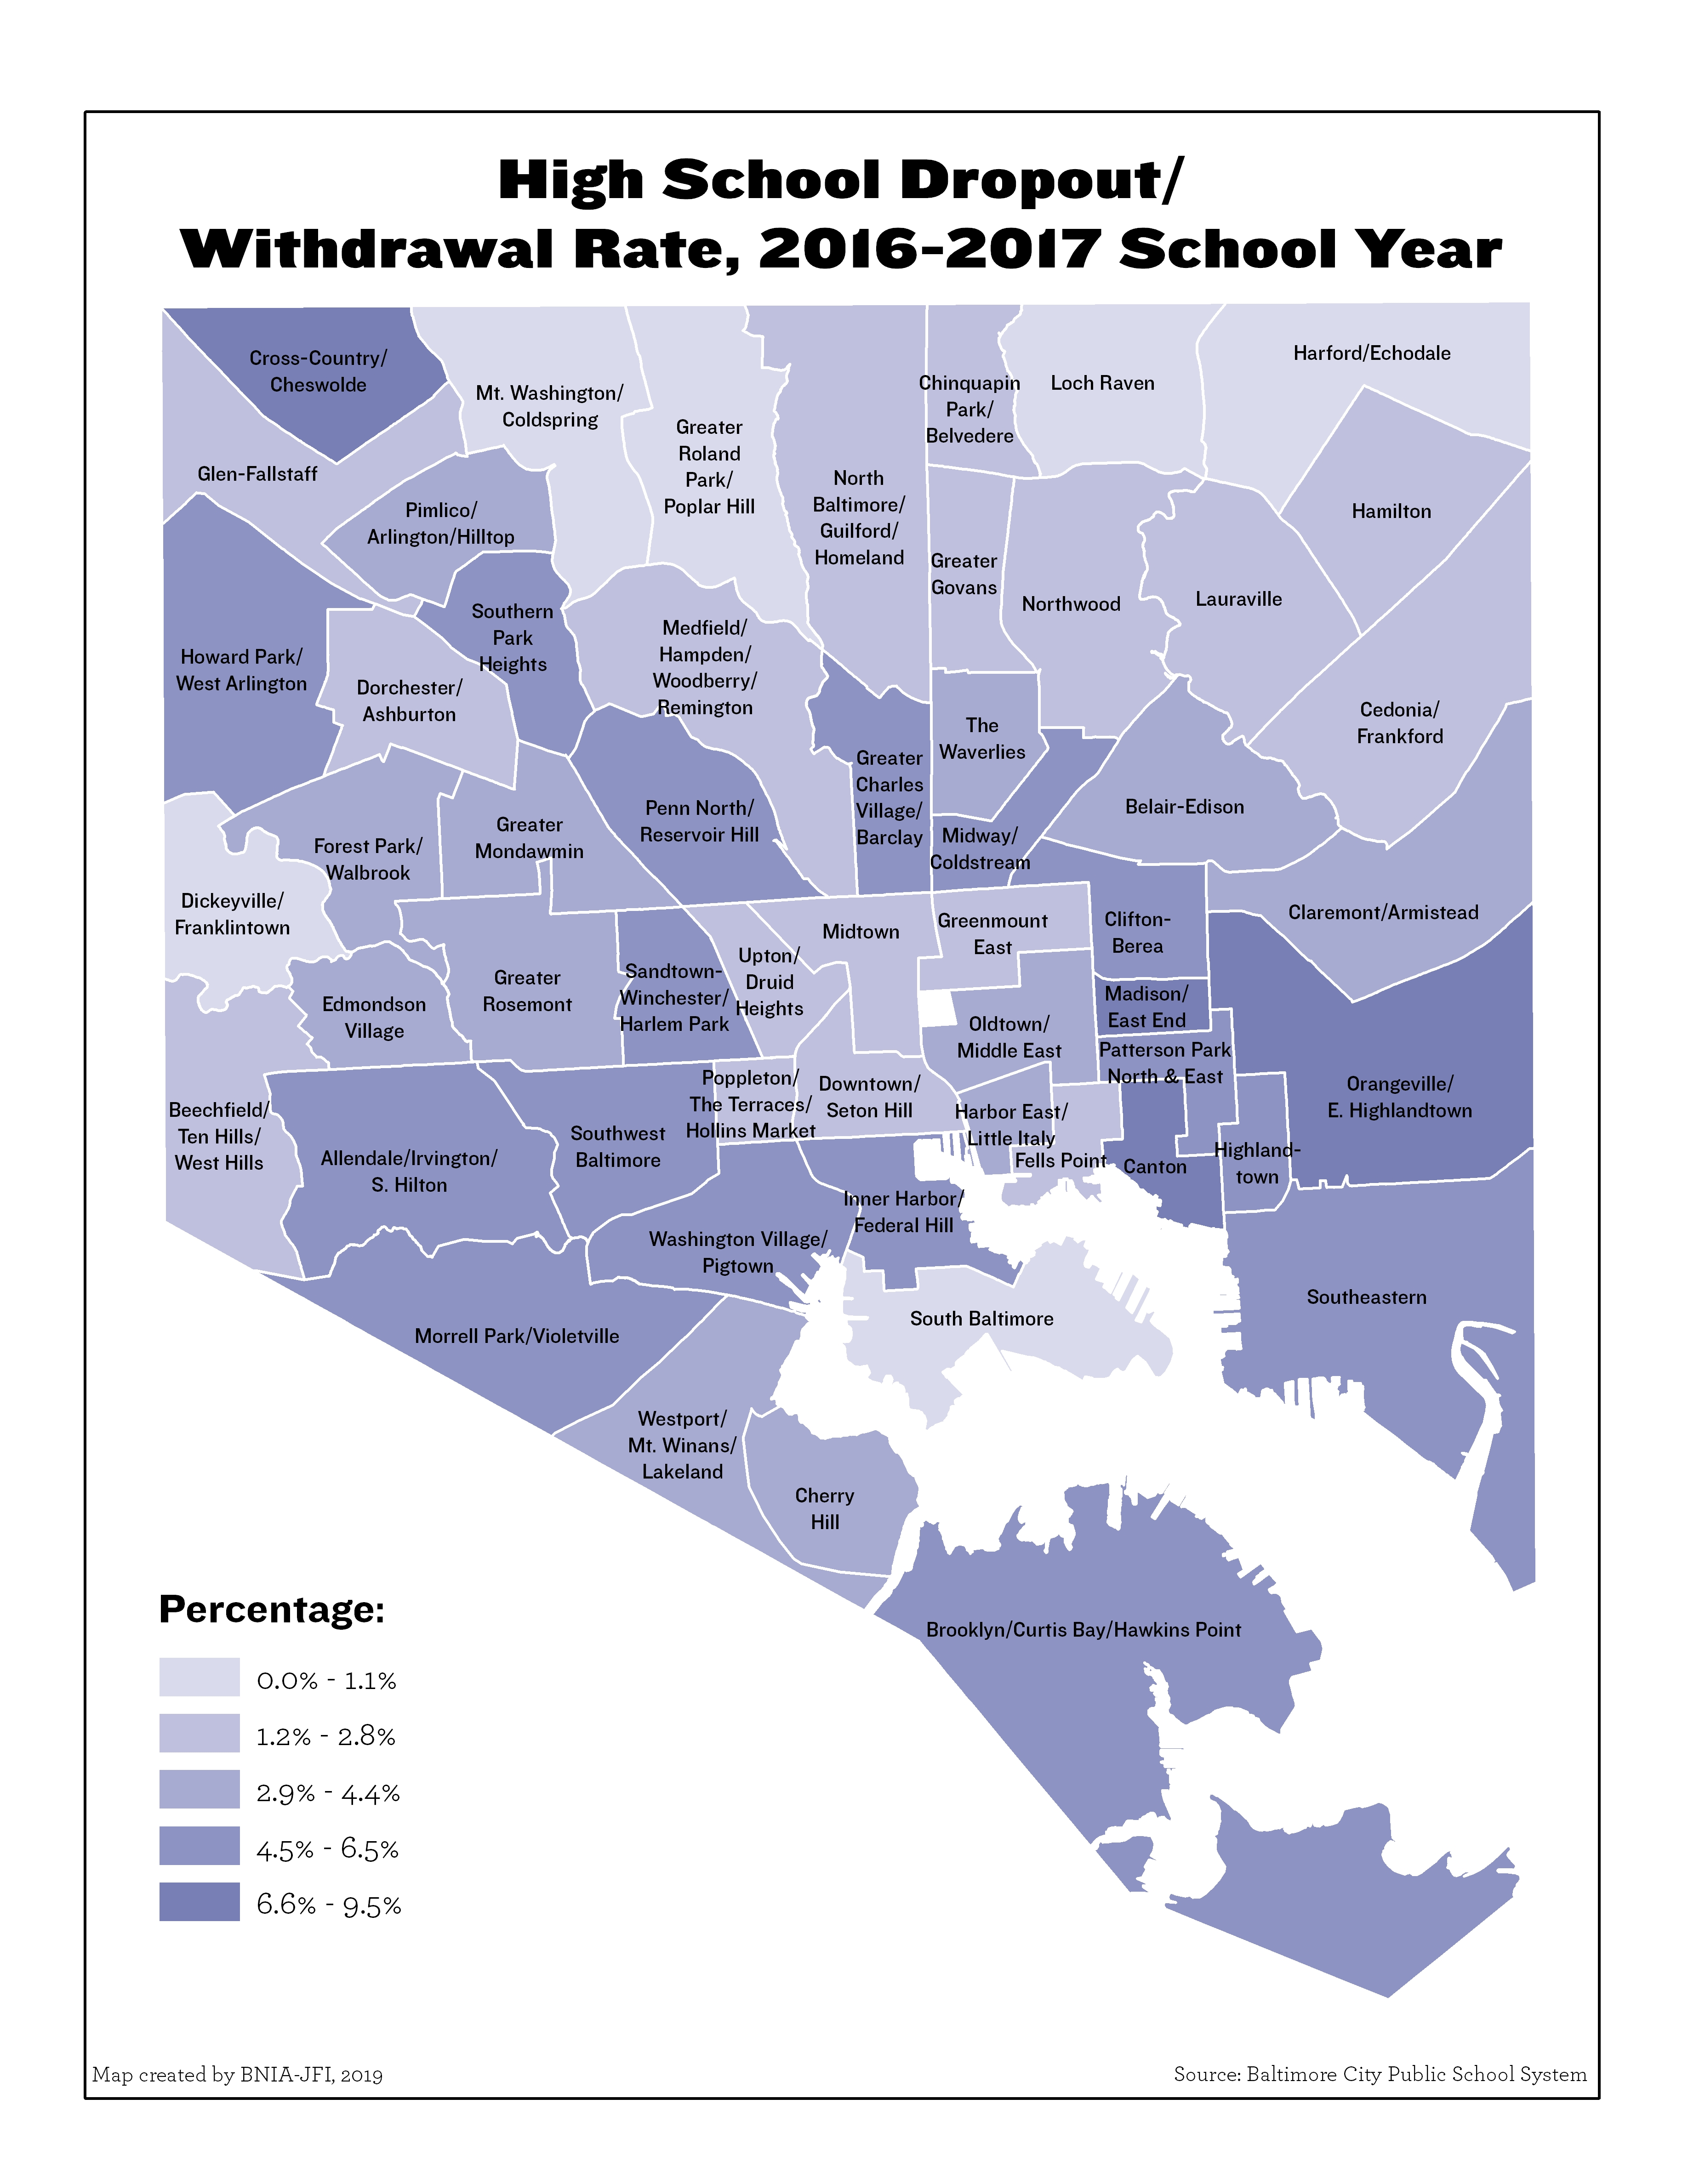
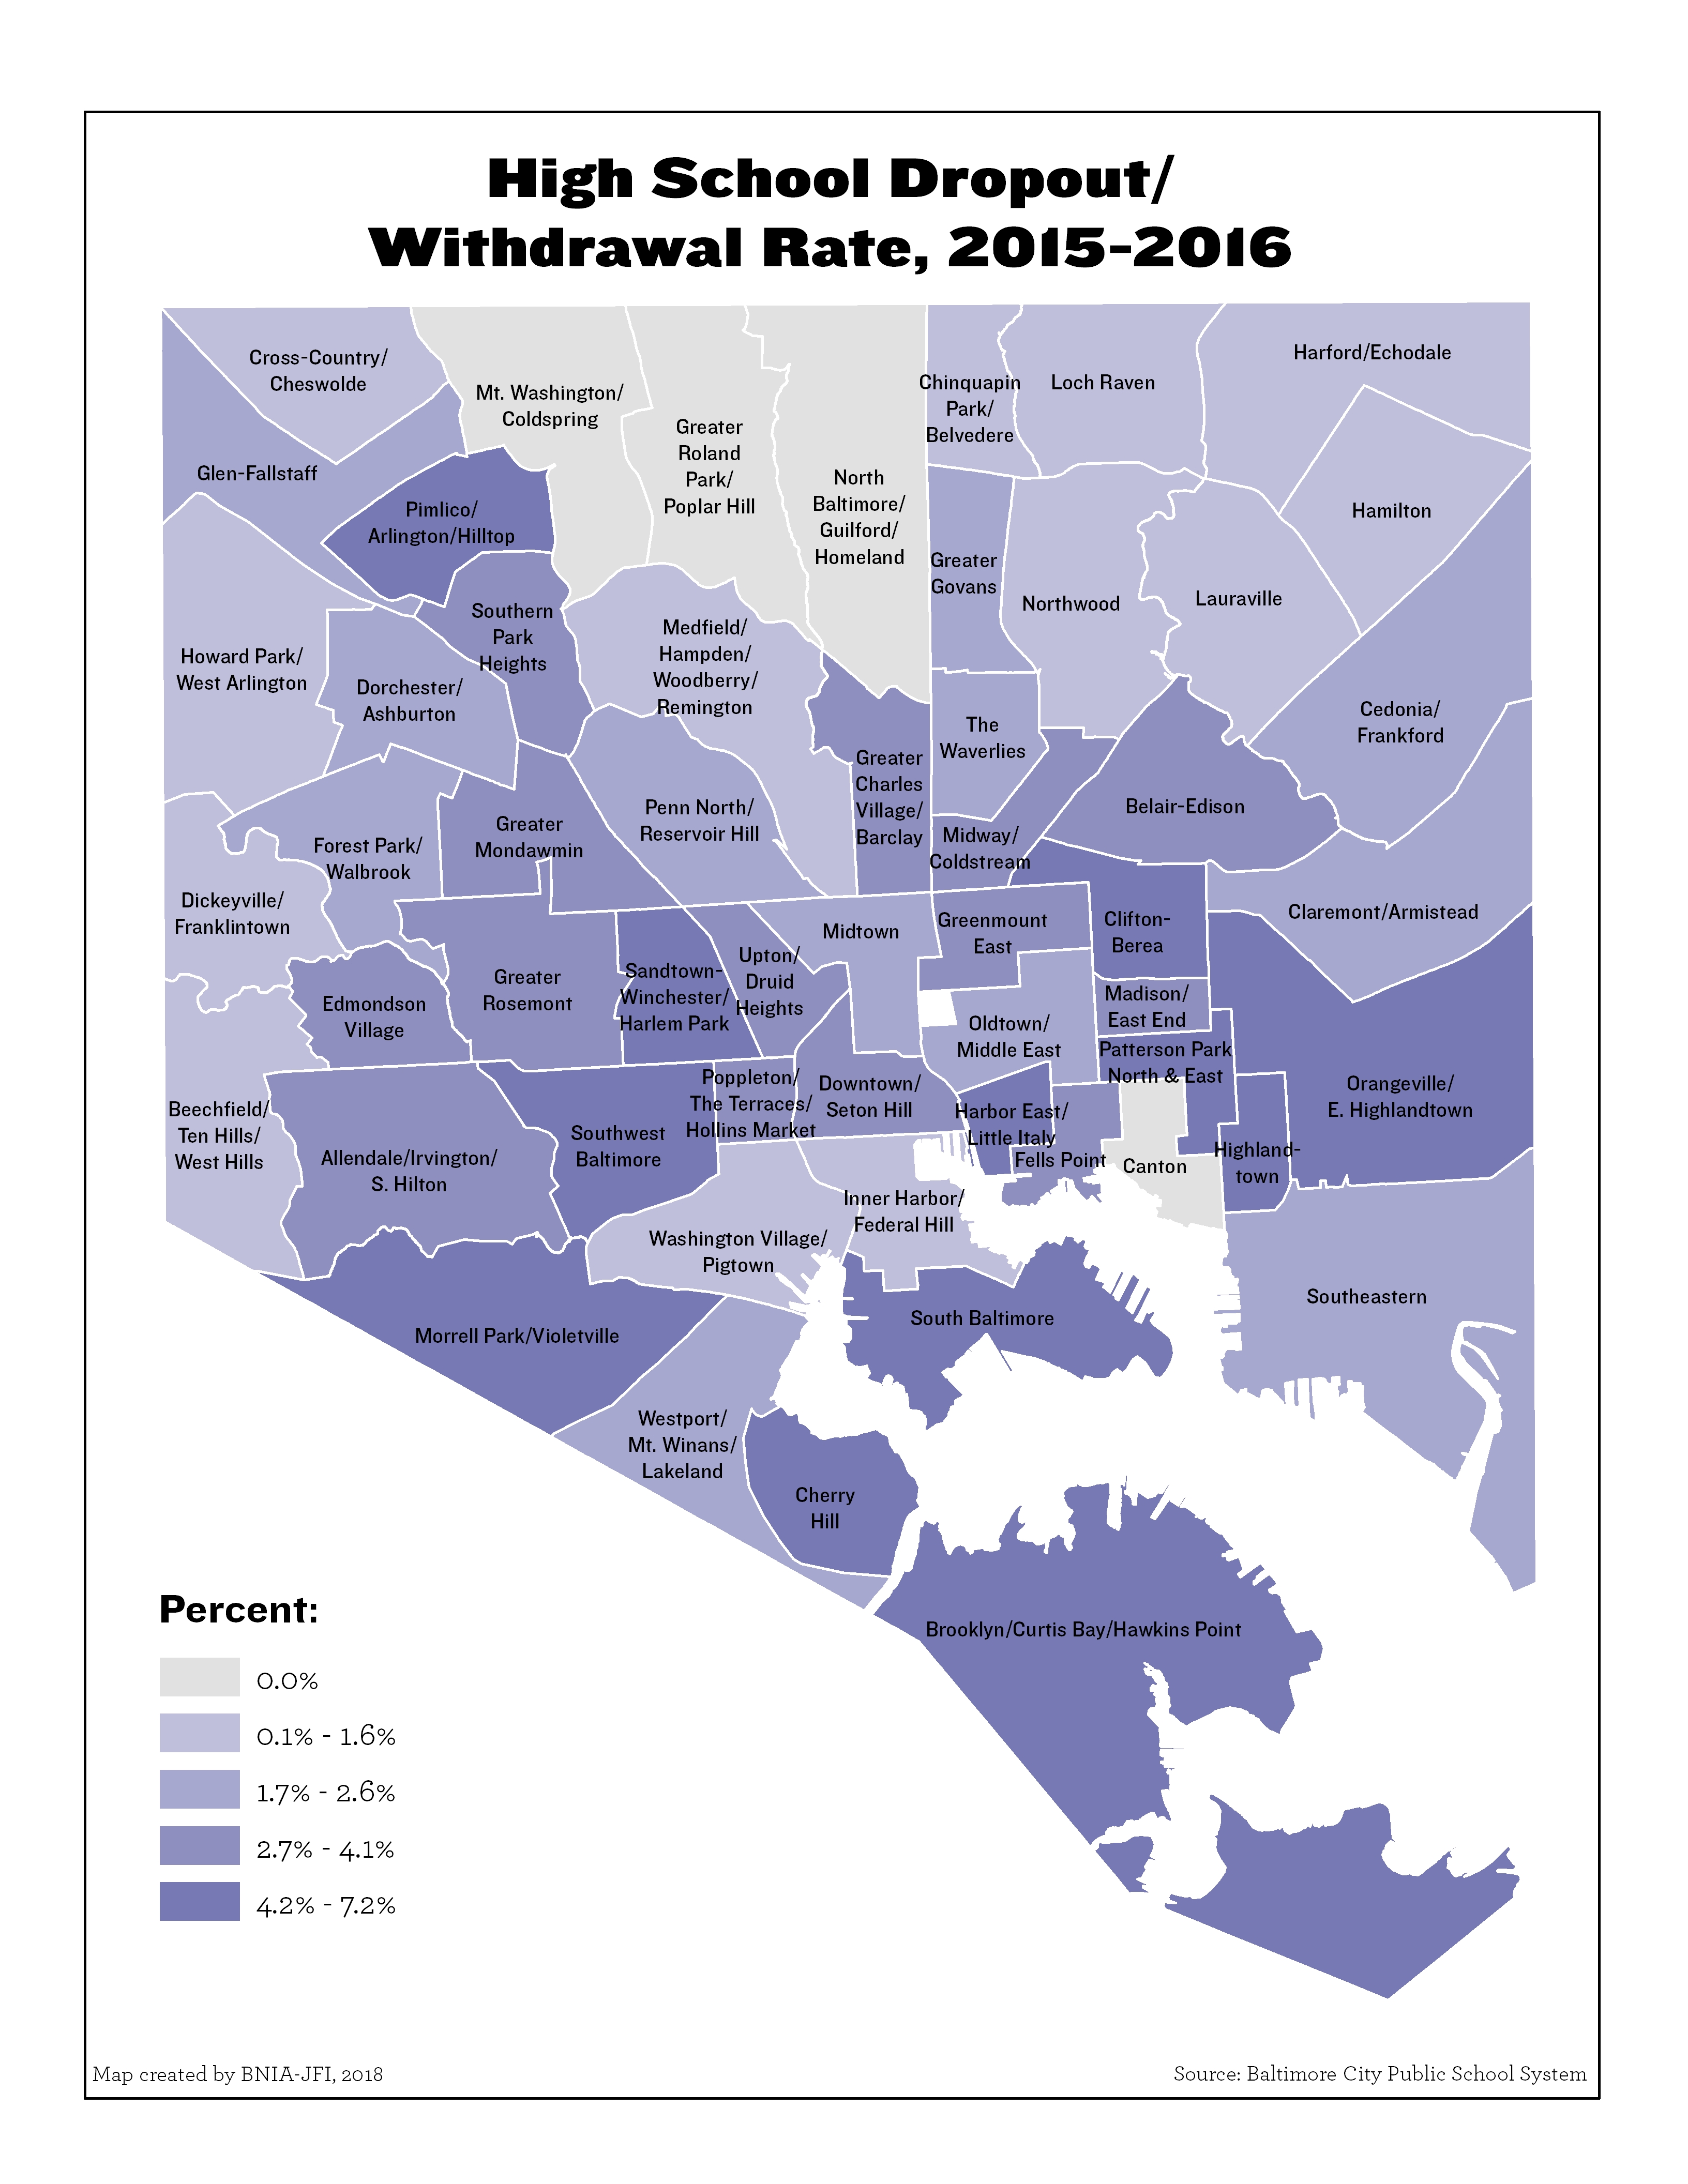
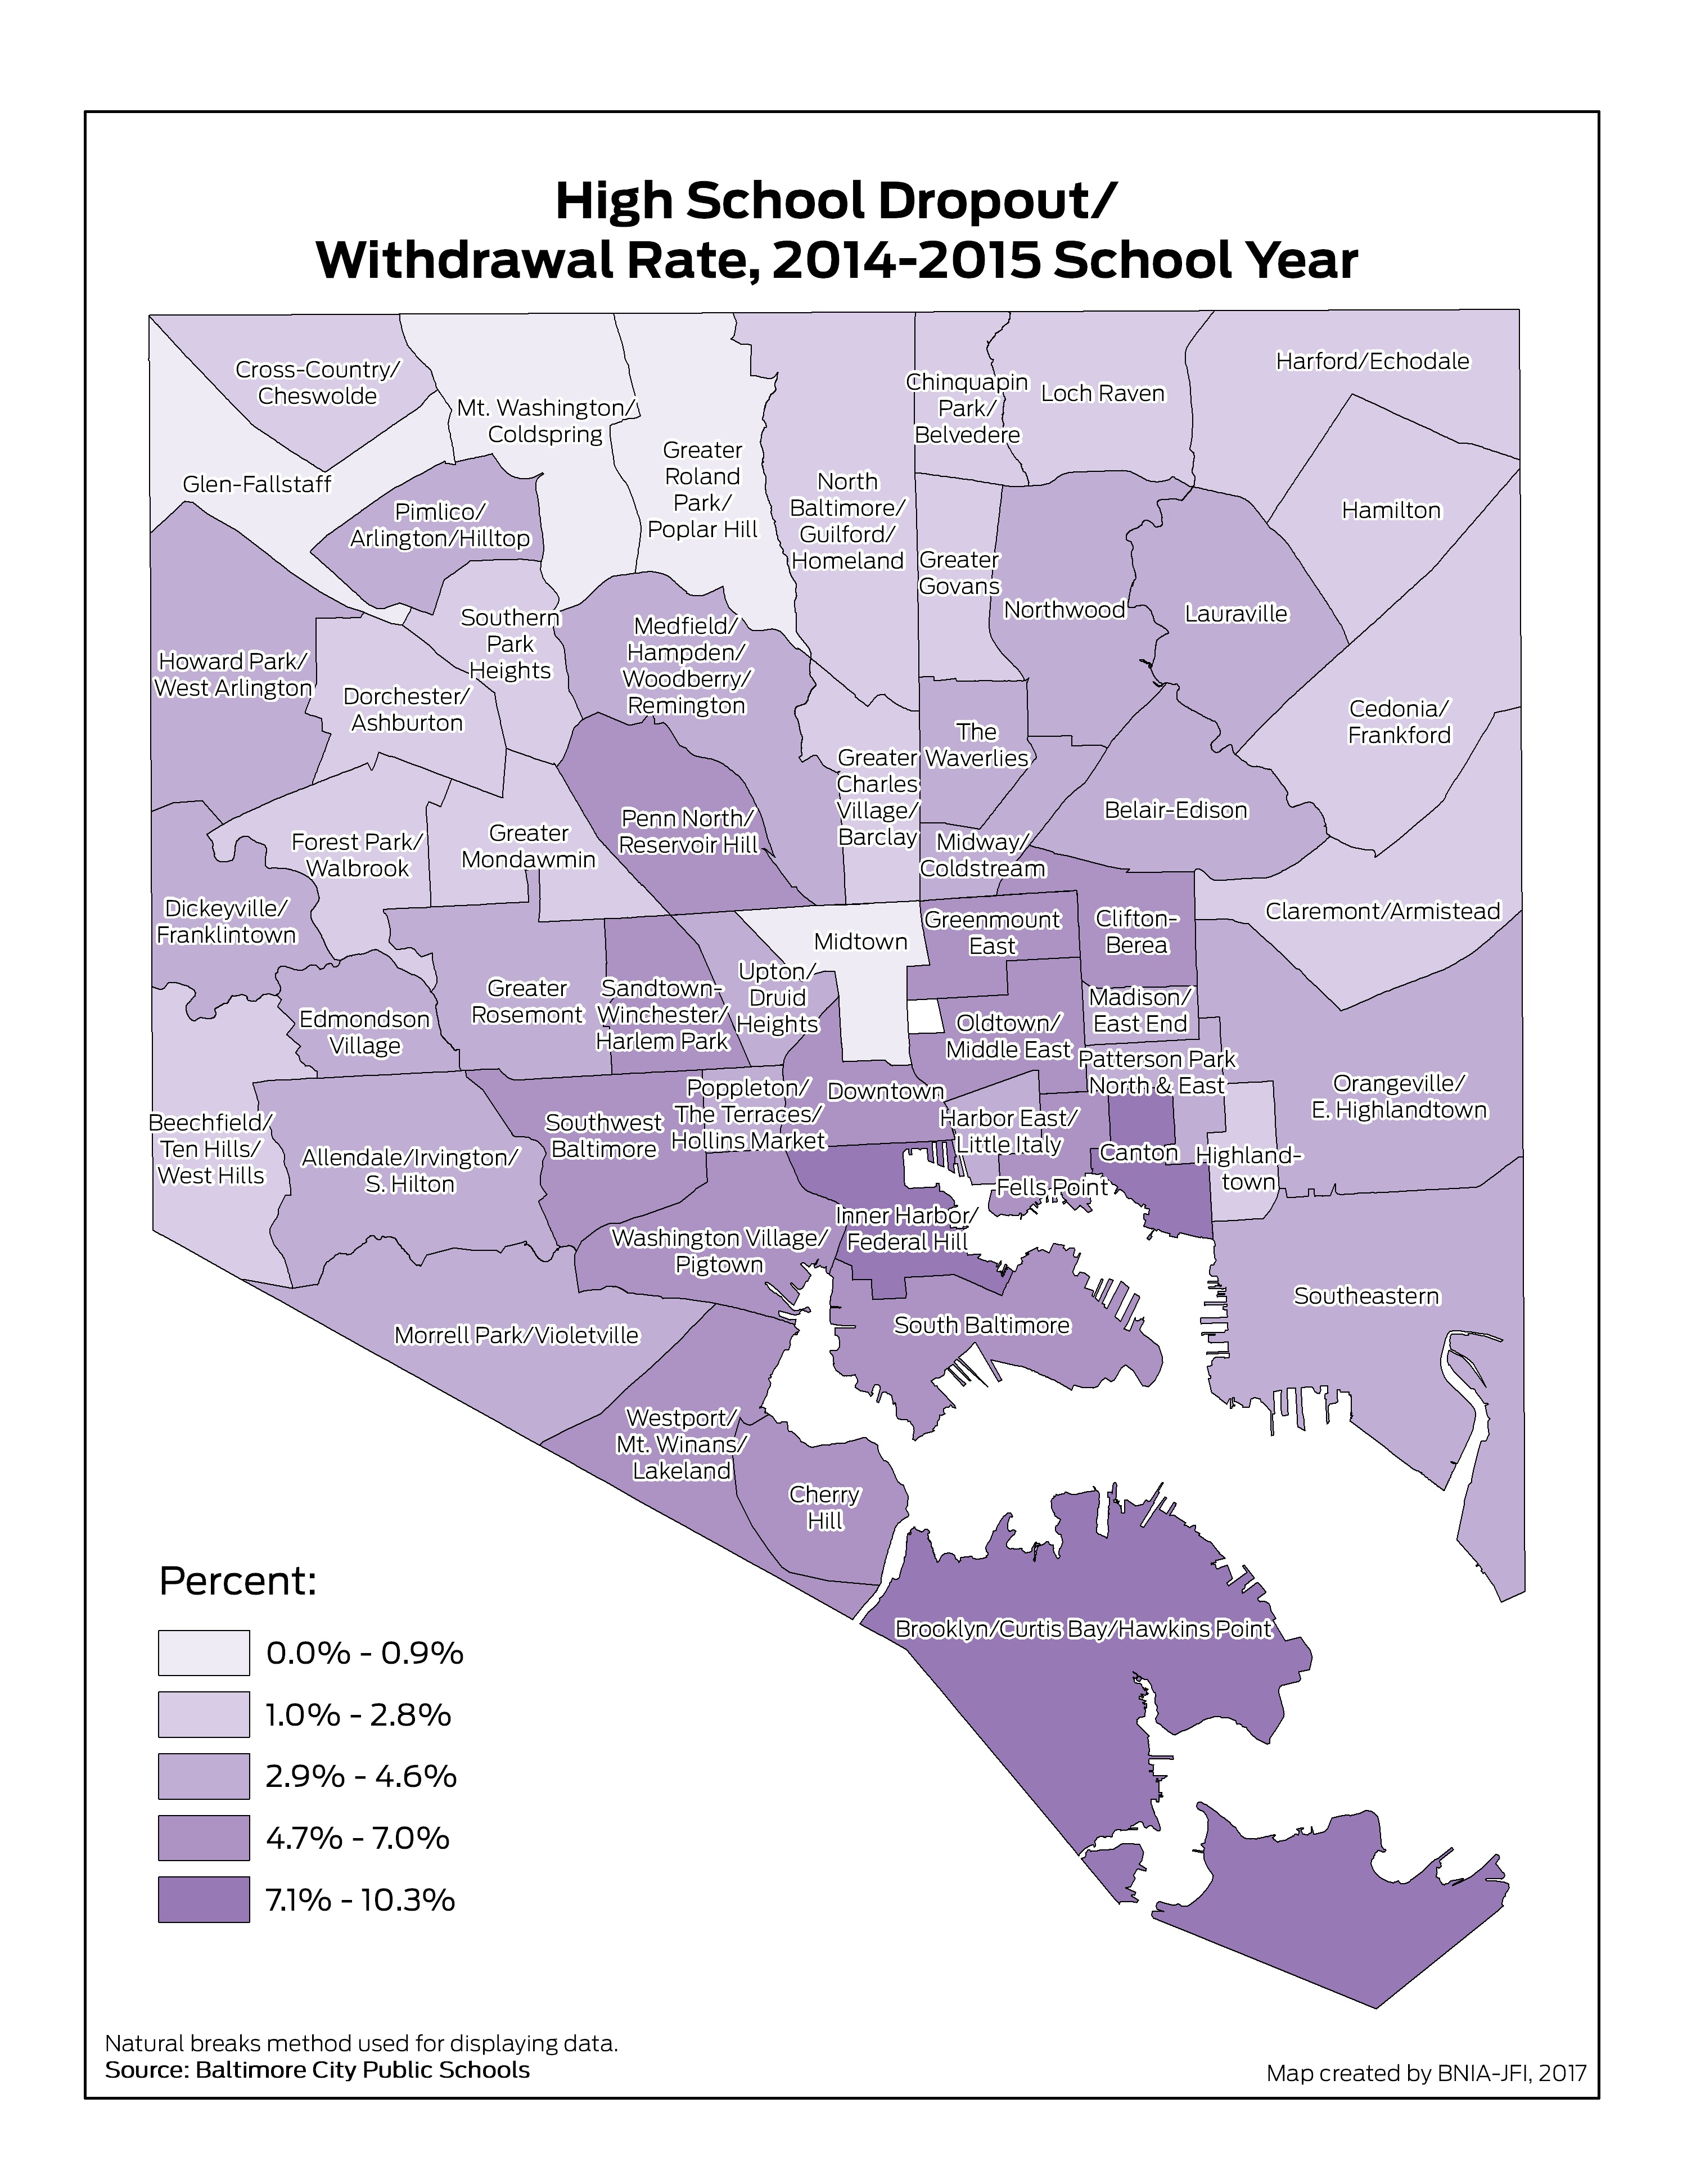
High School Dropout/Withdrawl Rate (2019-2020)
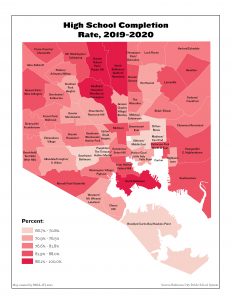
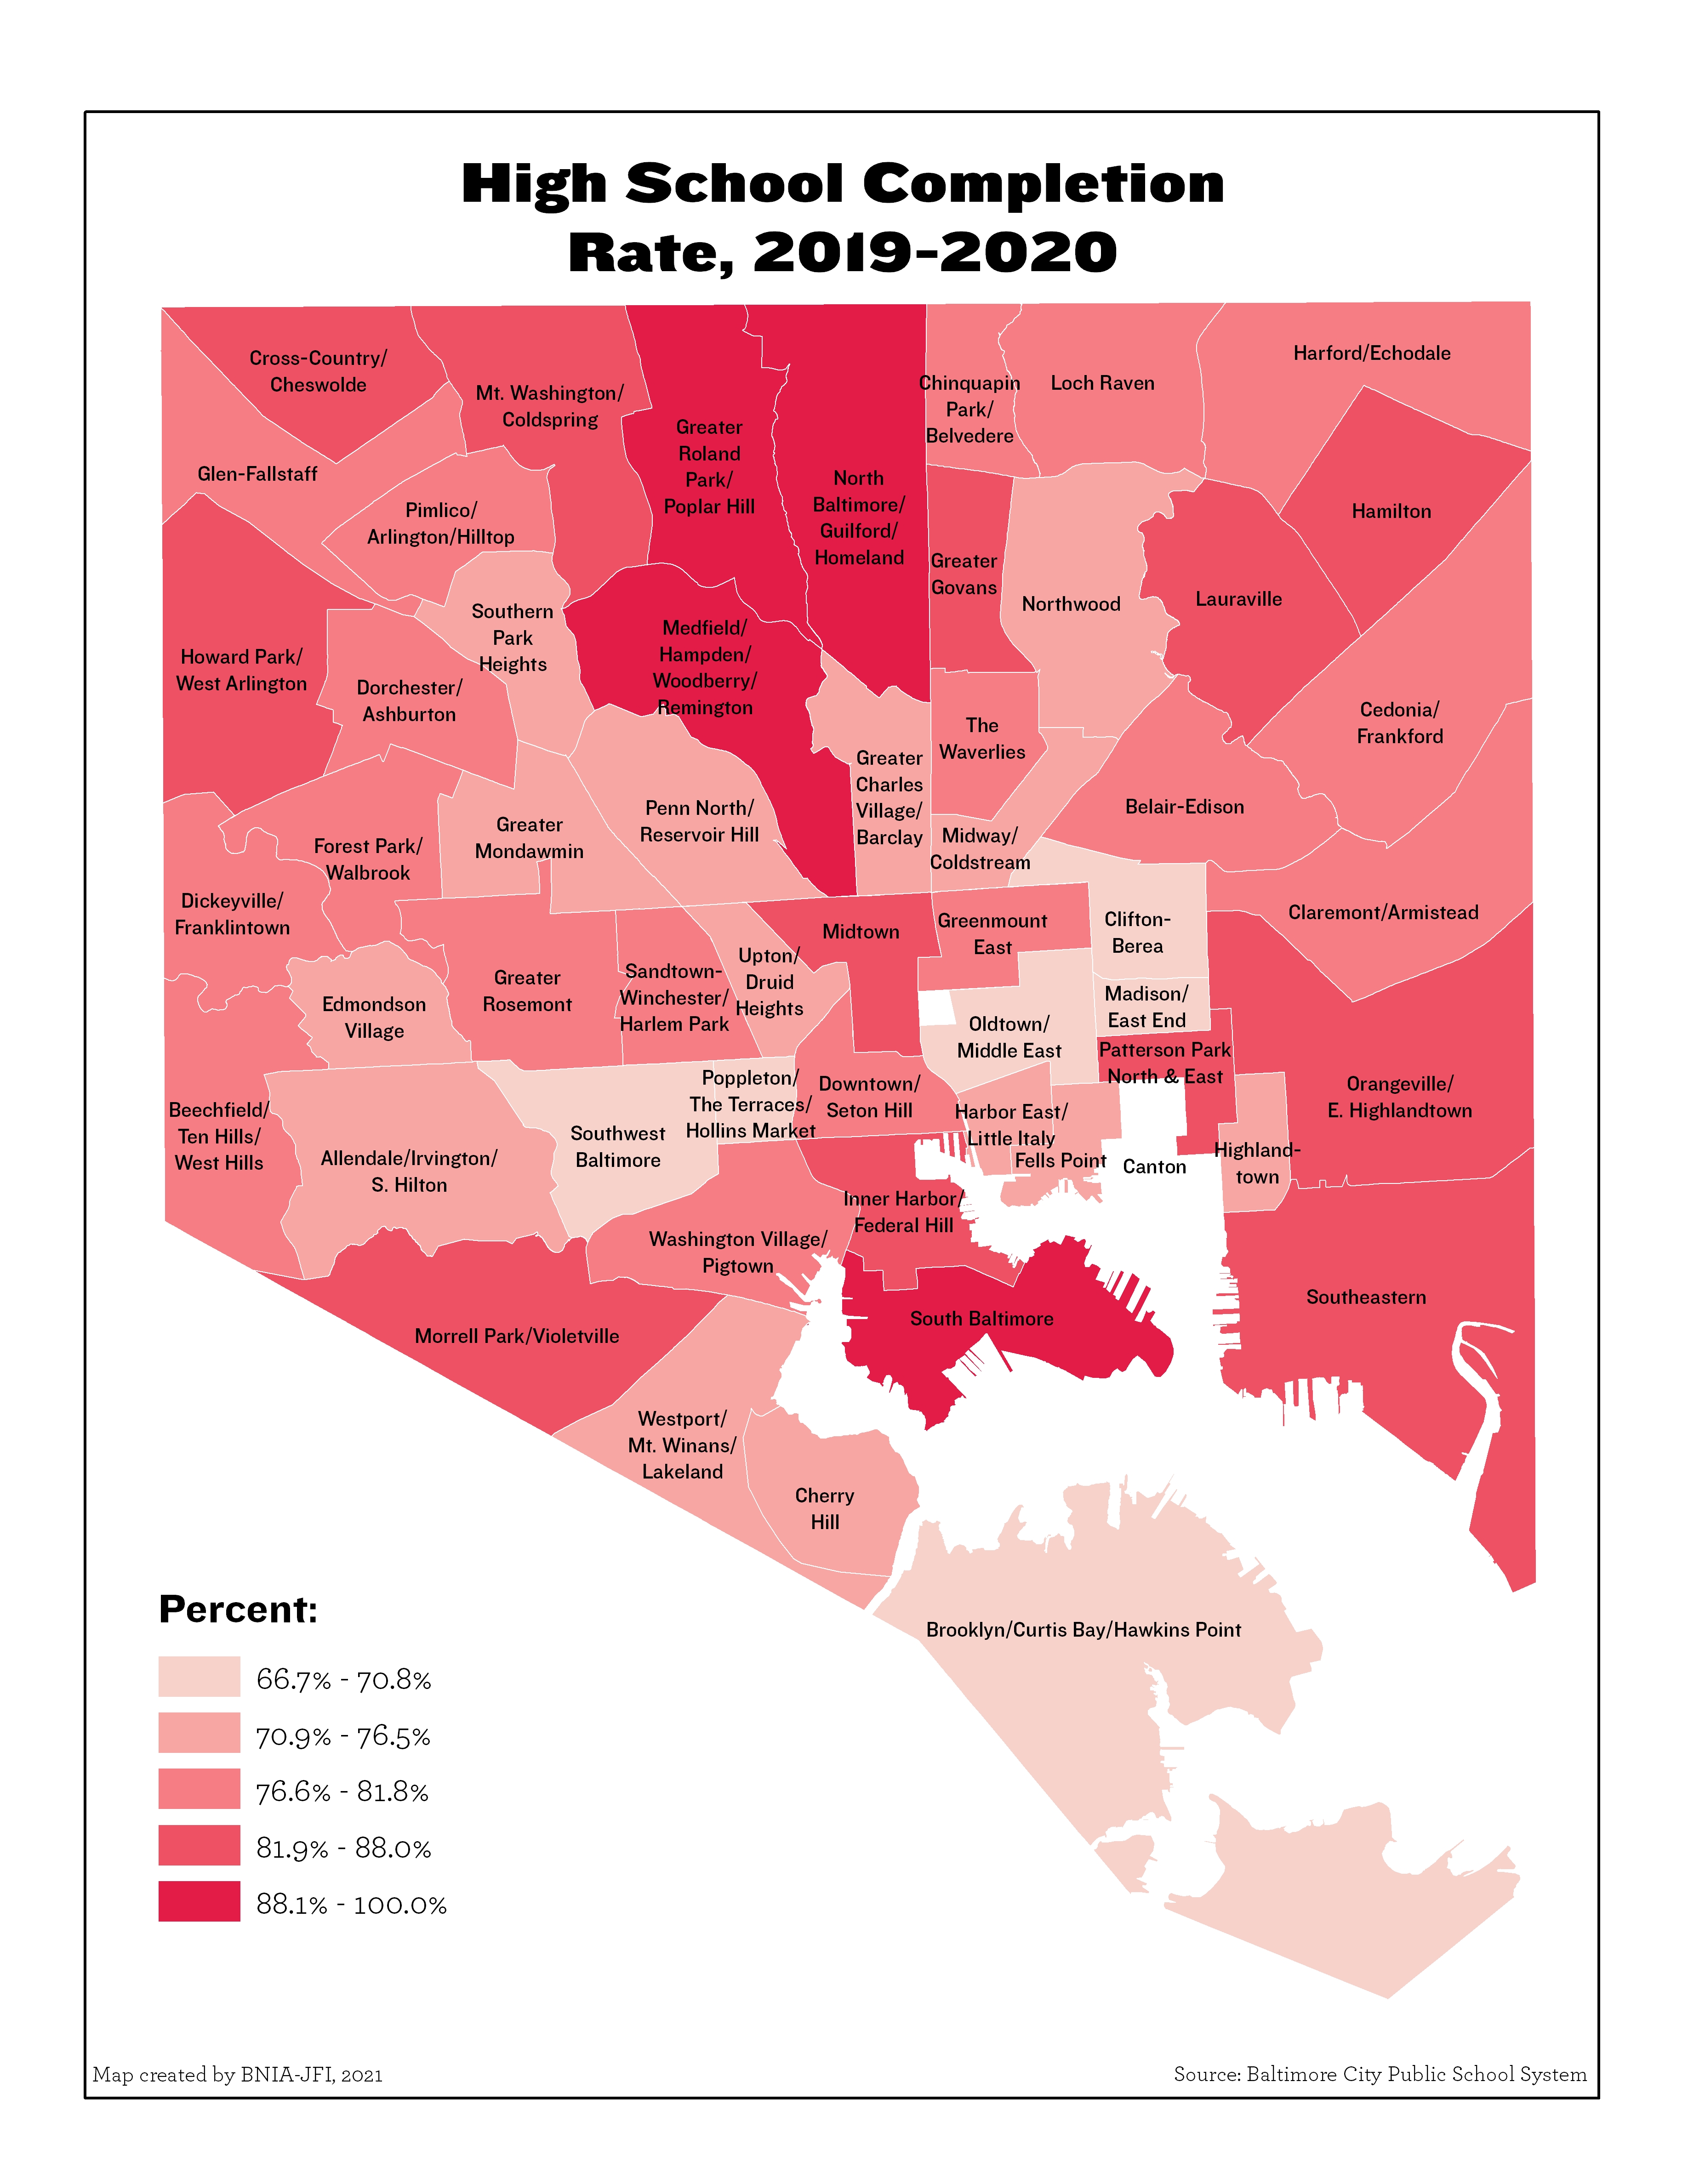
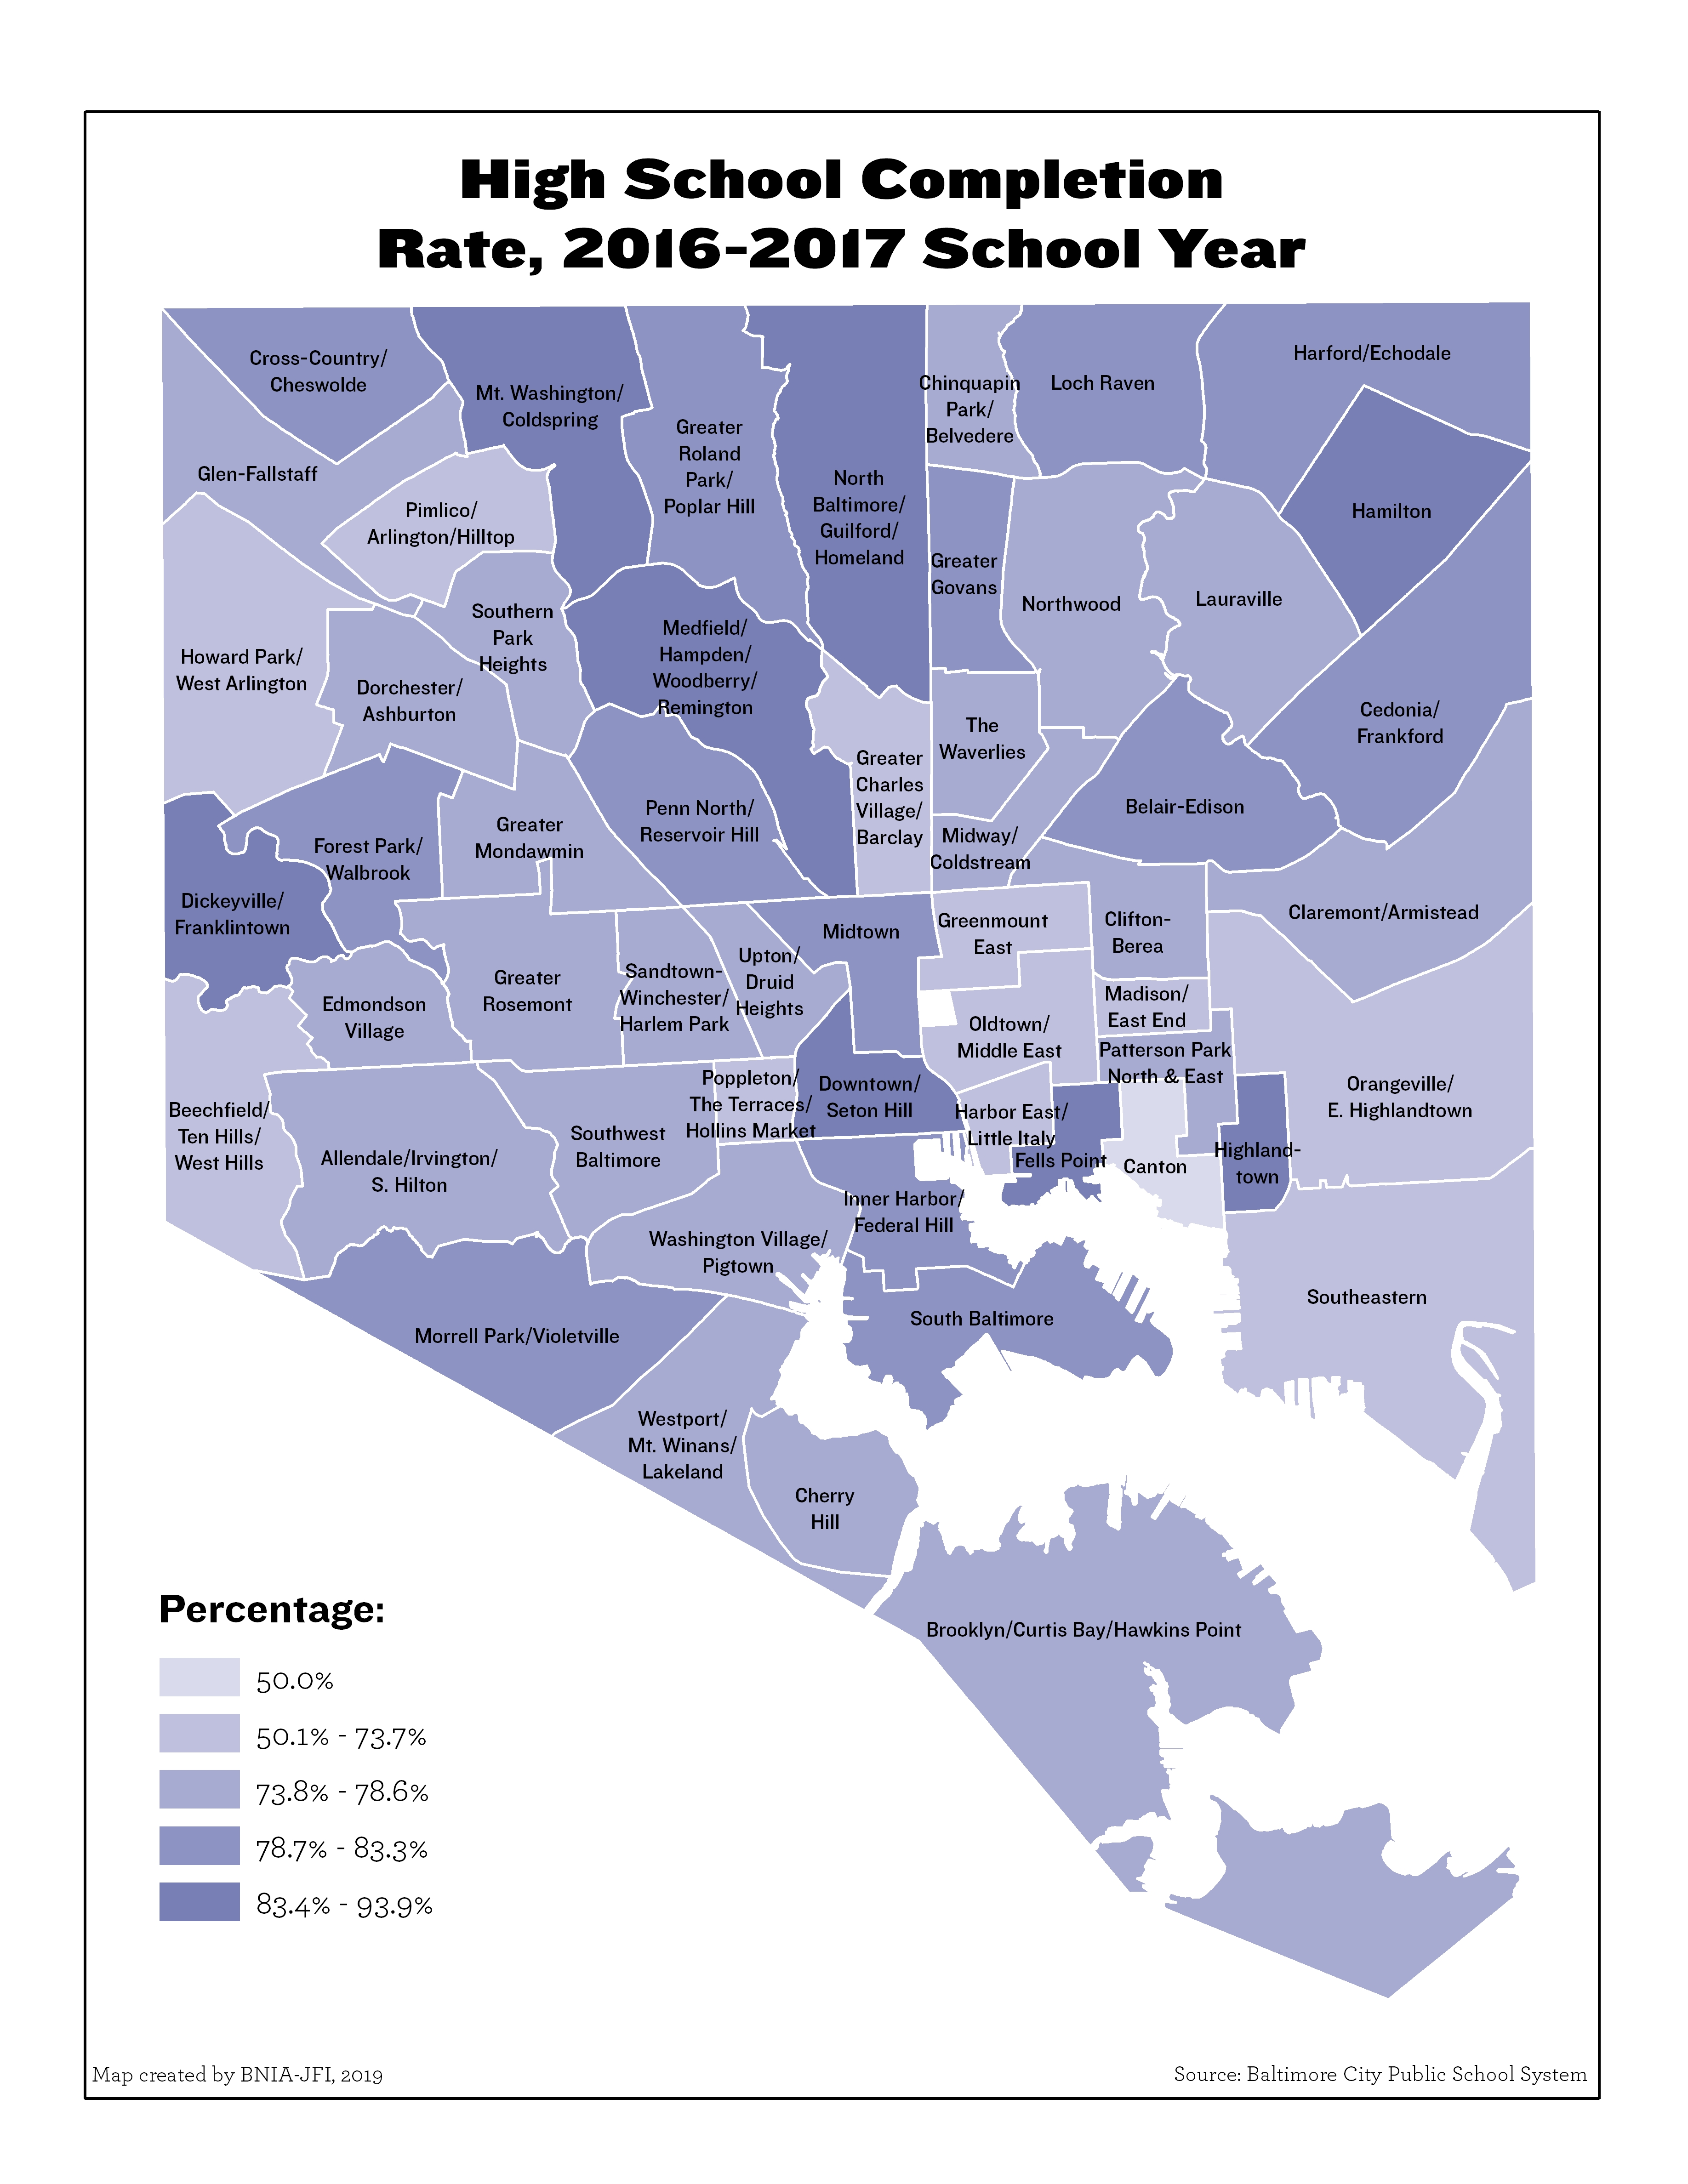
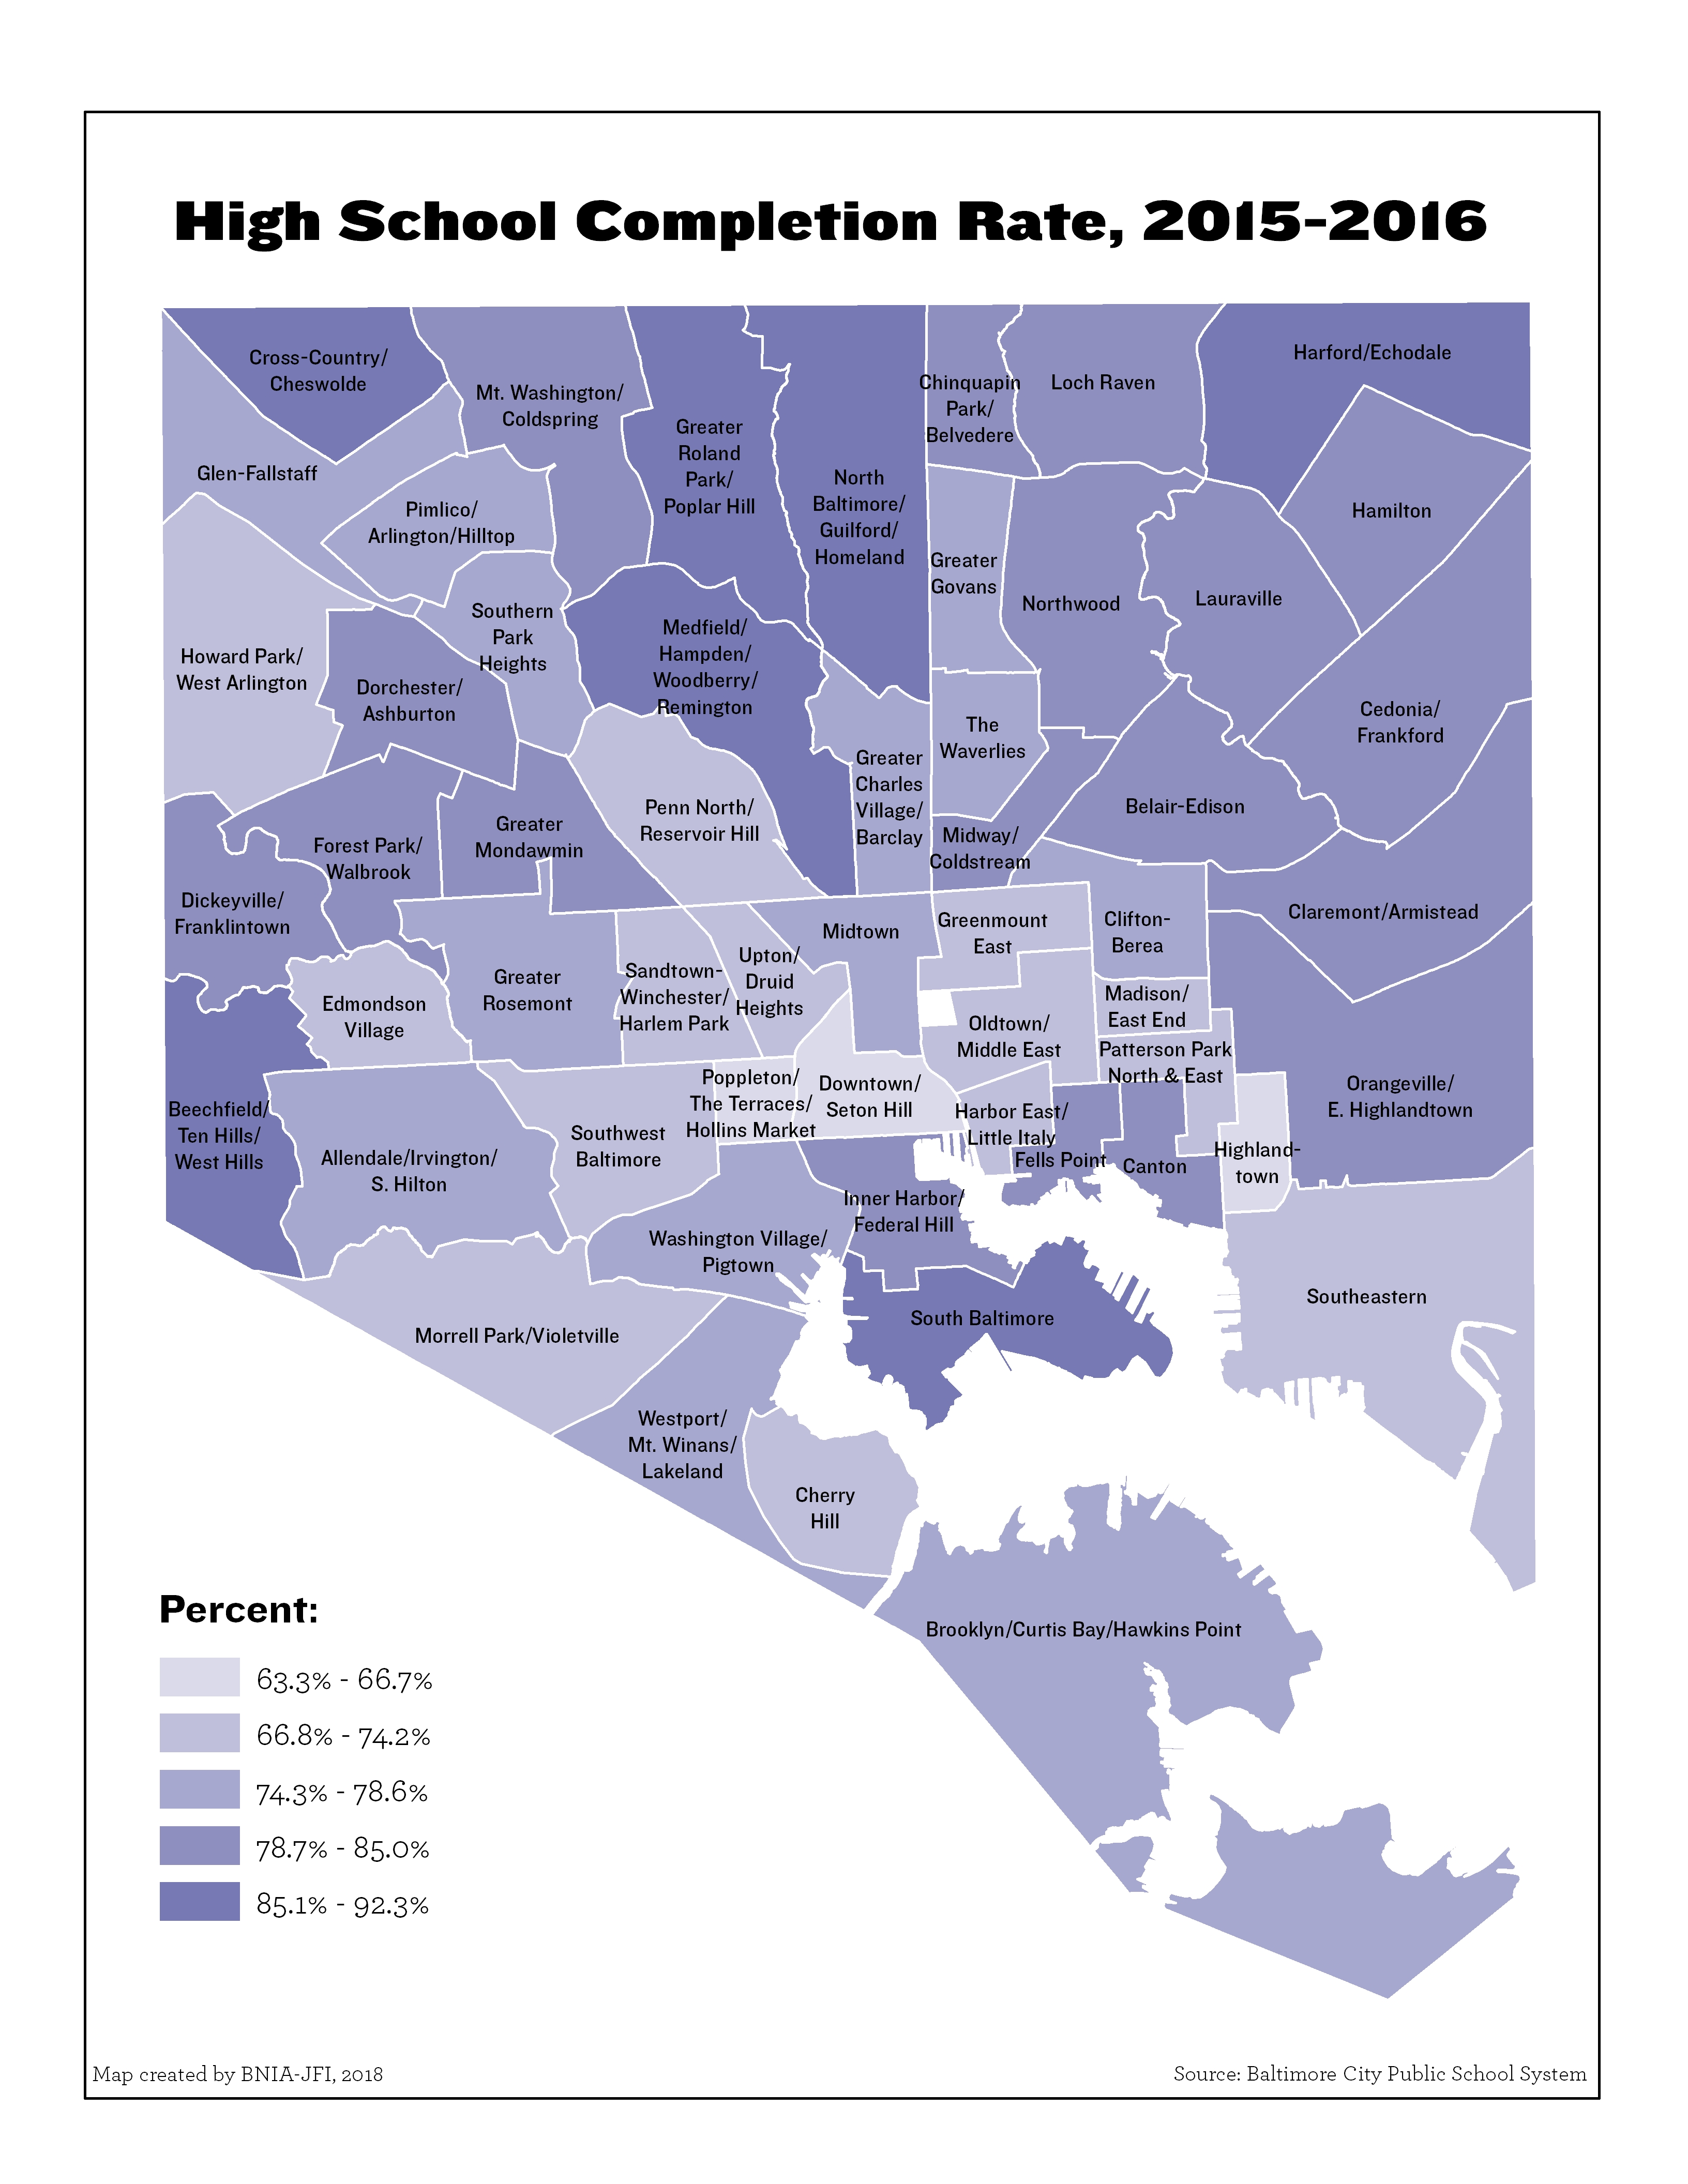
High School Completion Rate (2019-2020)
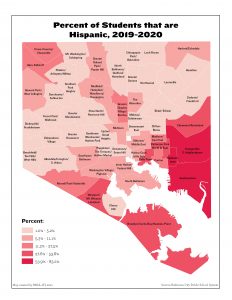
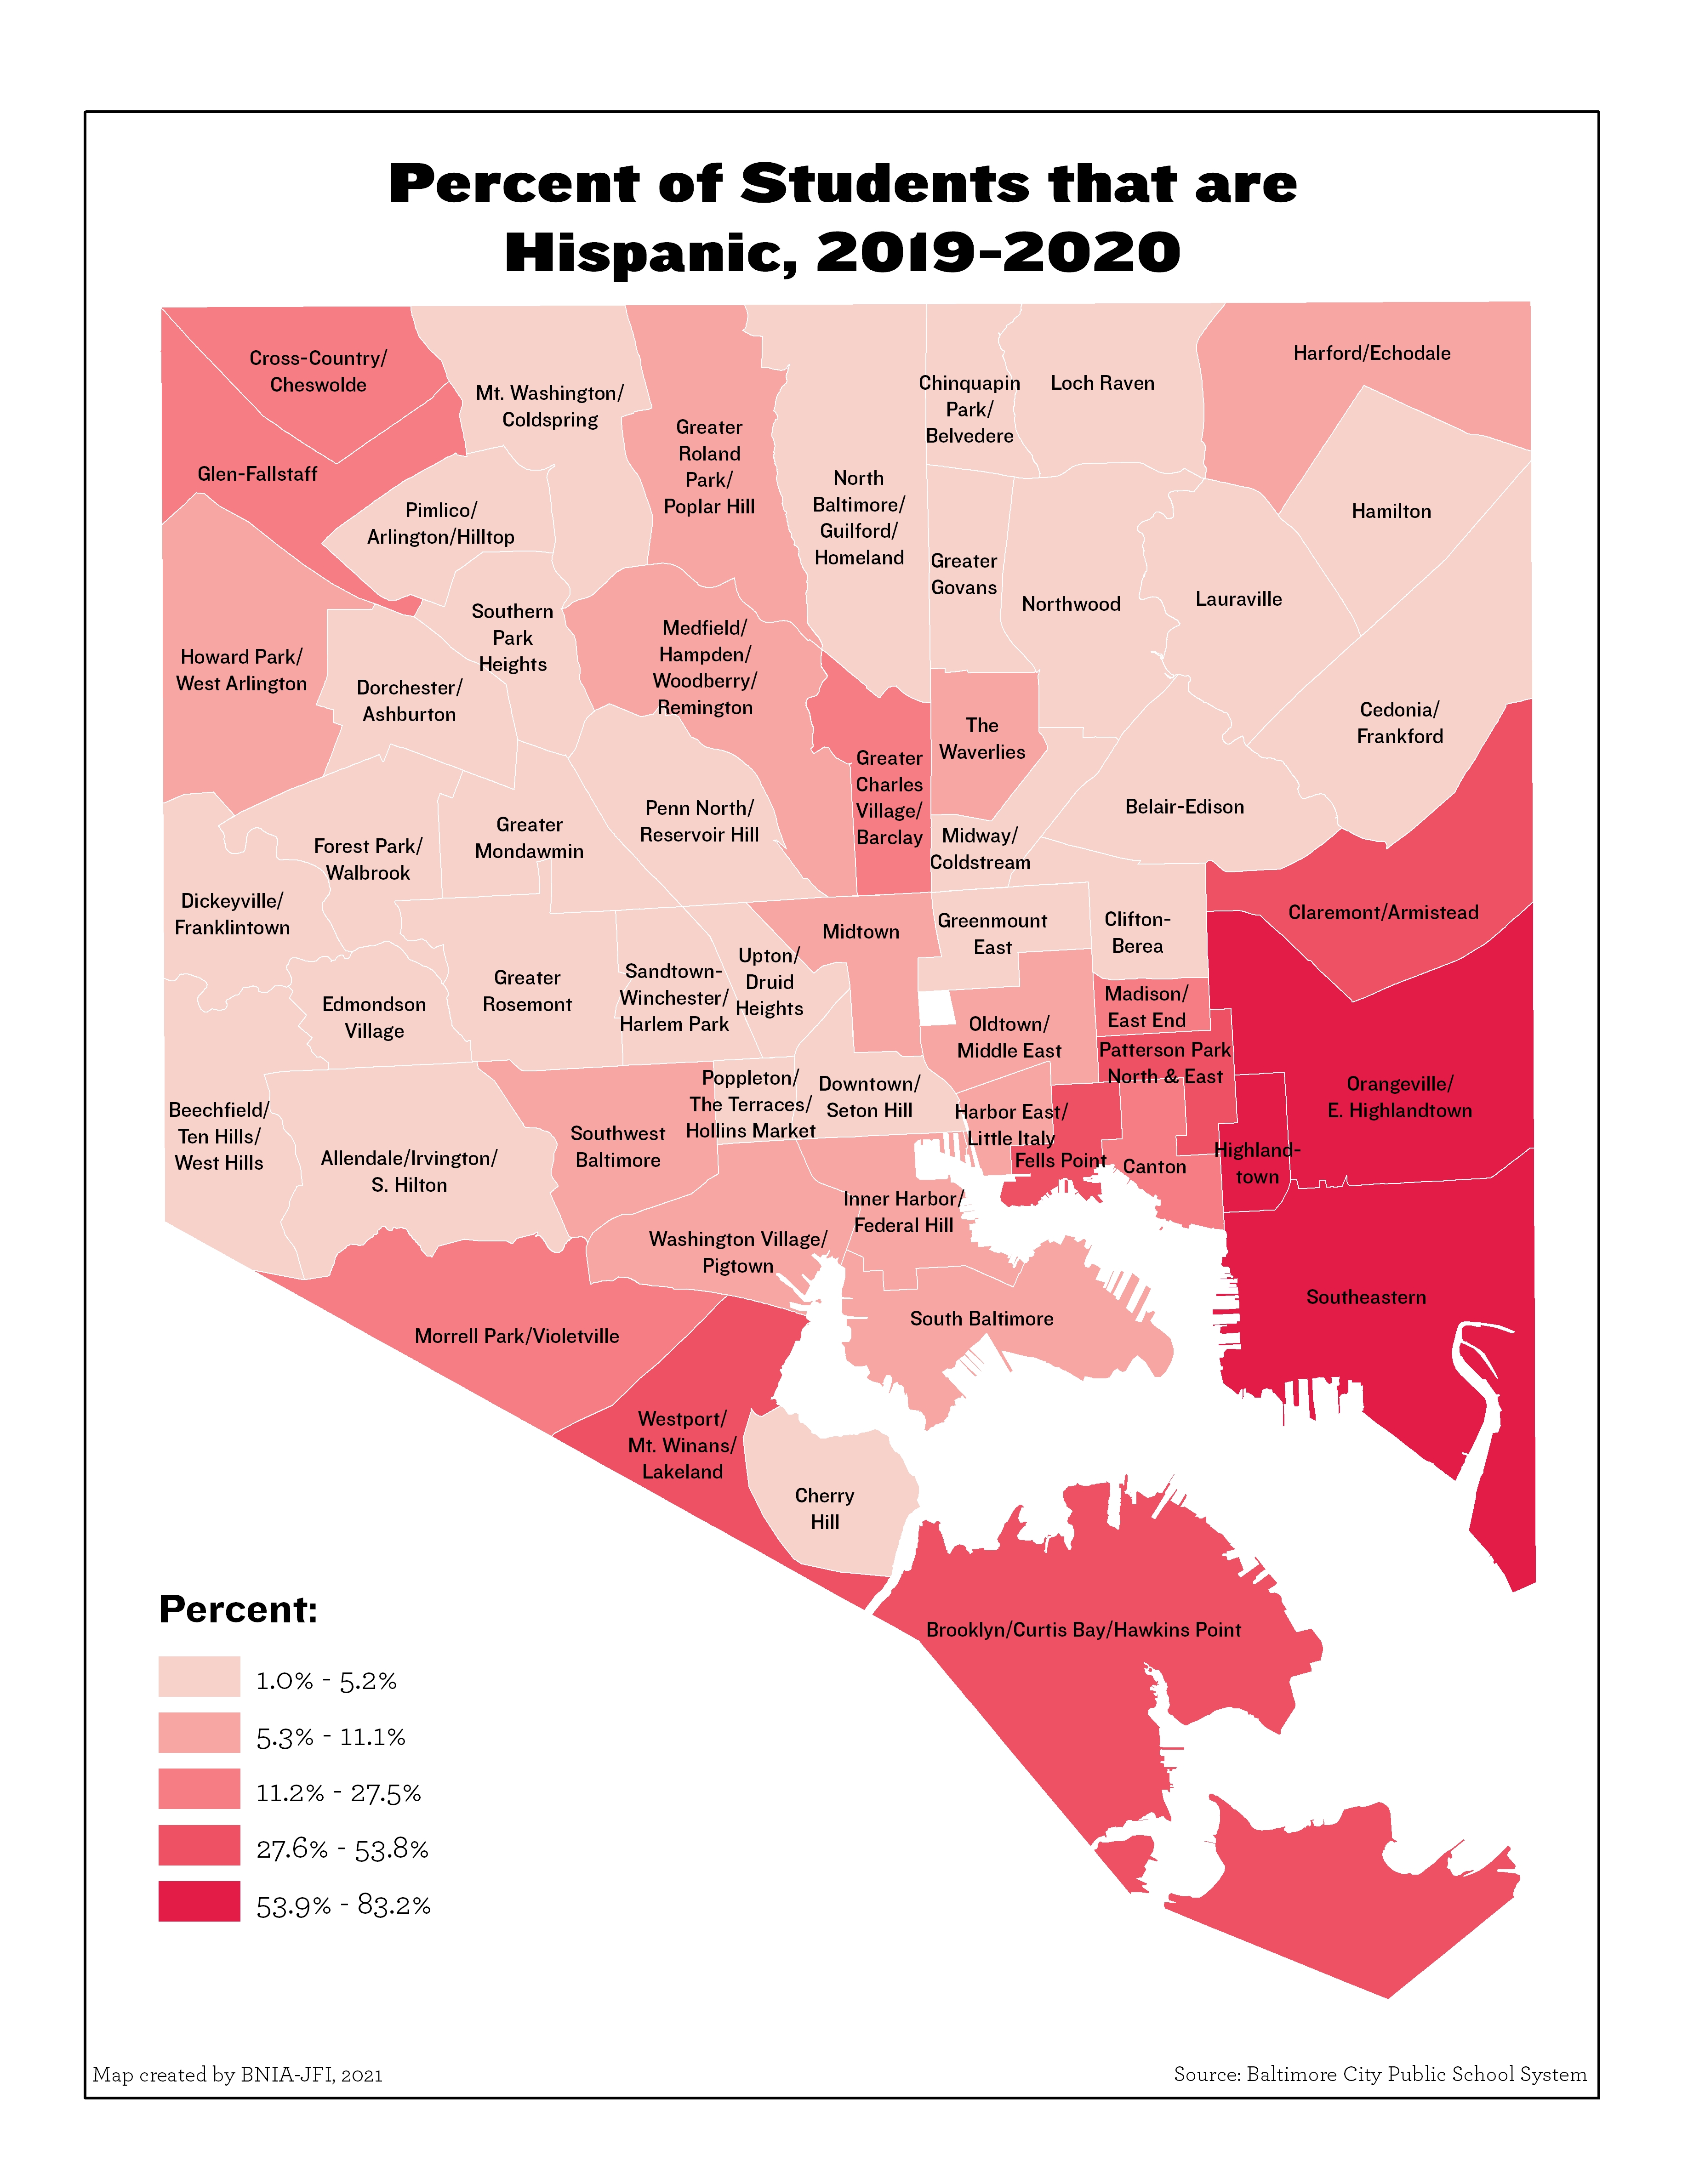
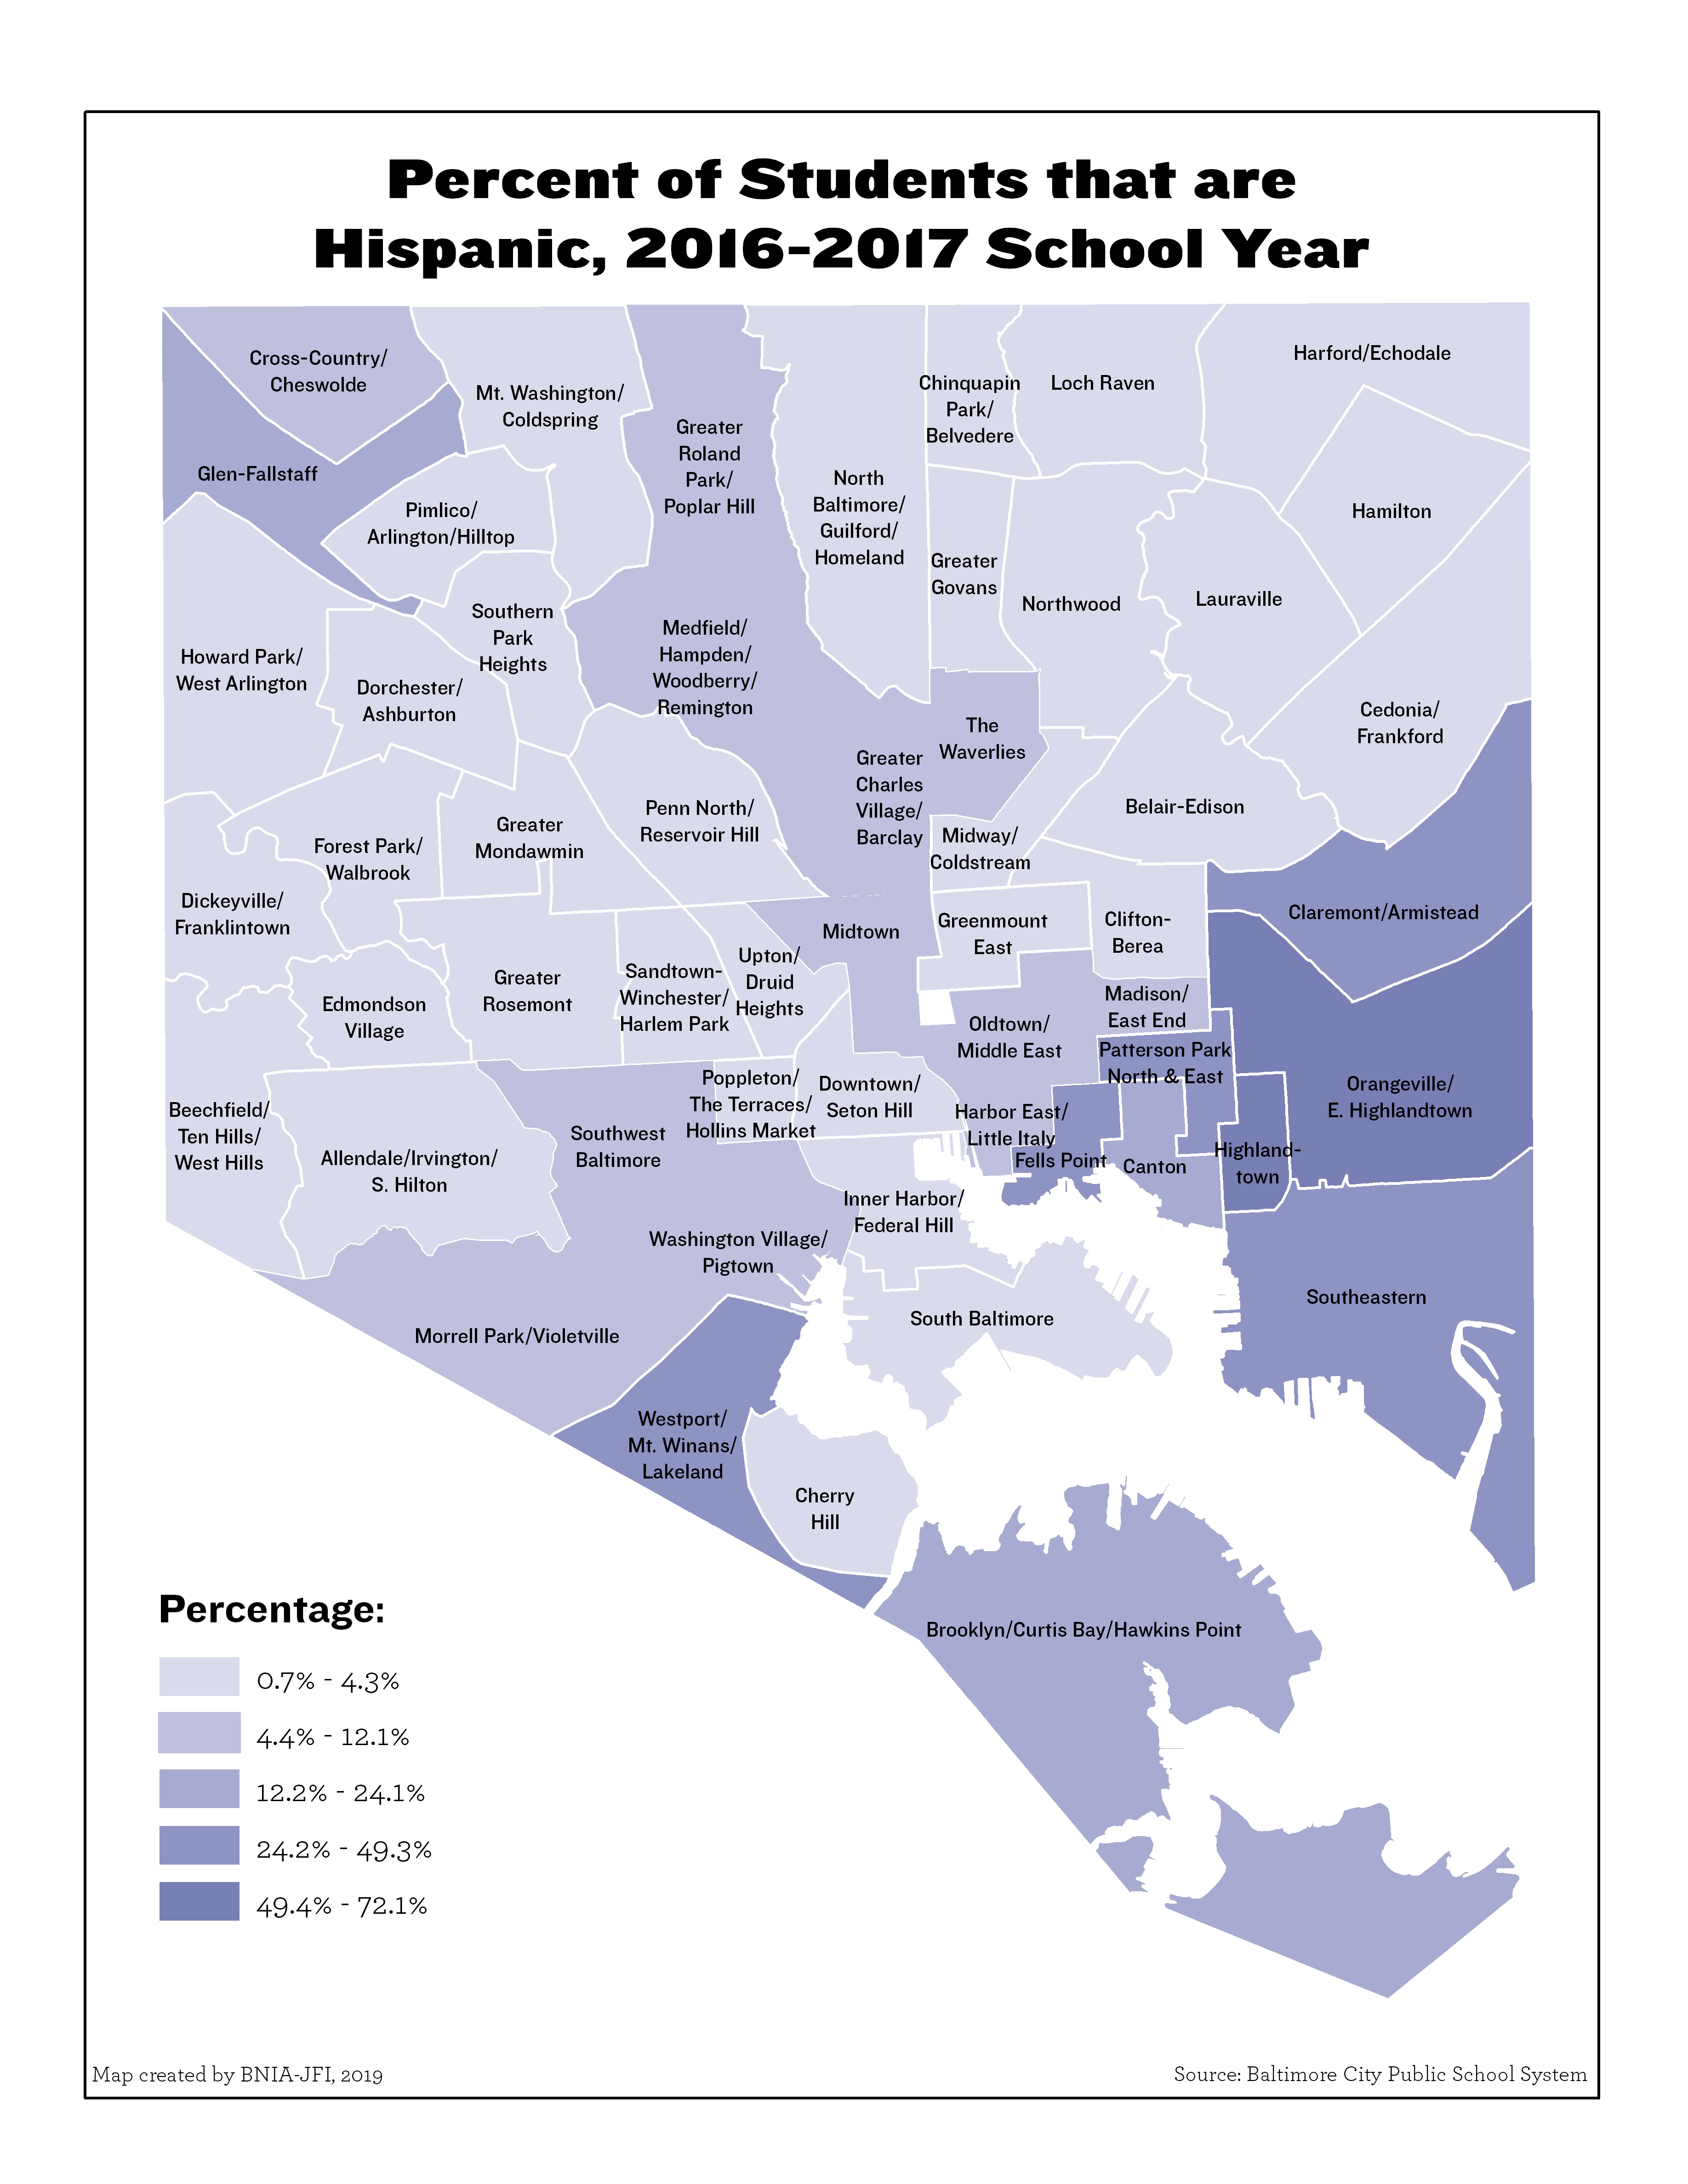
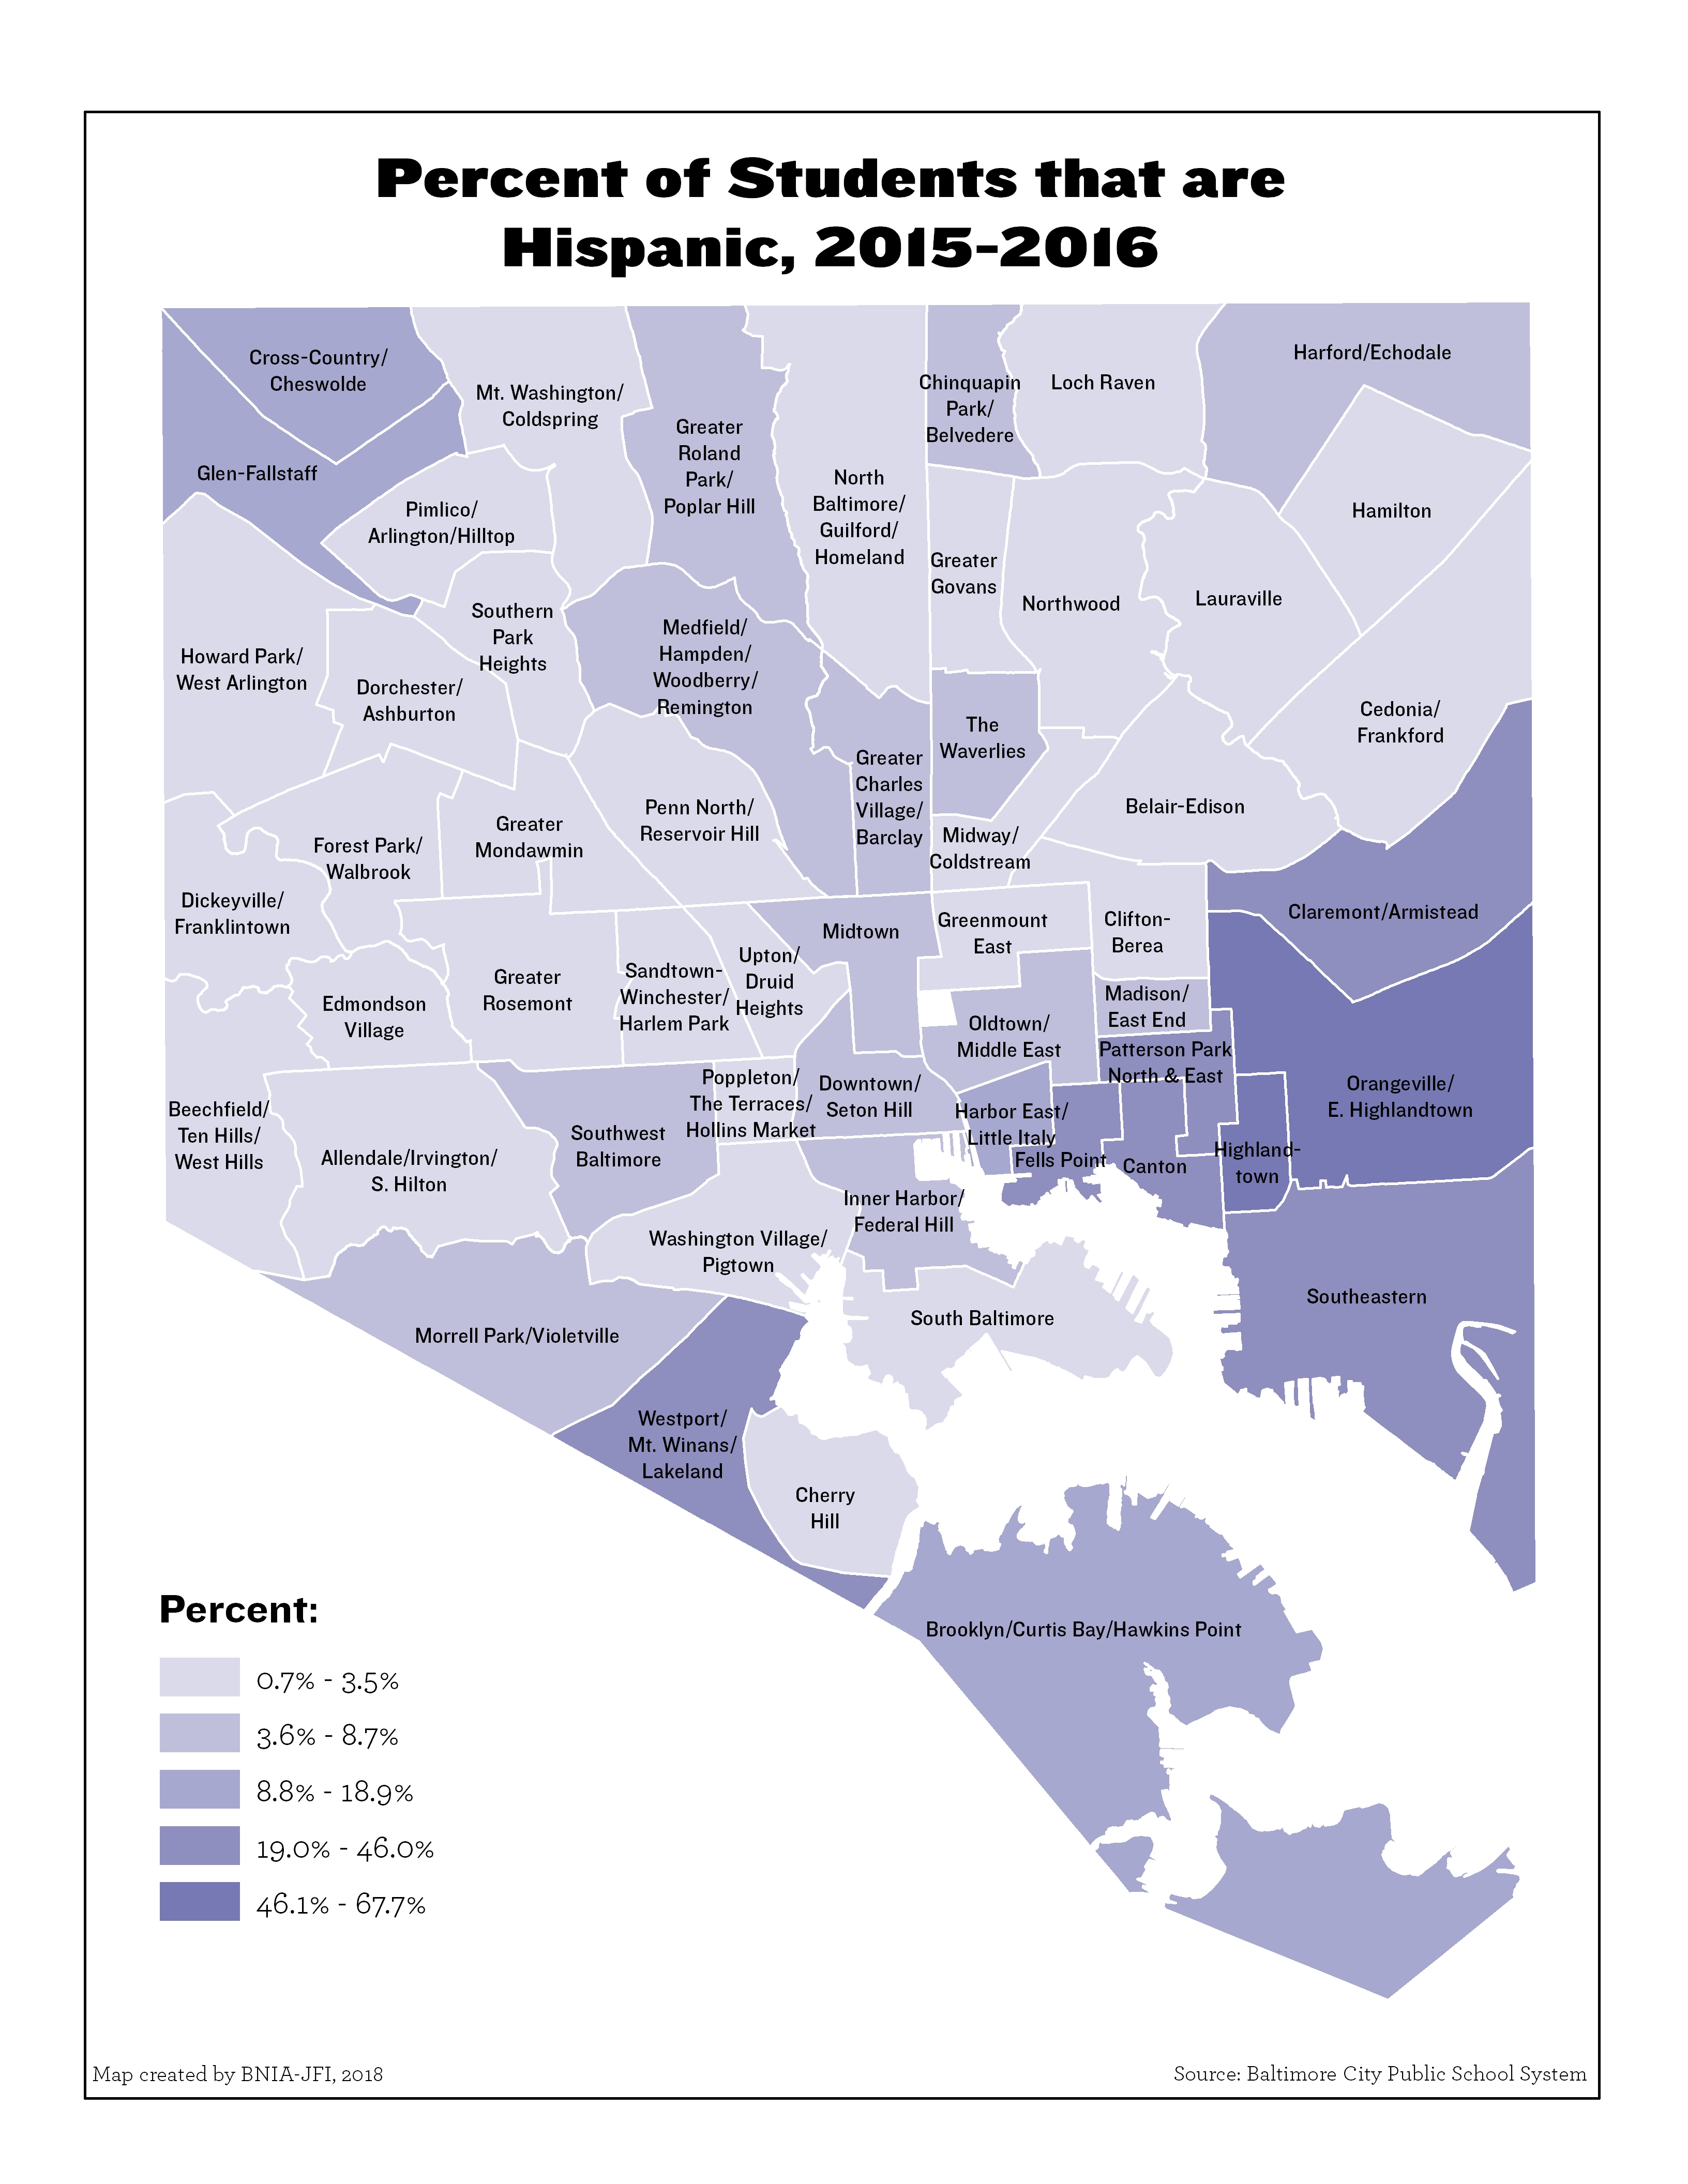
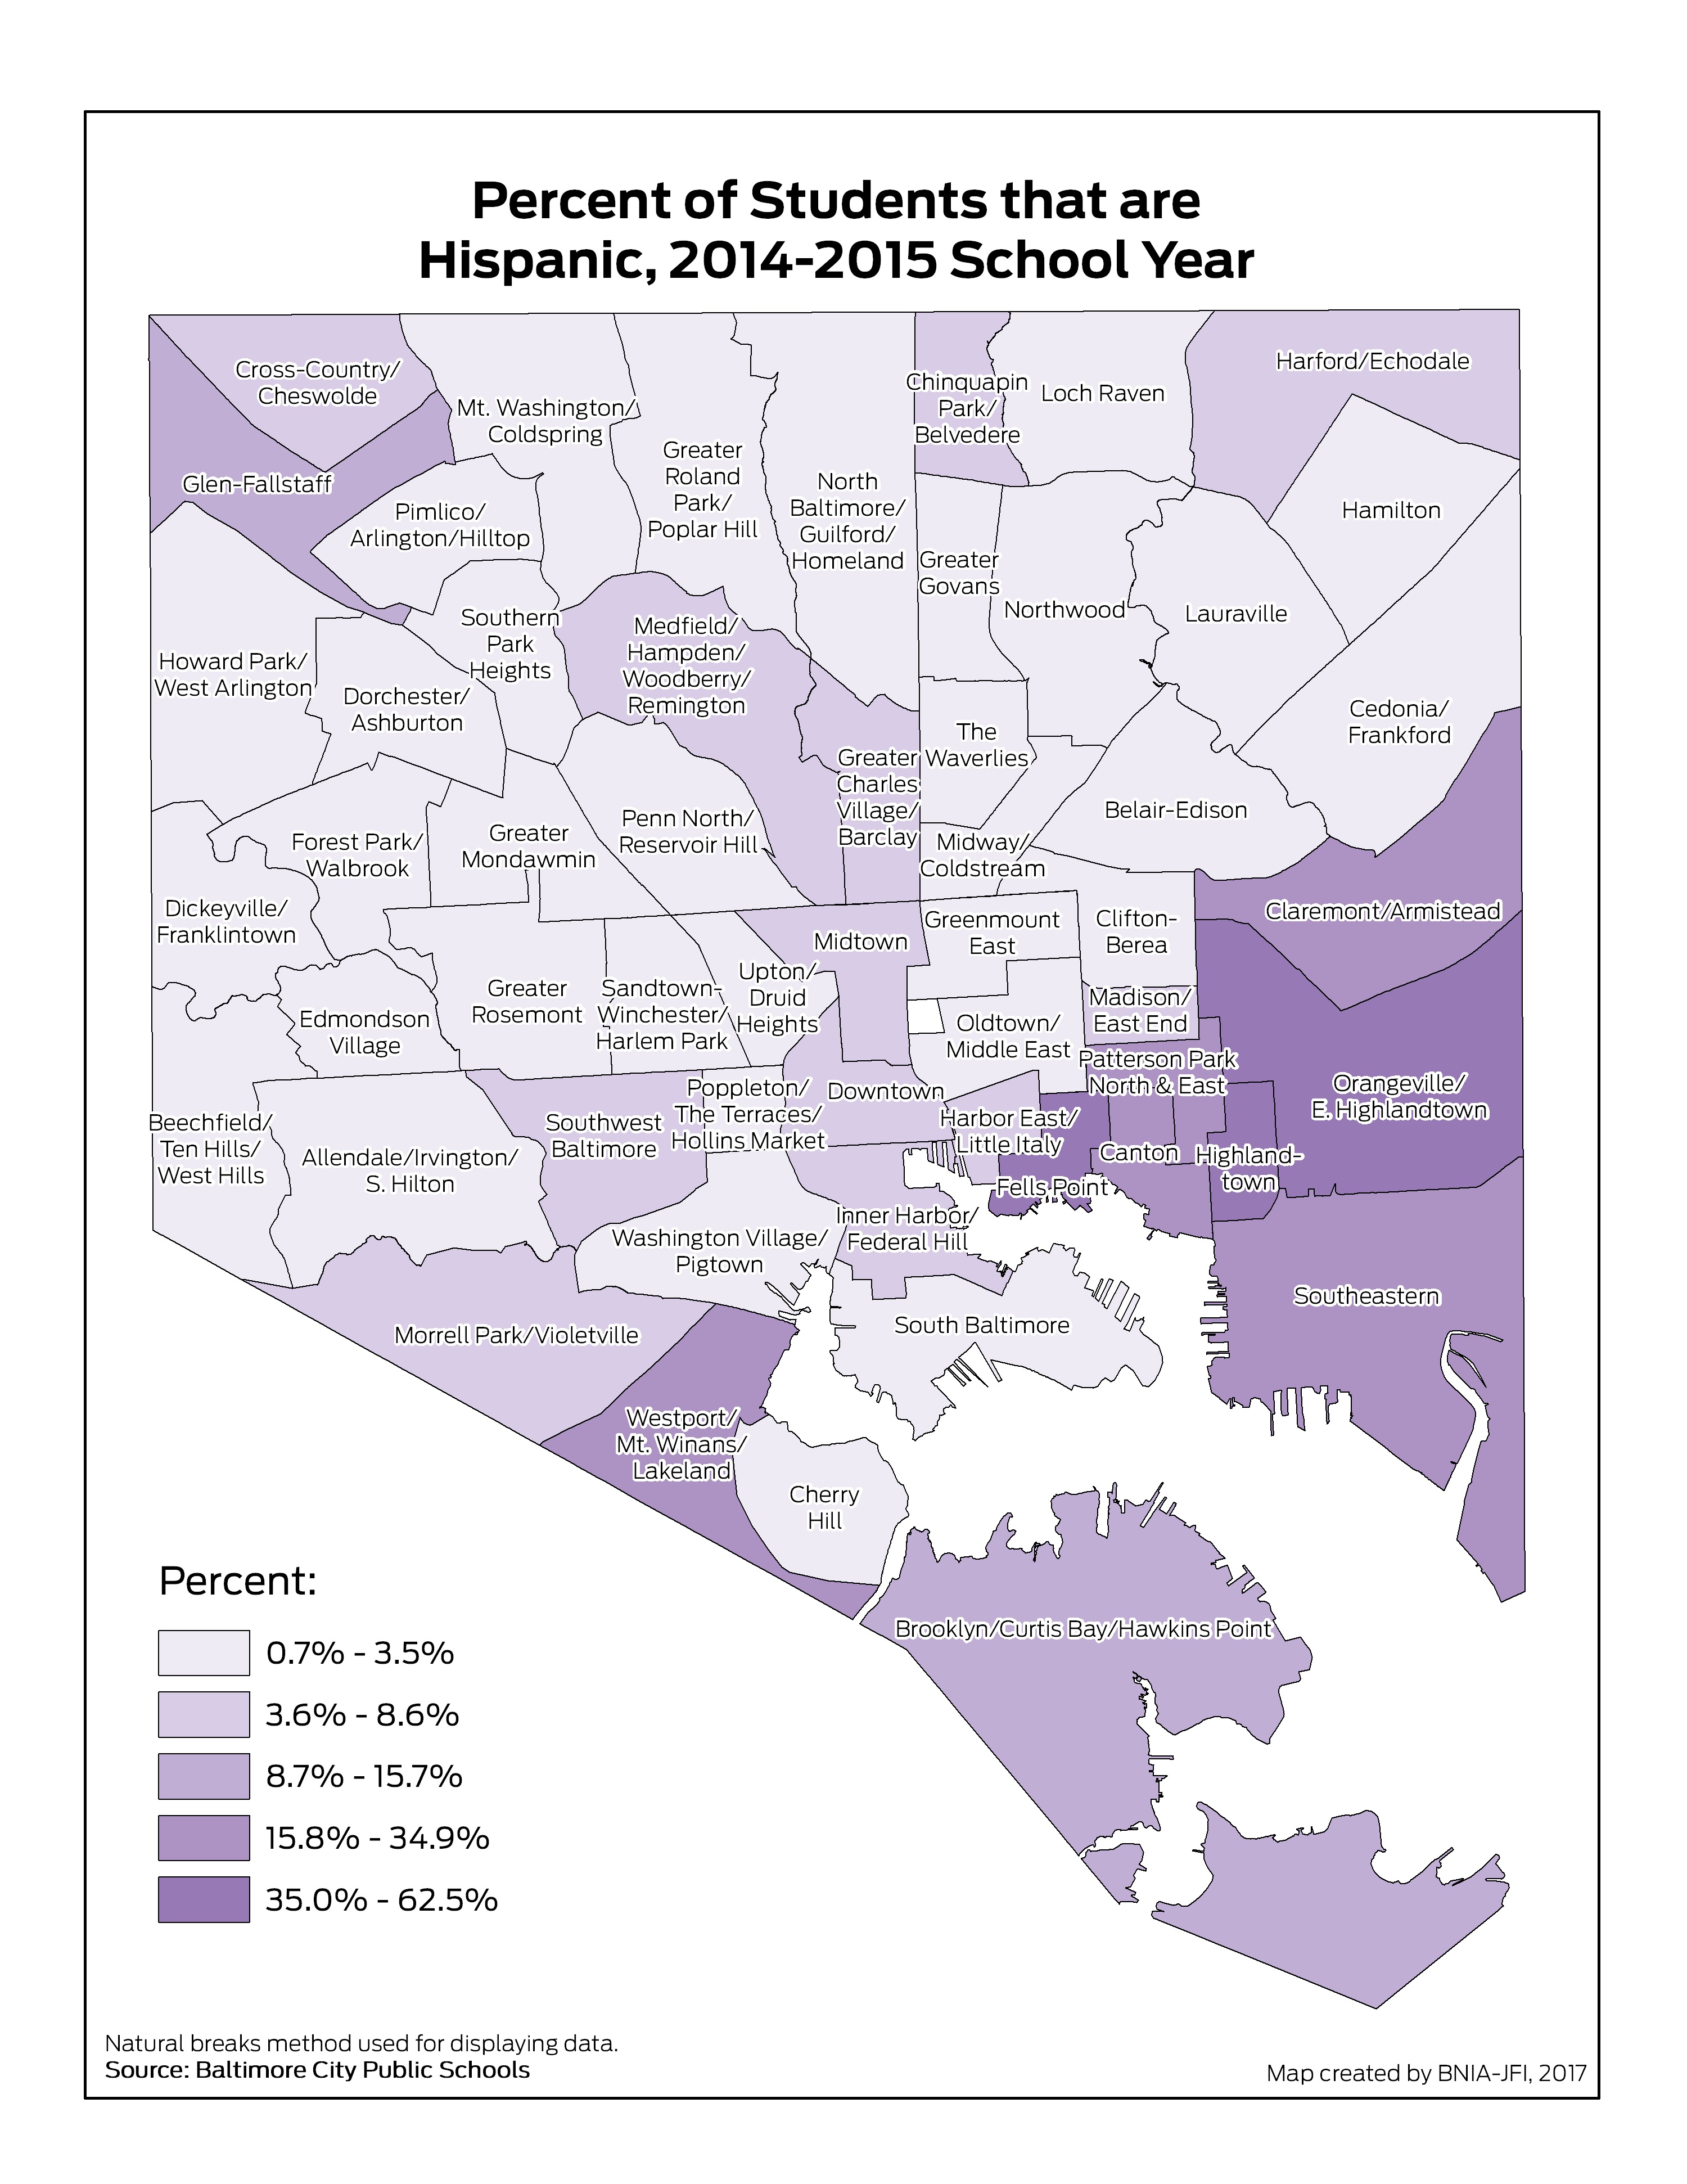
Percent of Students that are Hispanic (2019-2020)
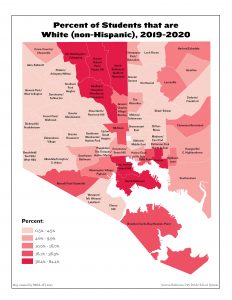
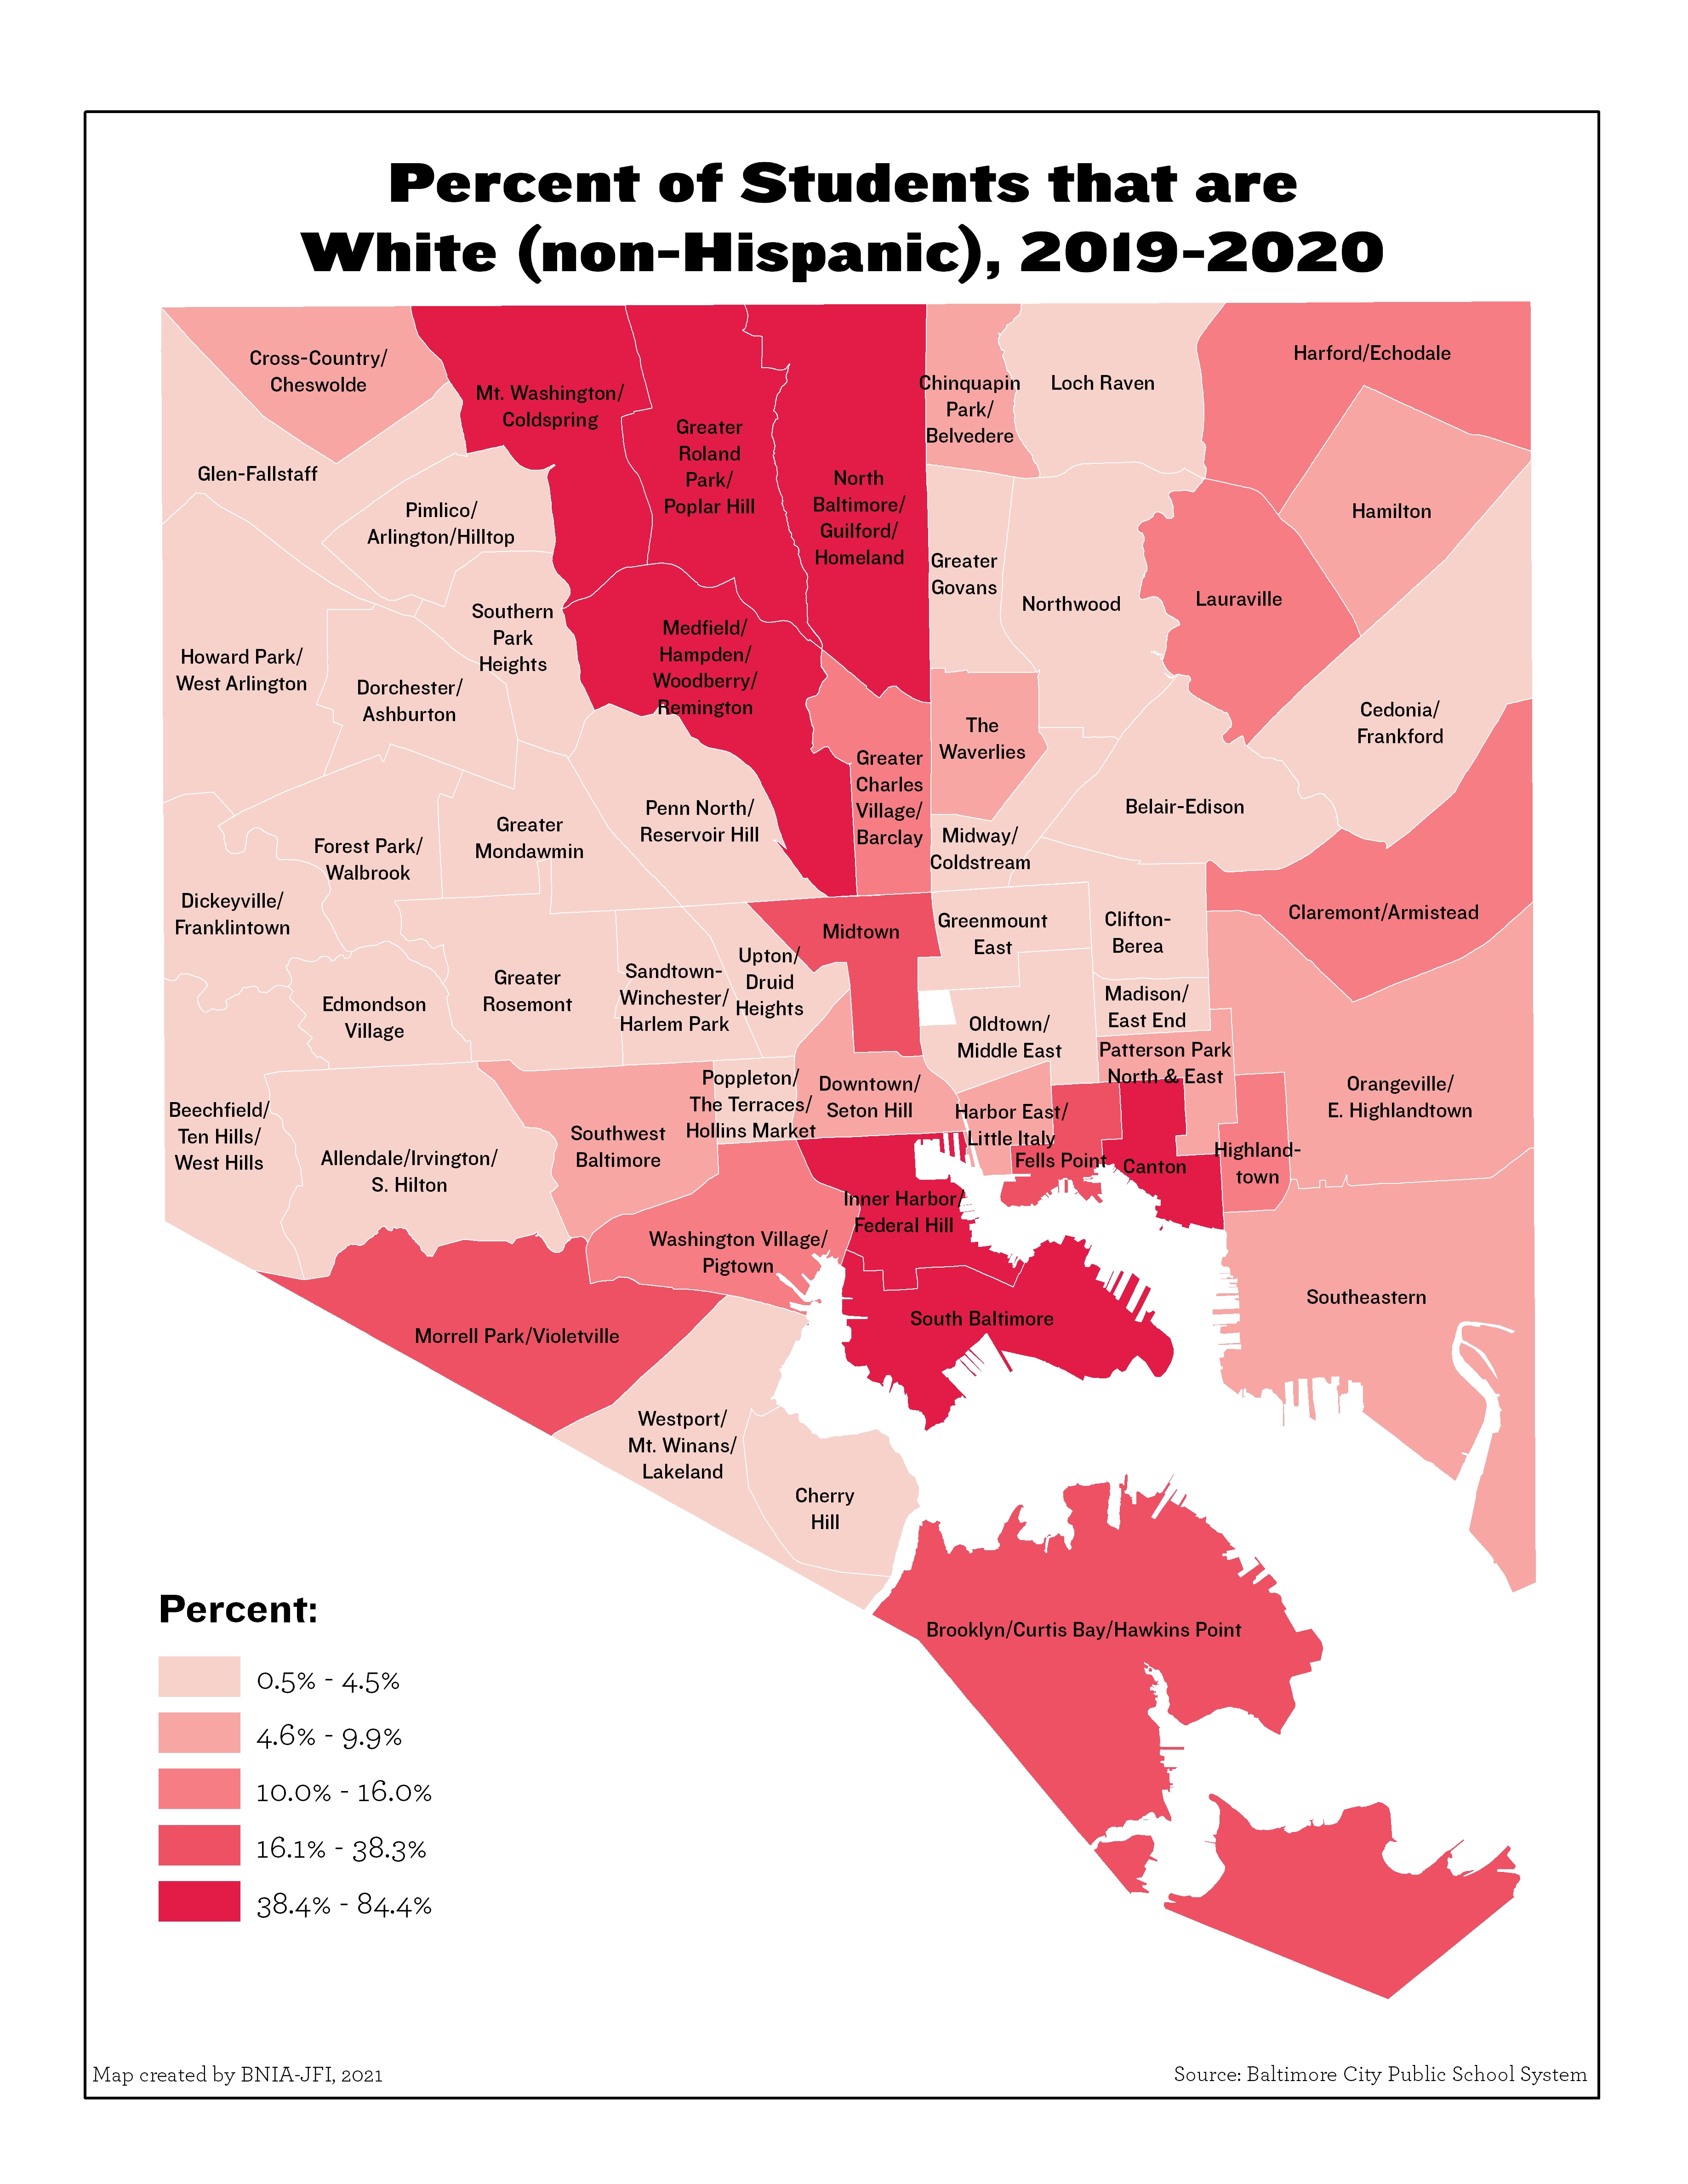
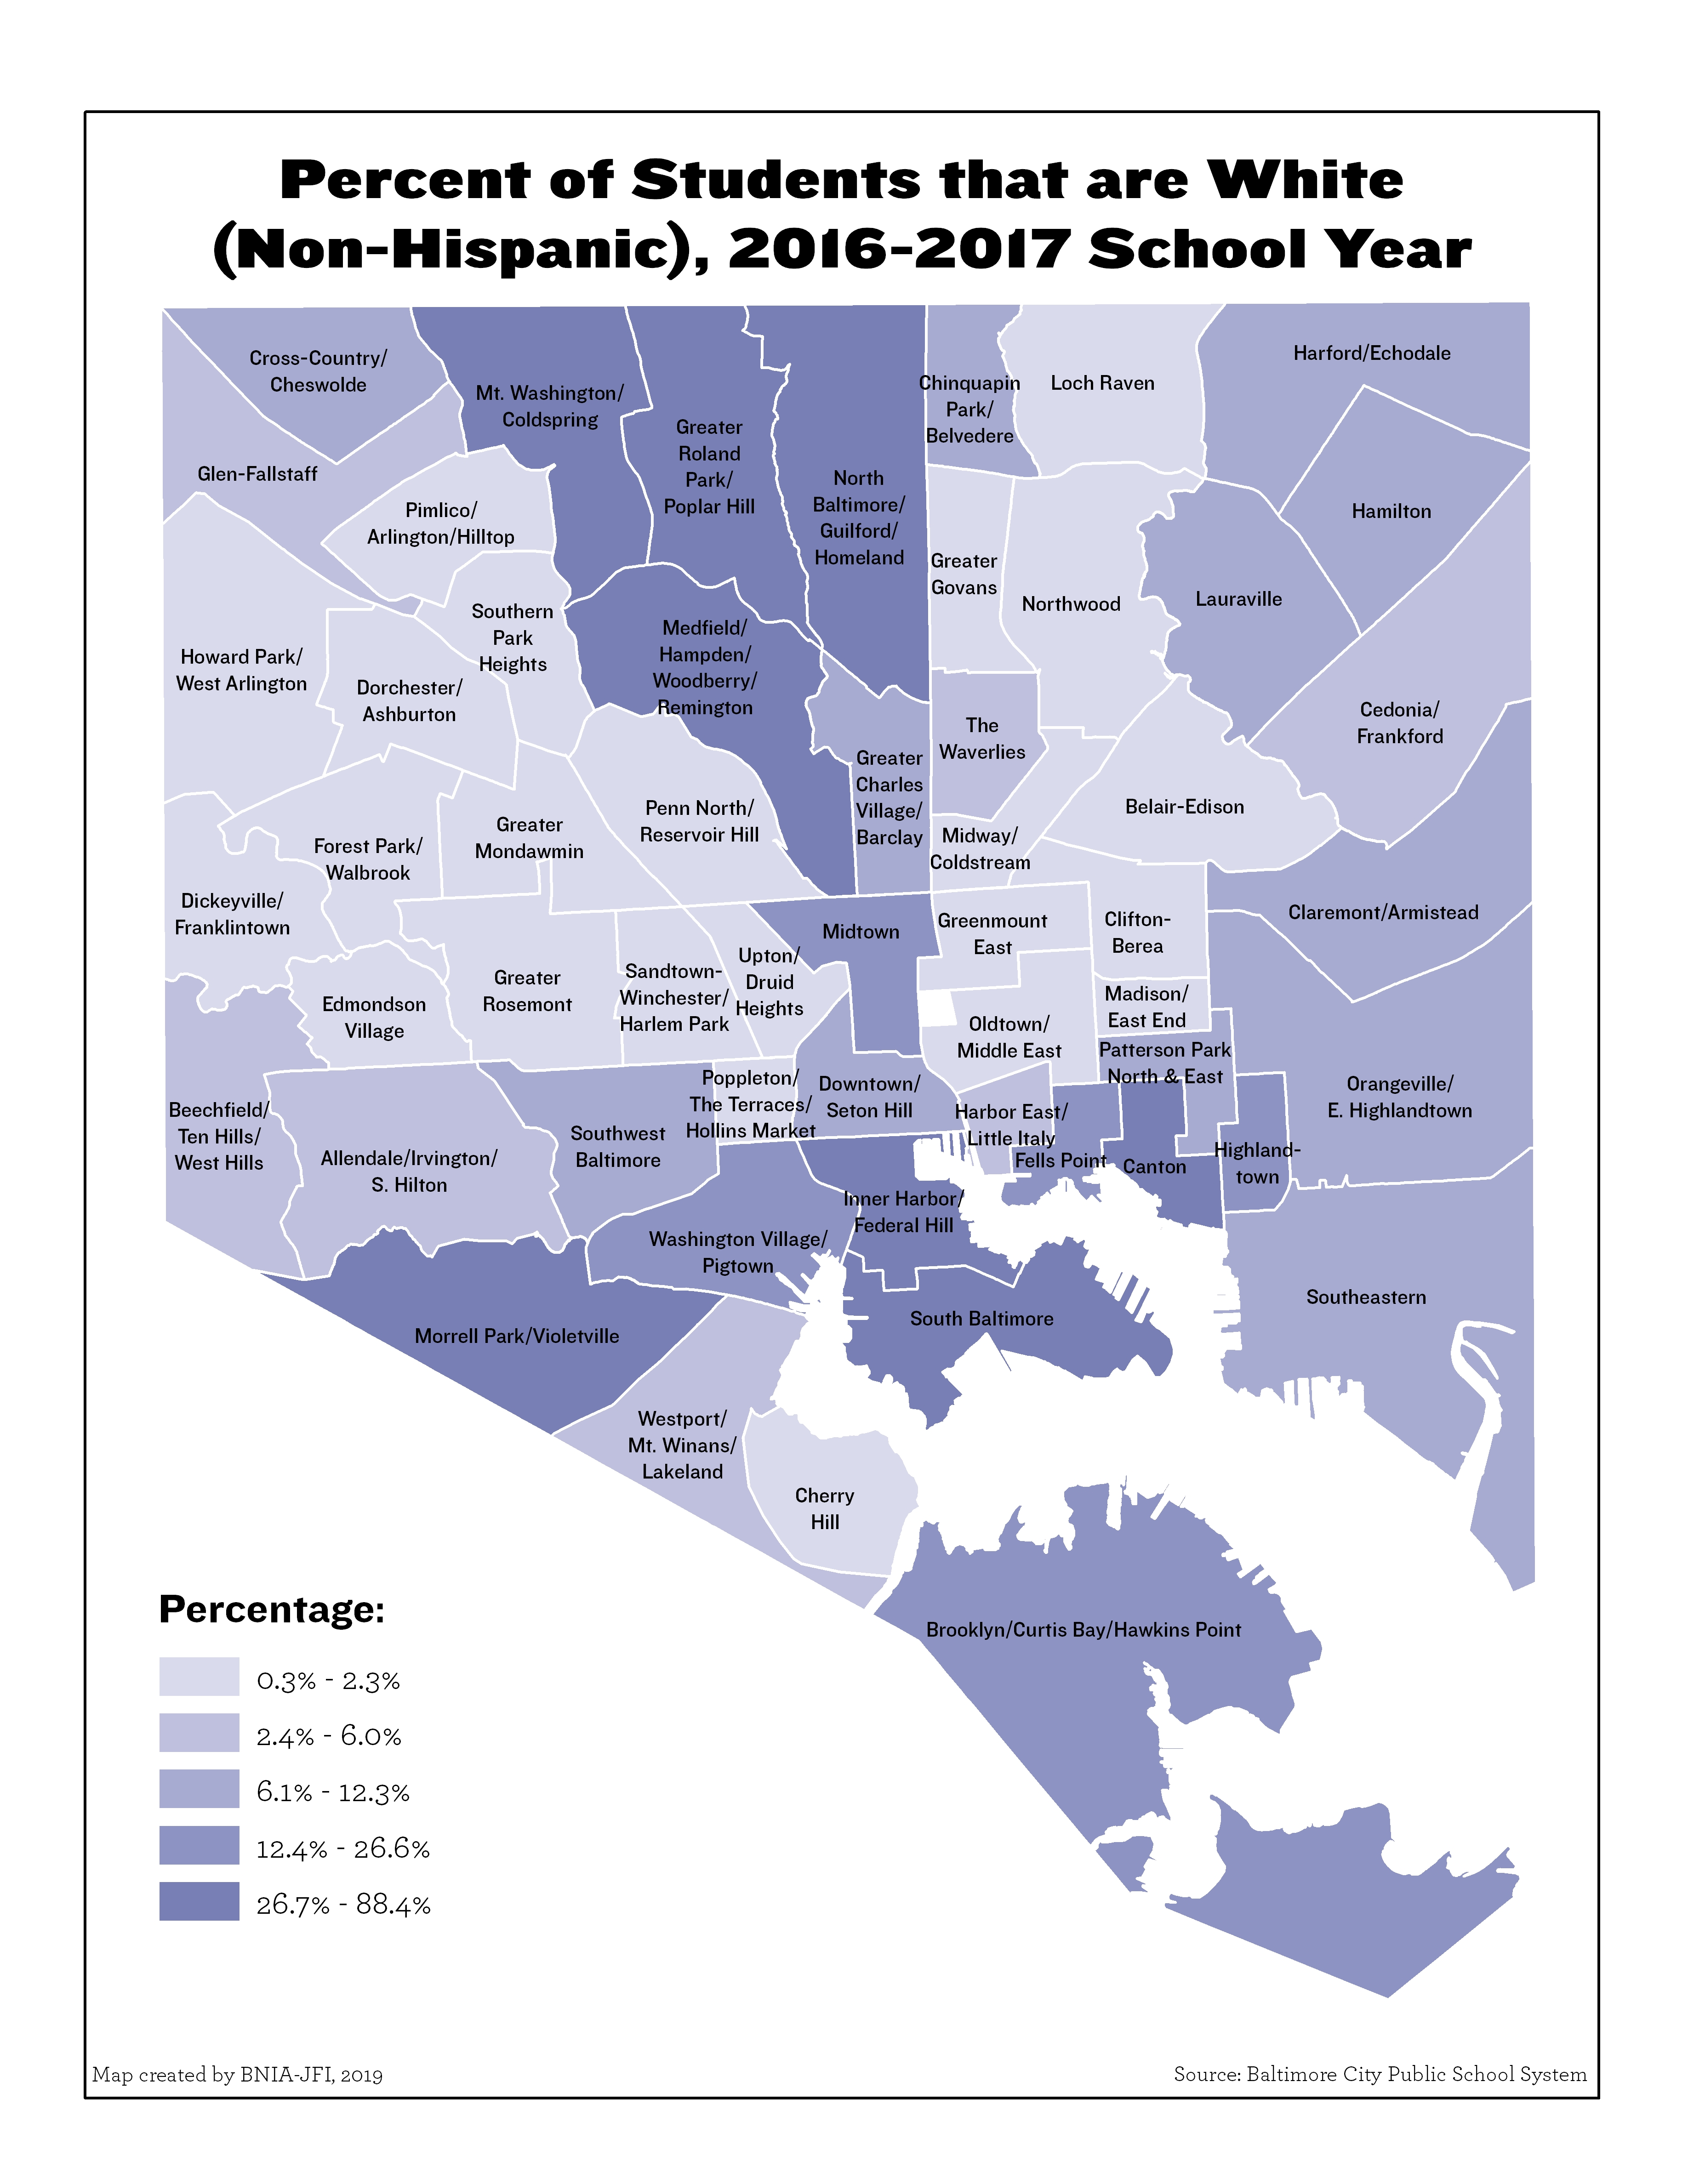
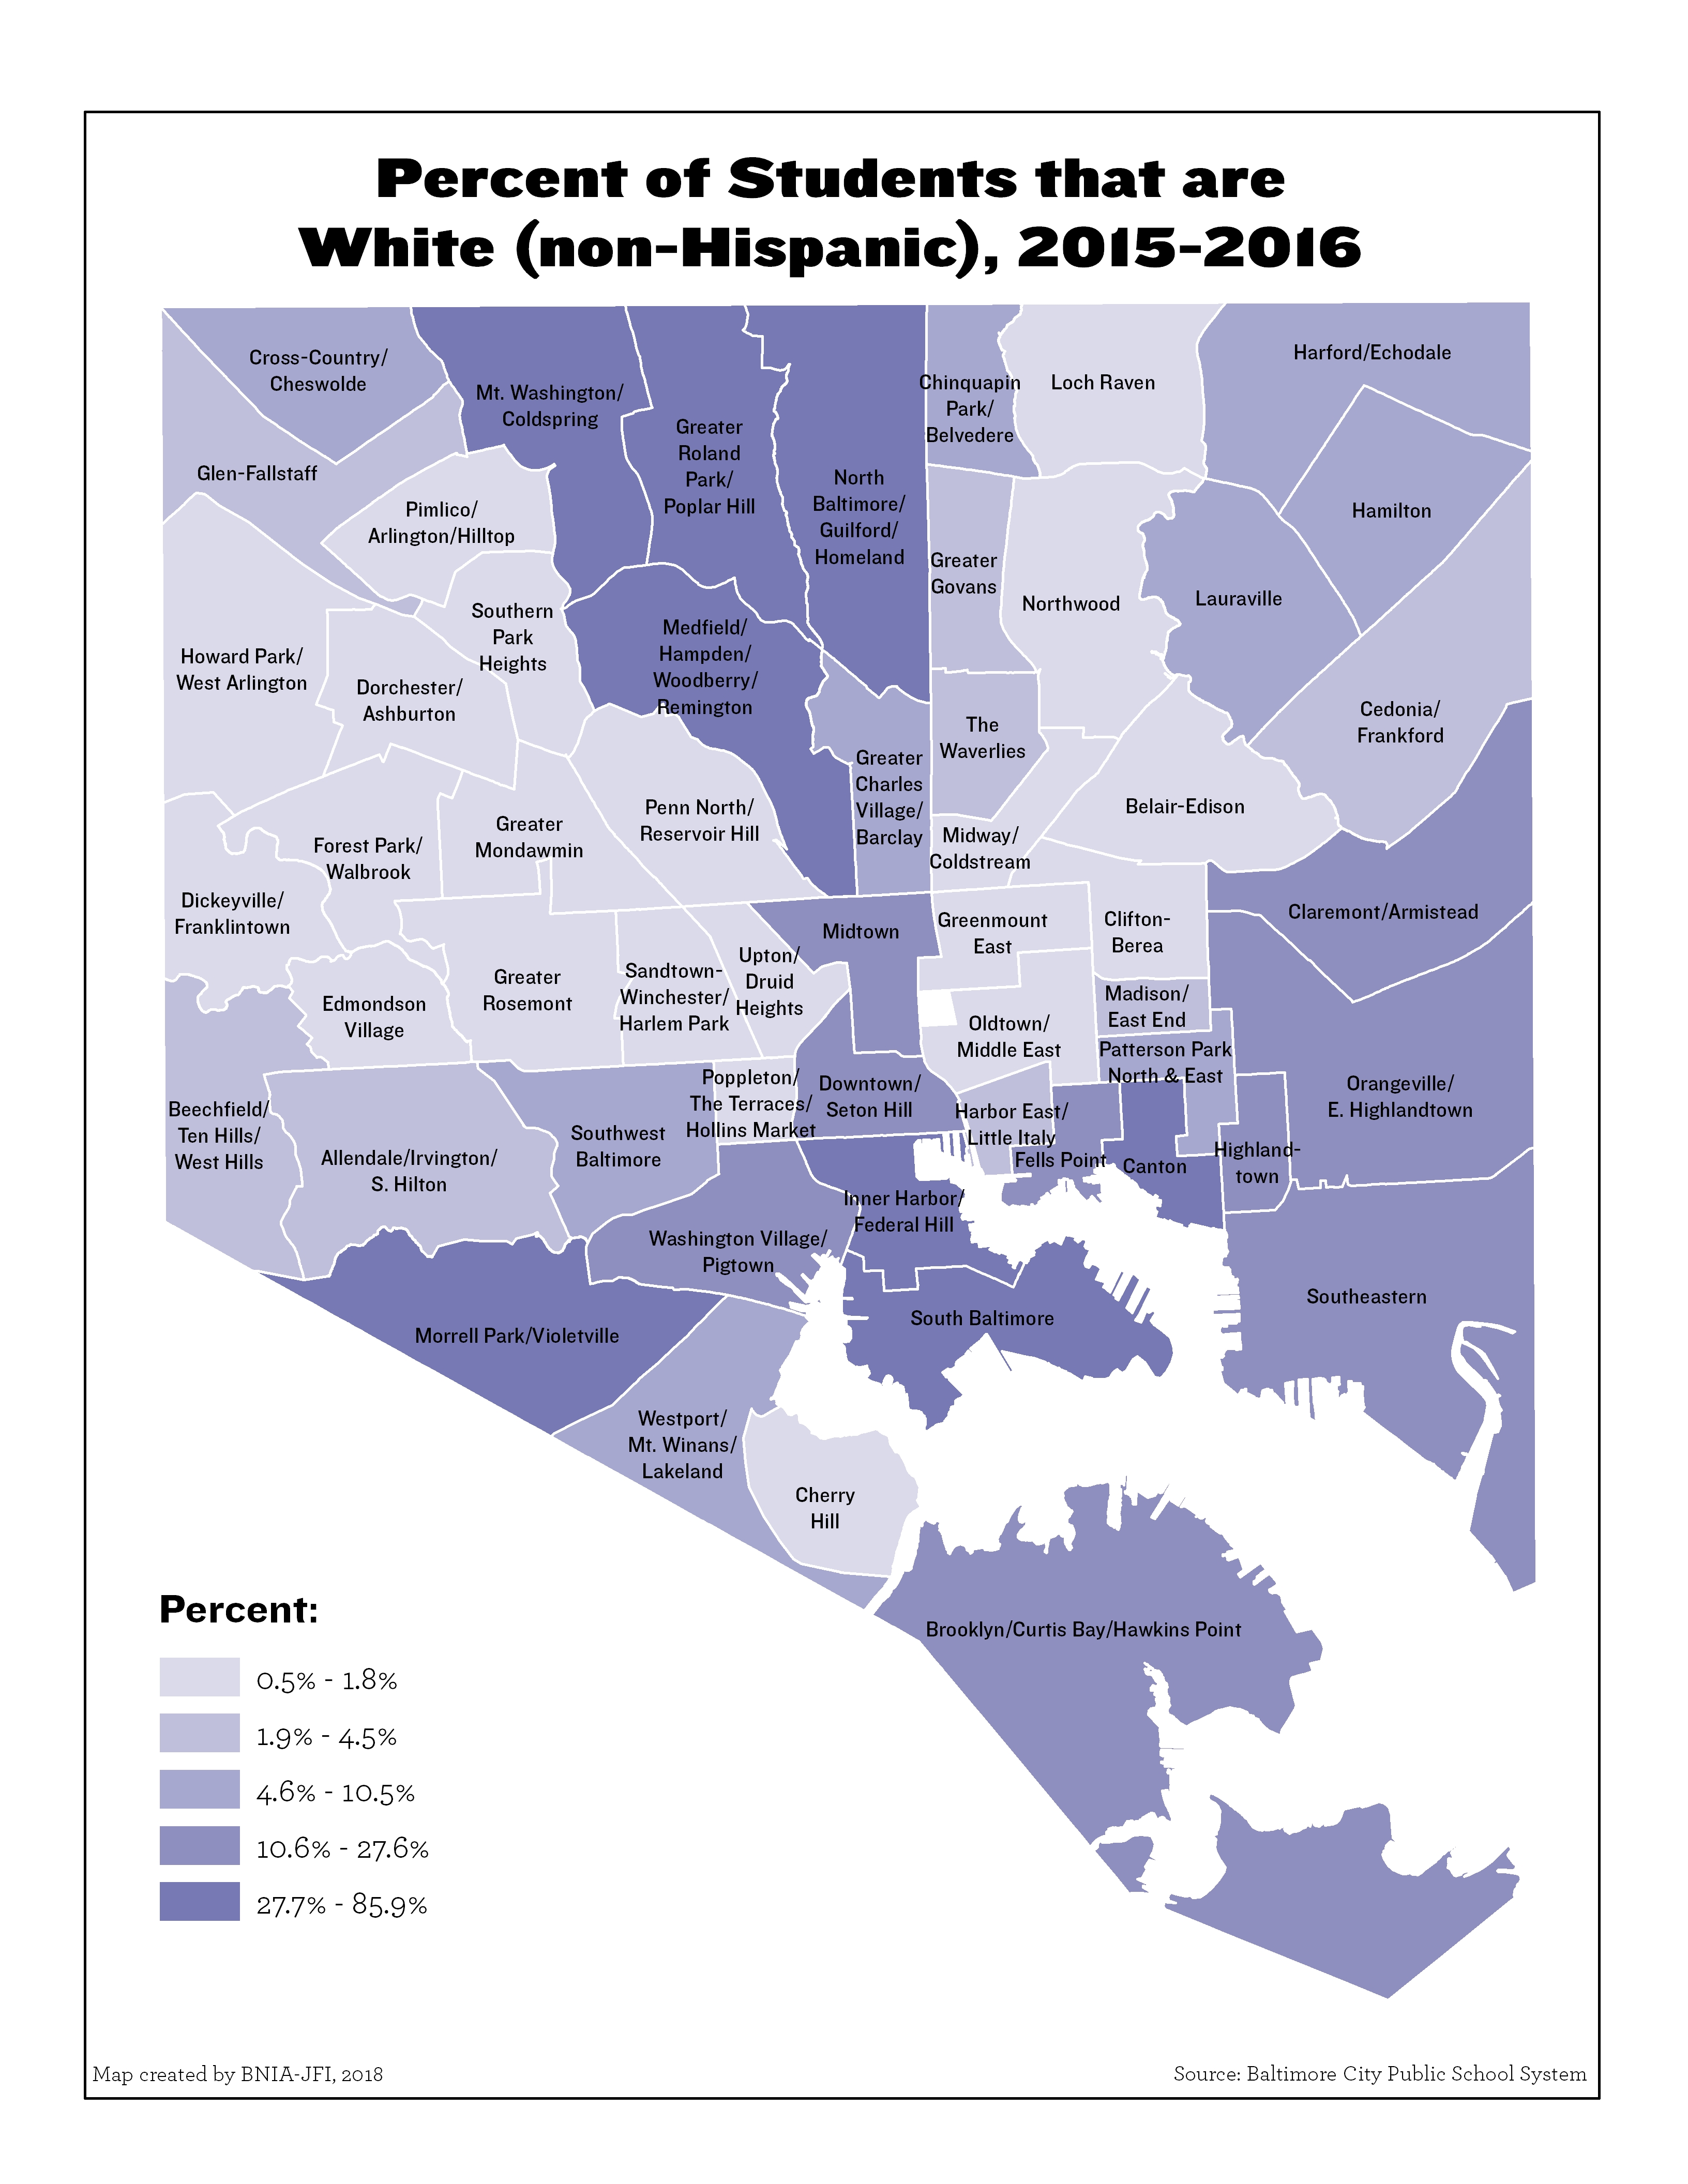
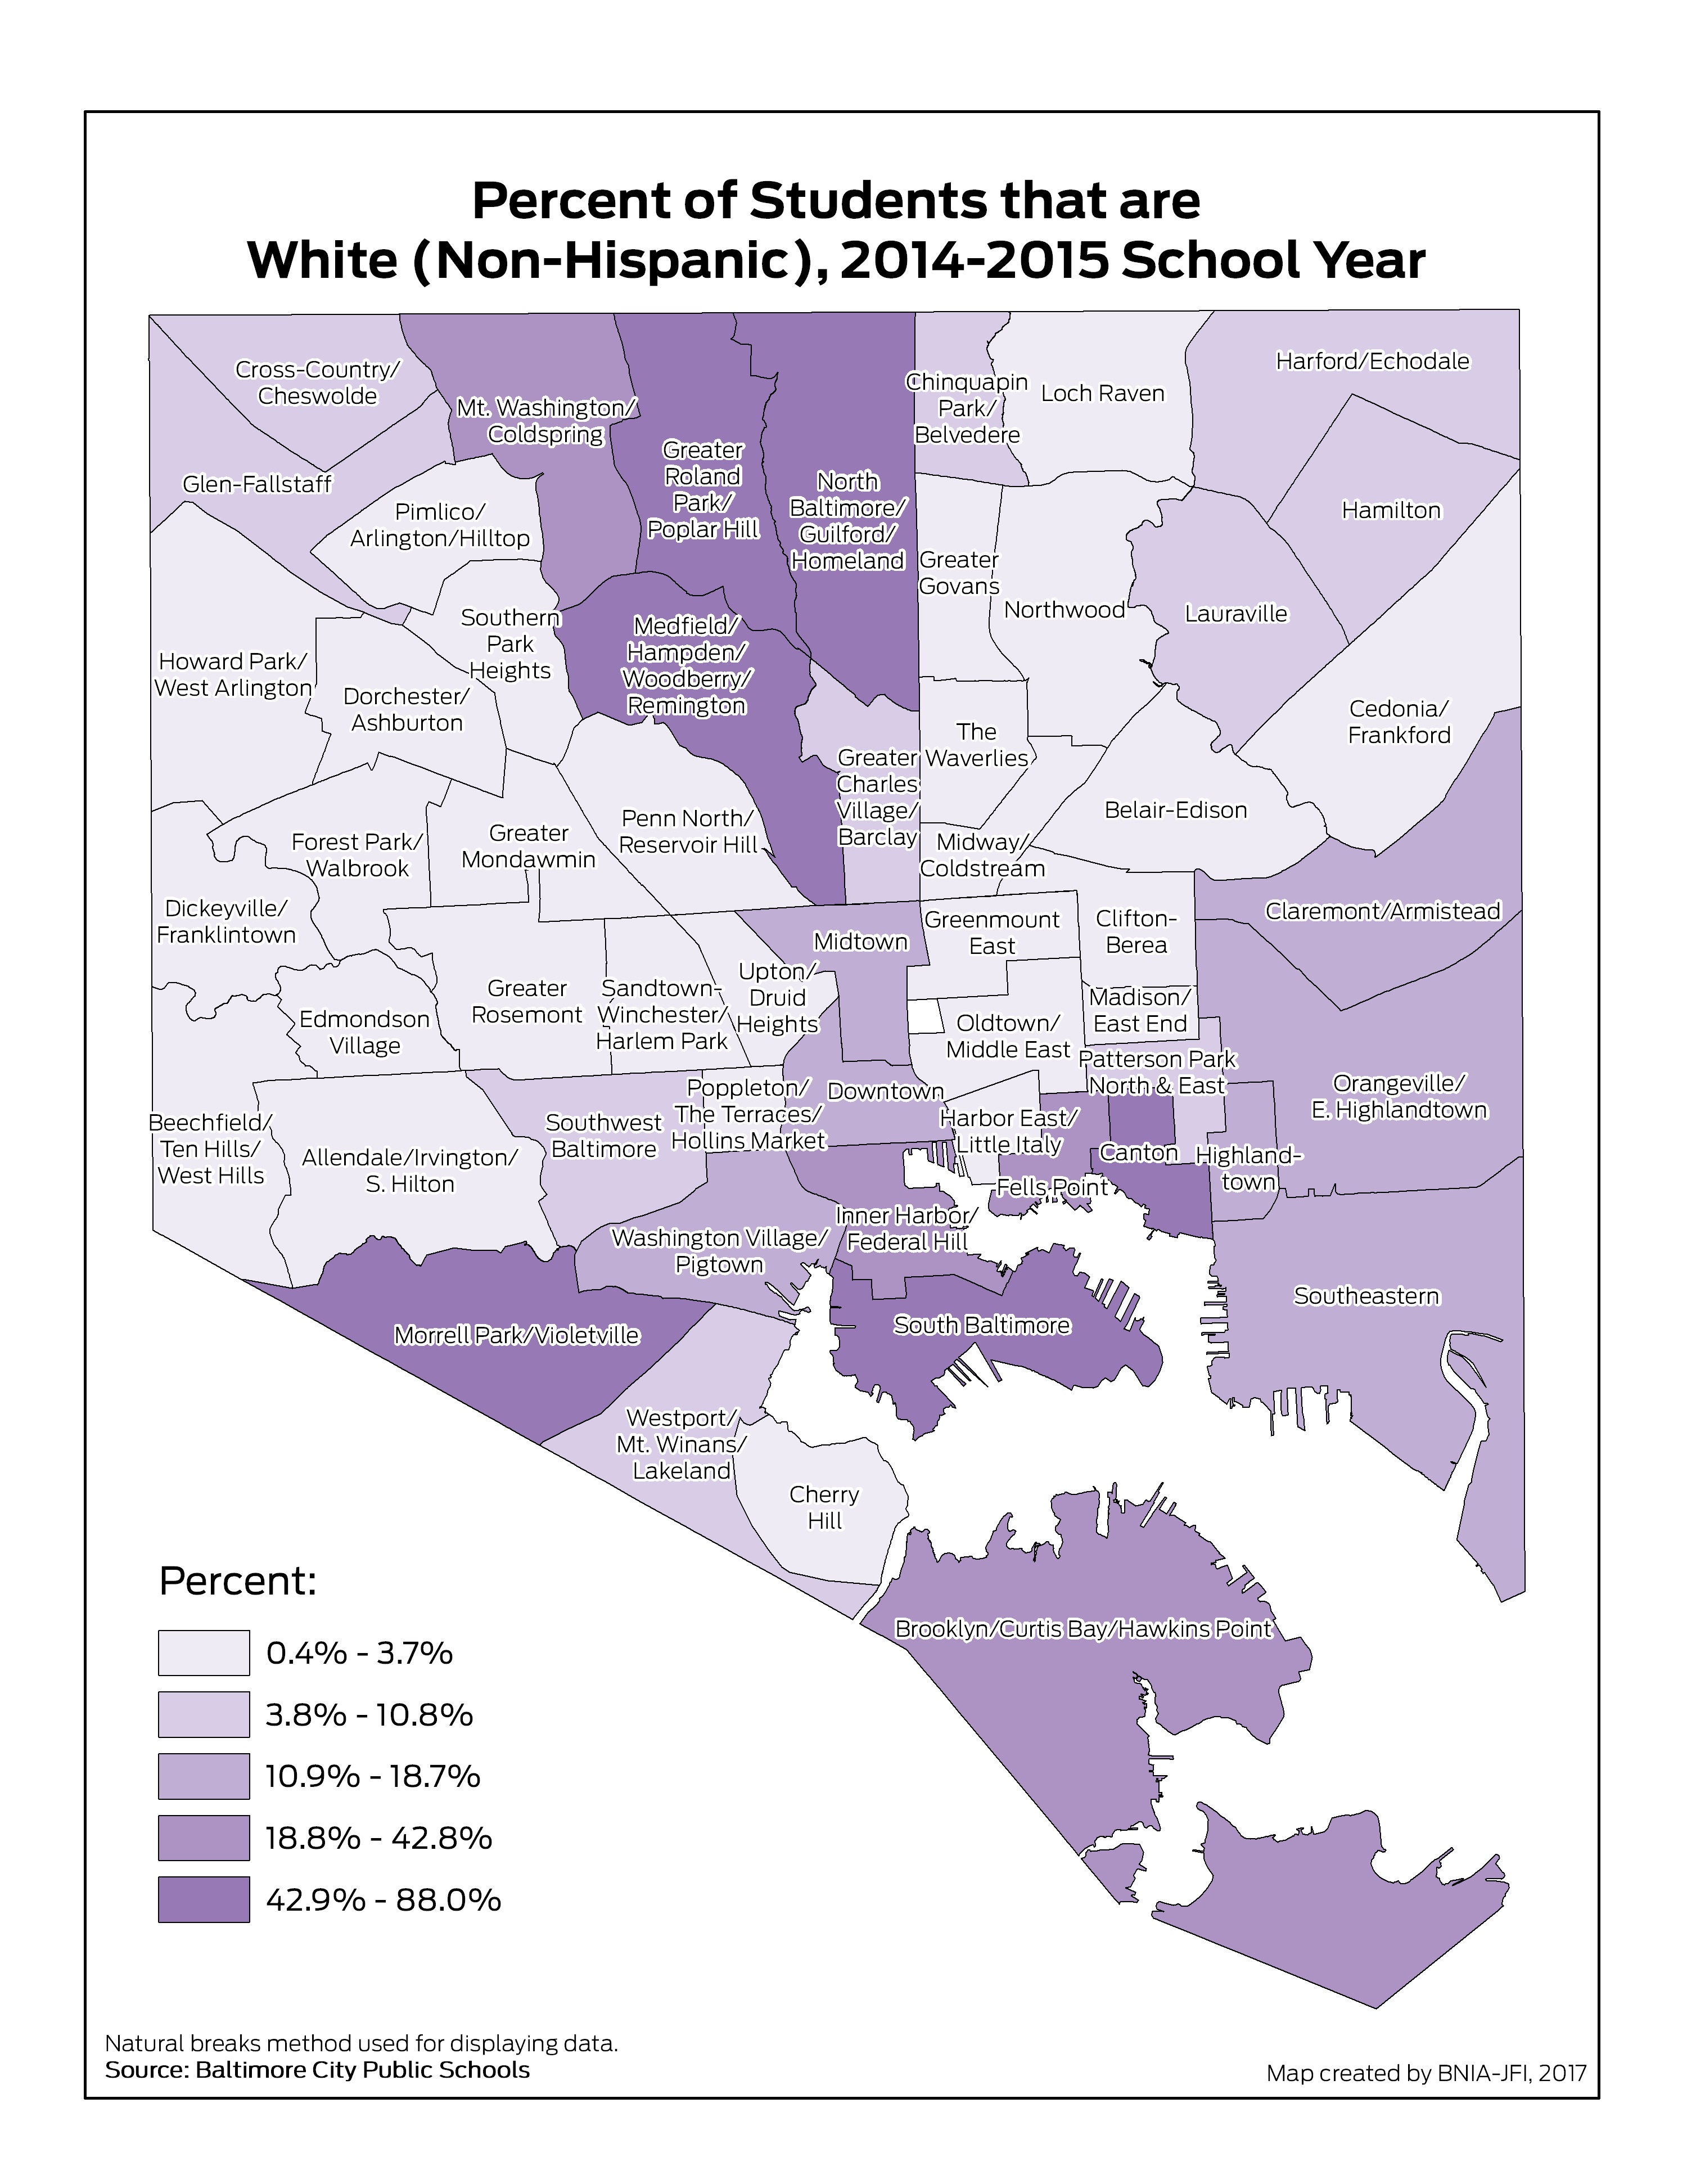
Percent of Students that are White (Non-Hispanic) (2019-2020)
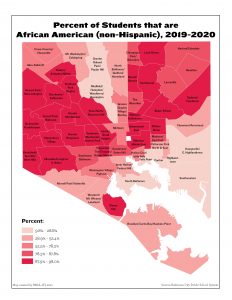
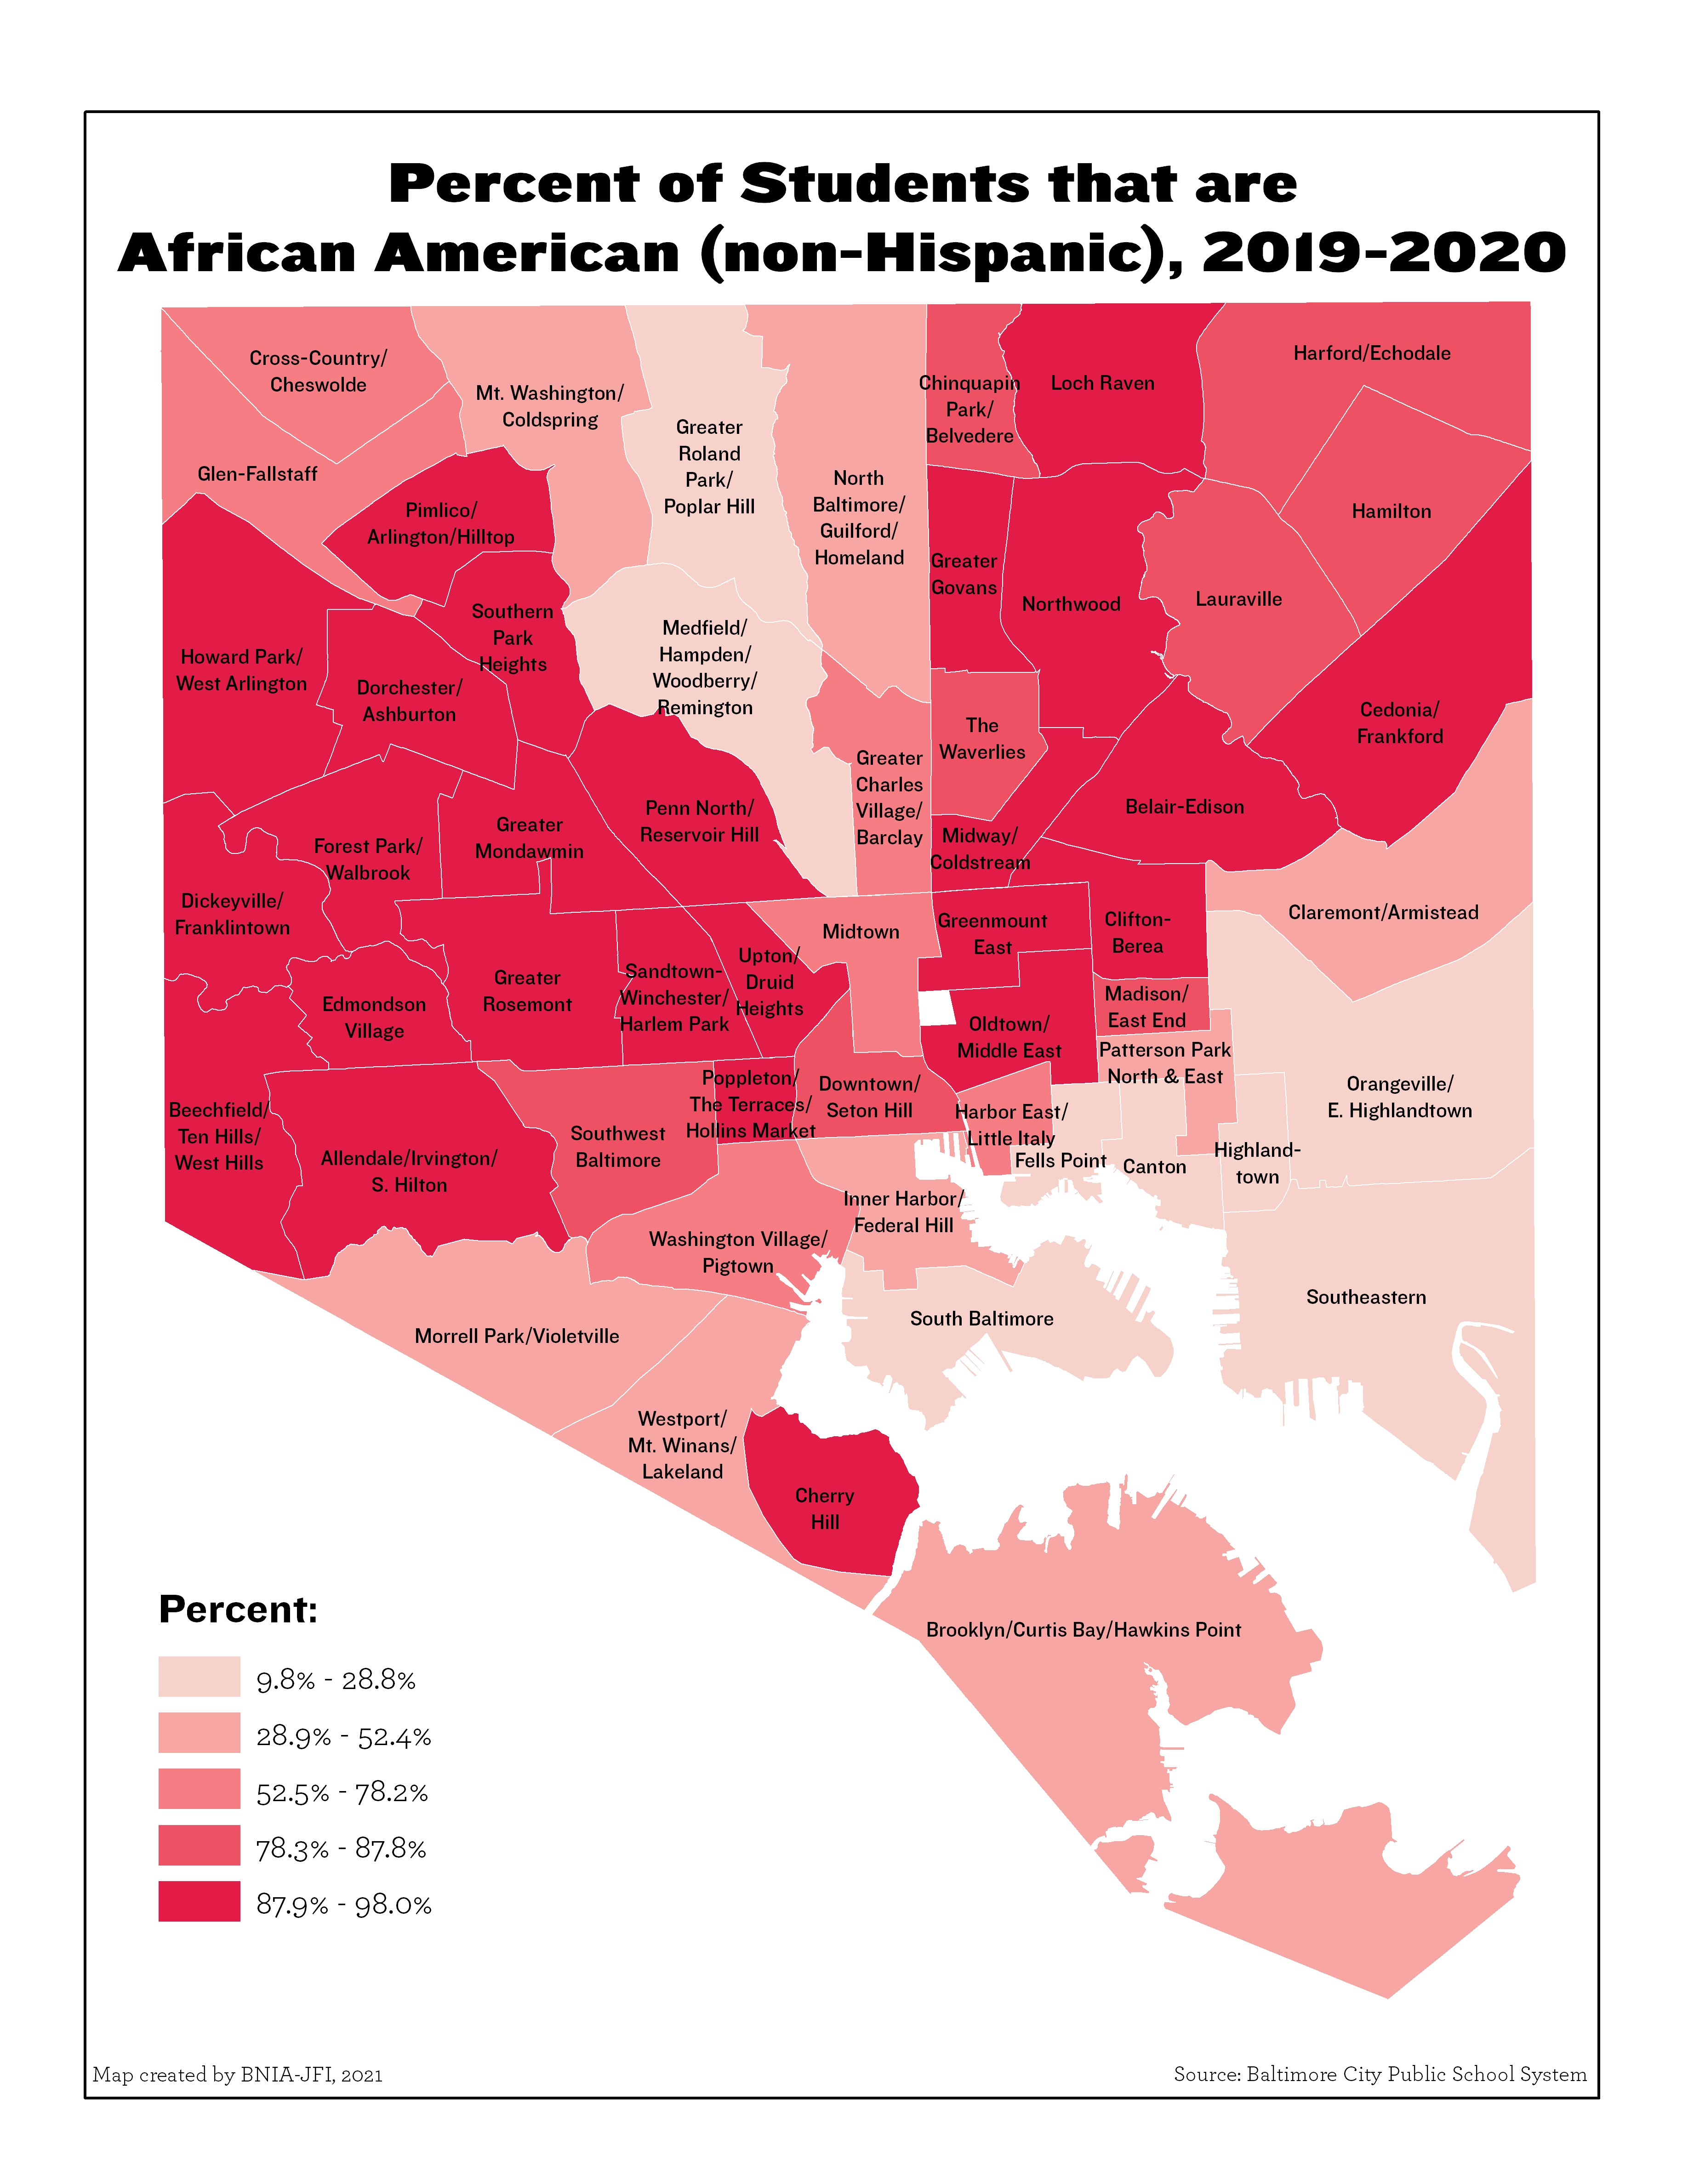
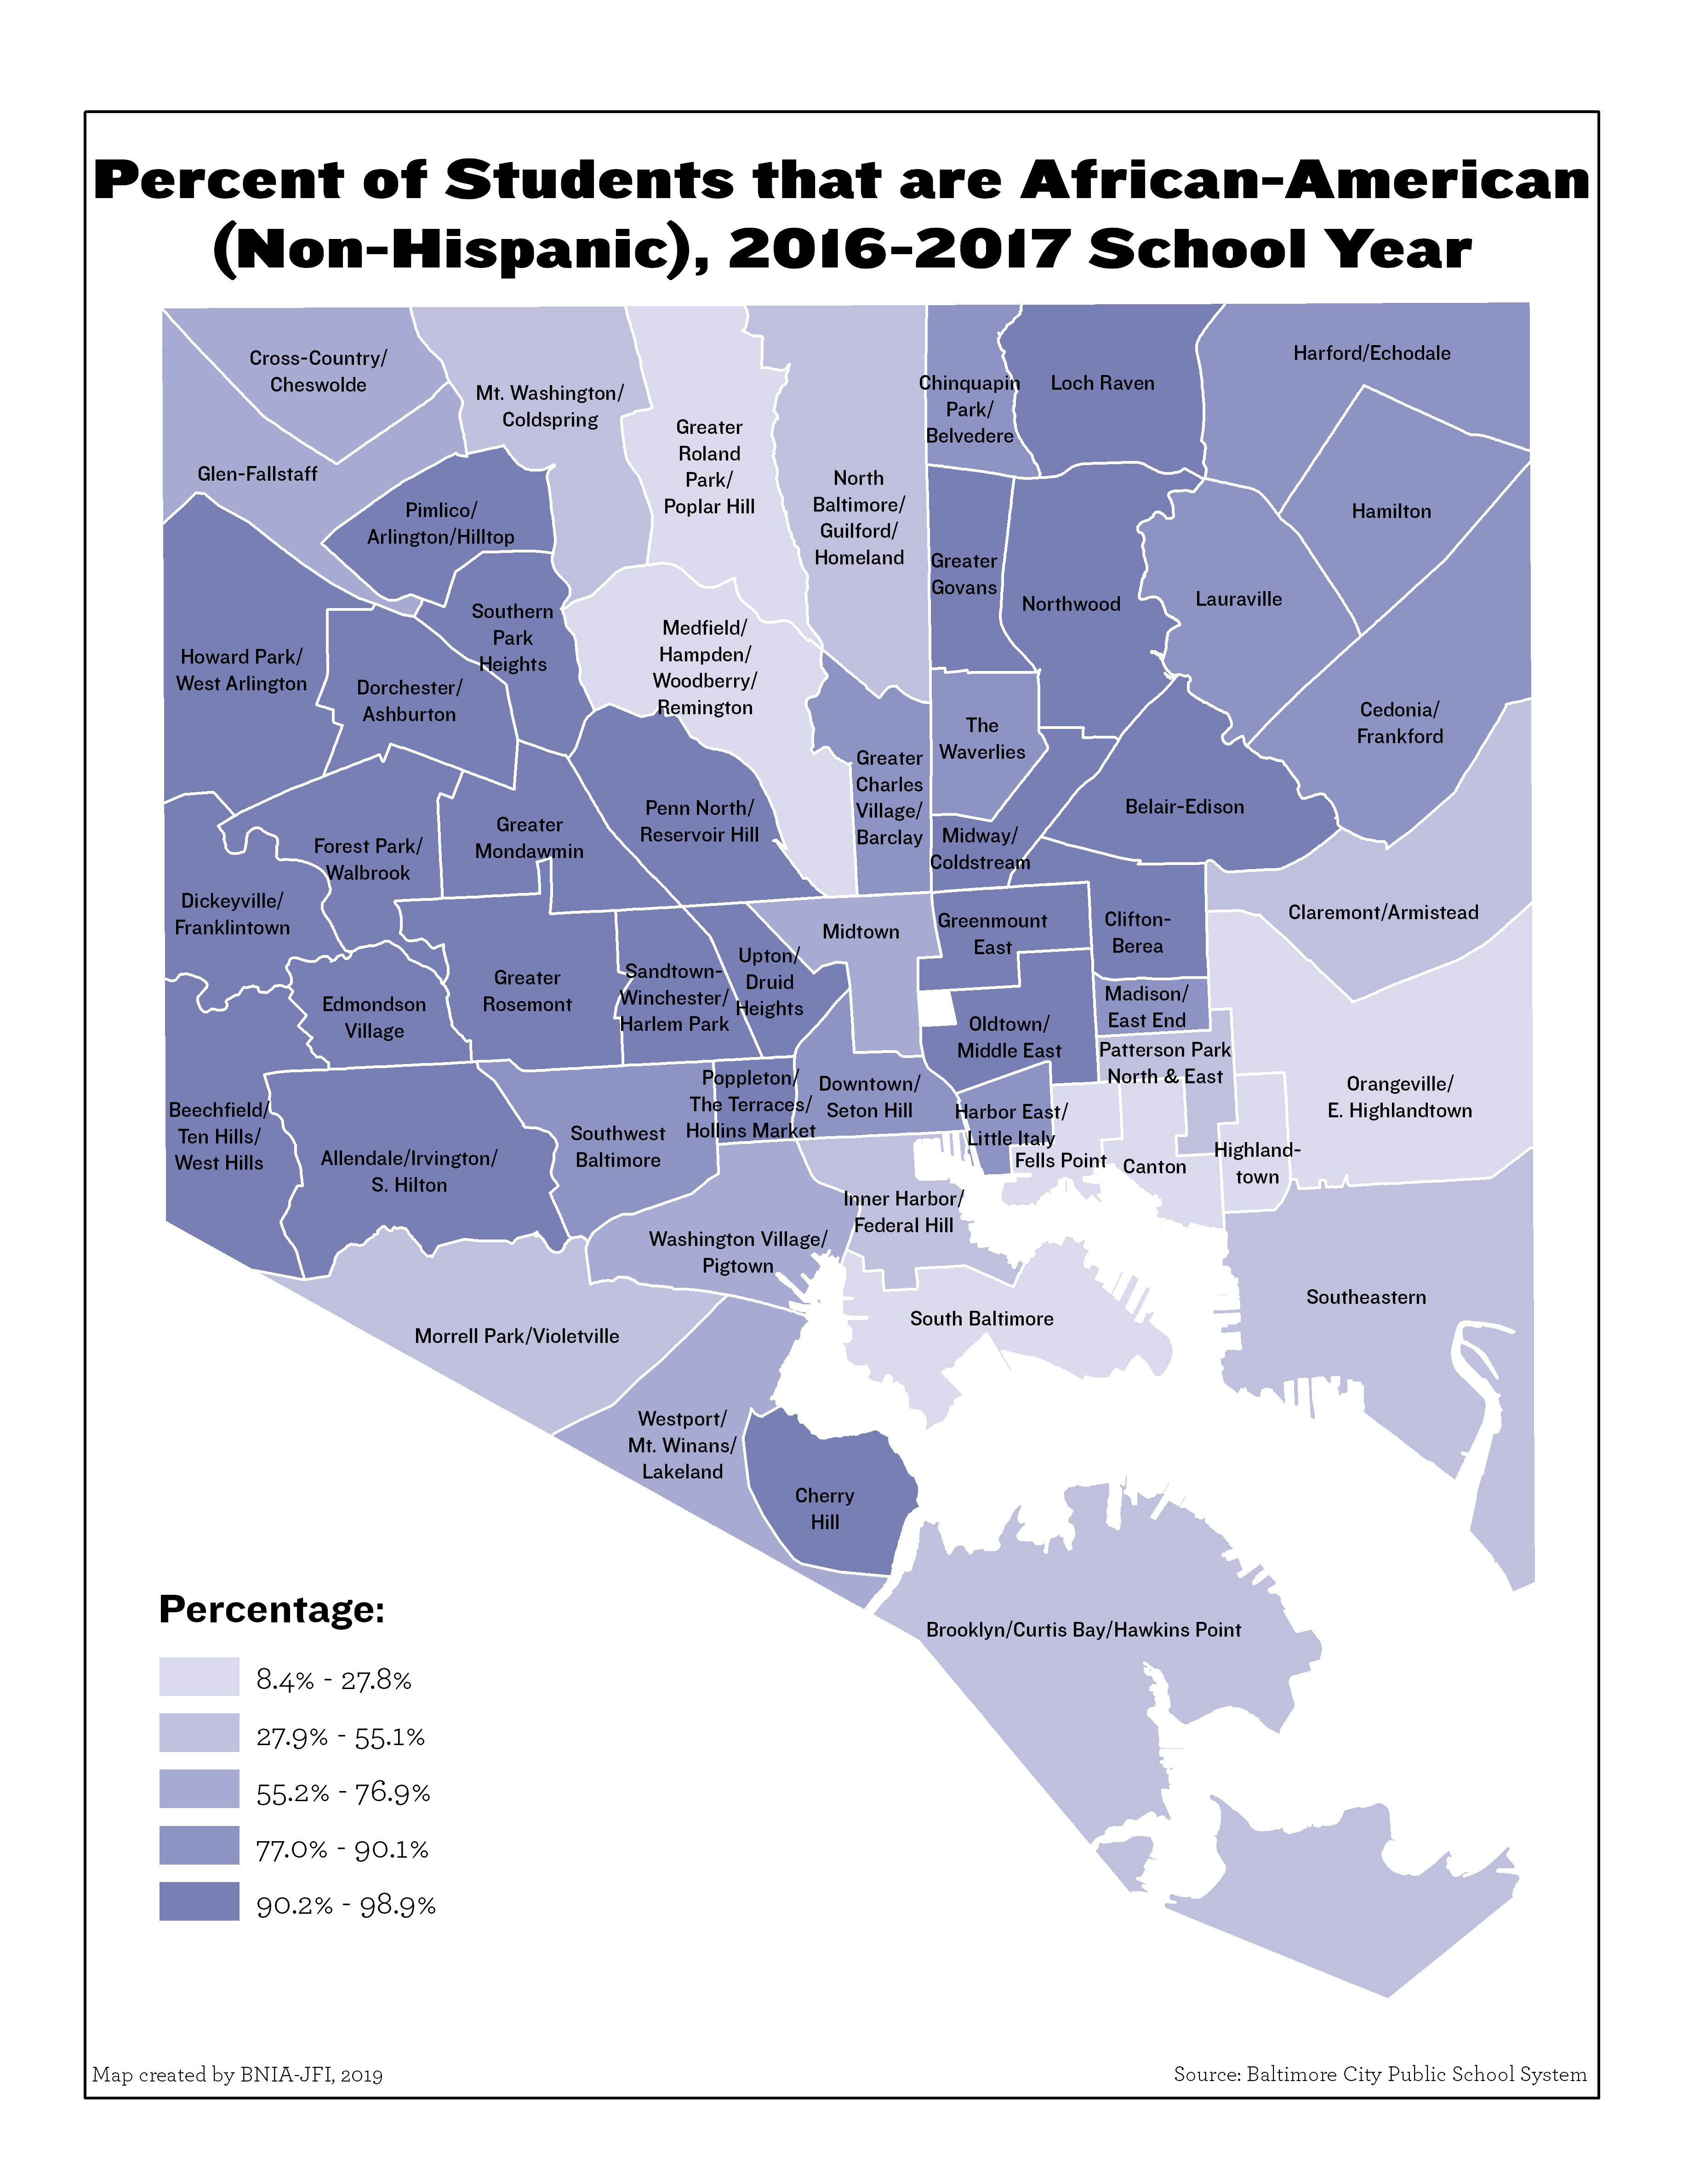
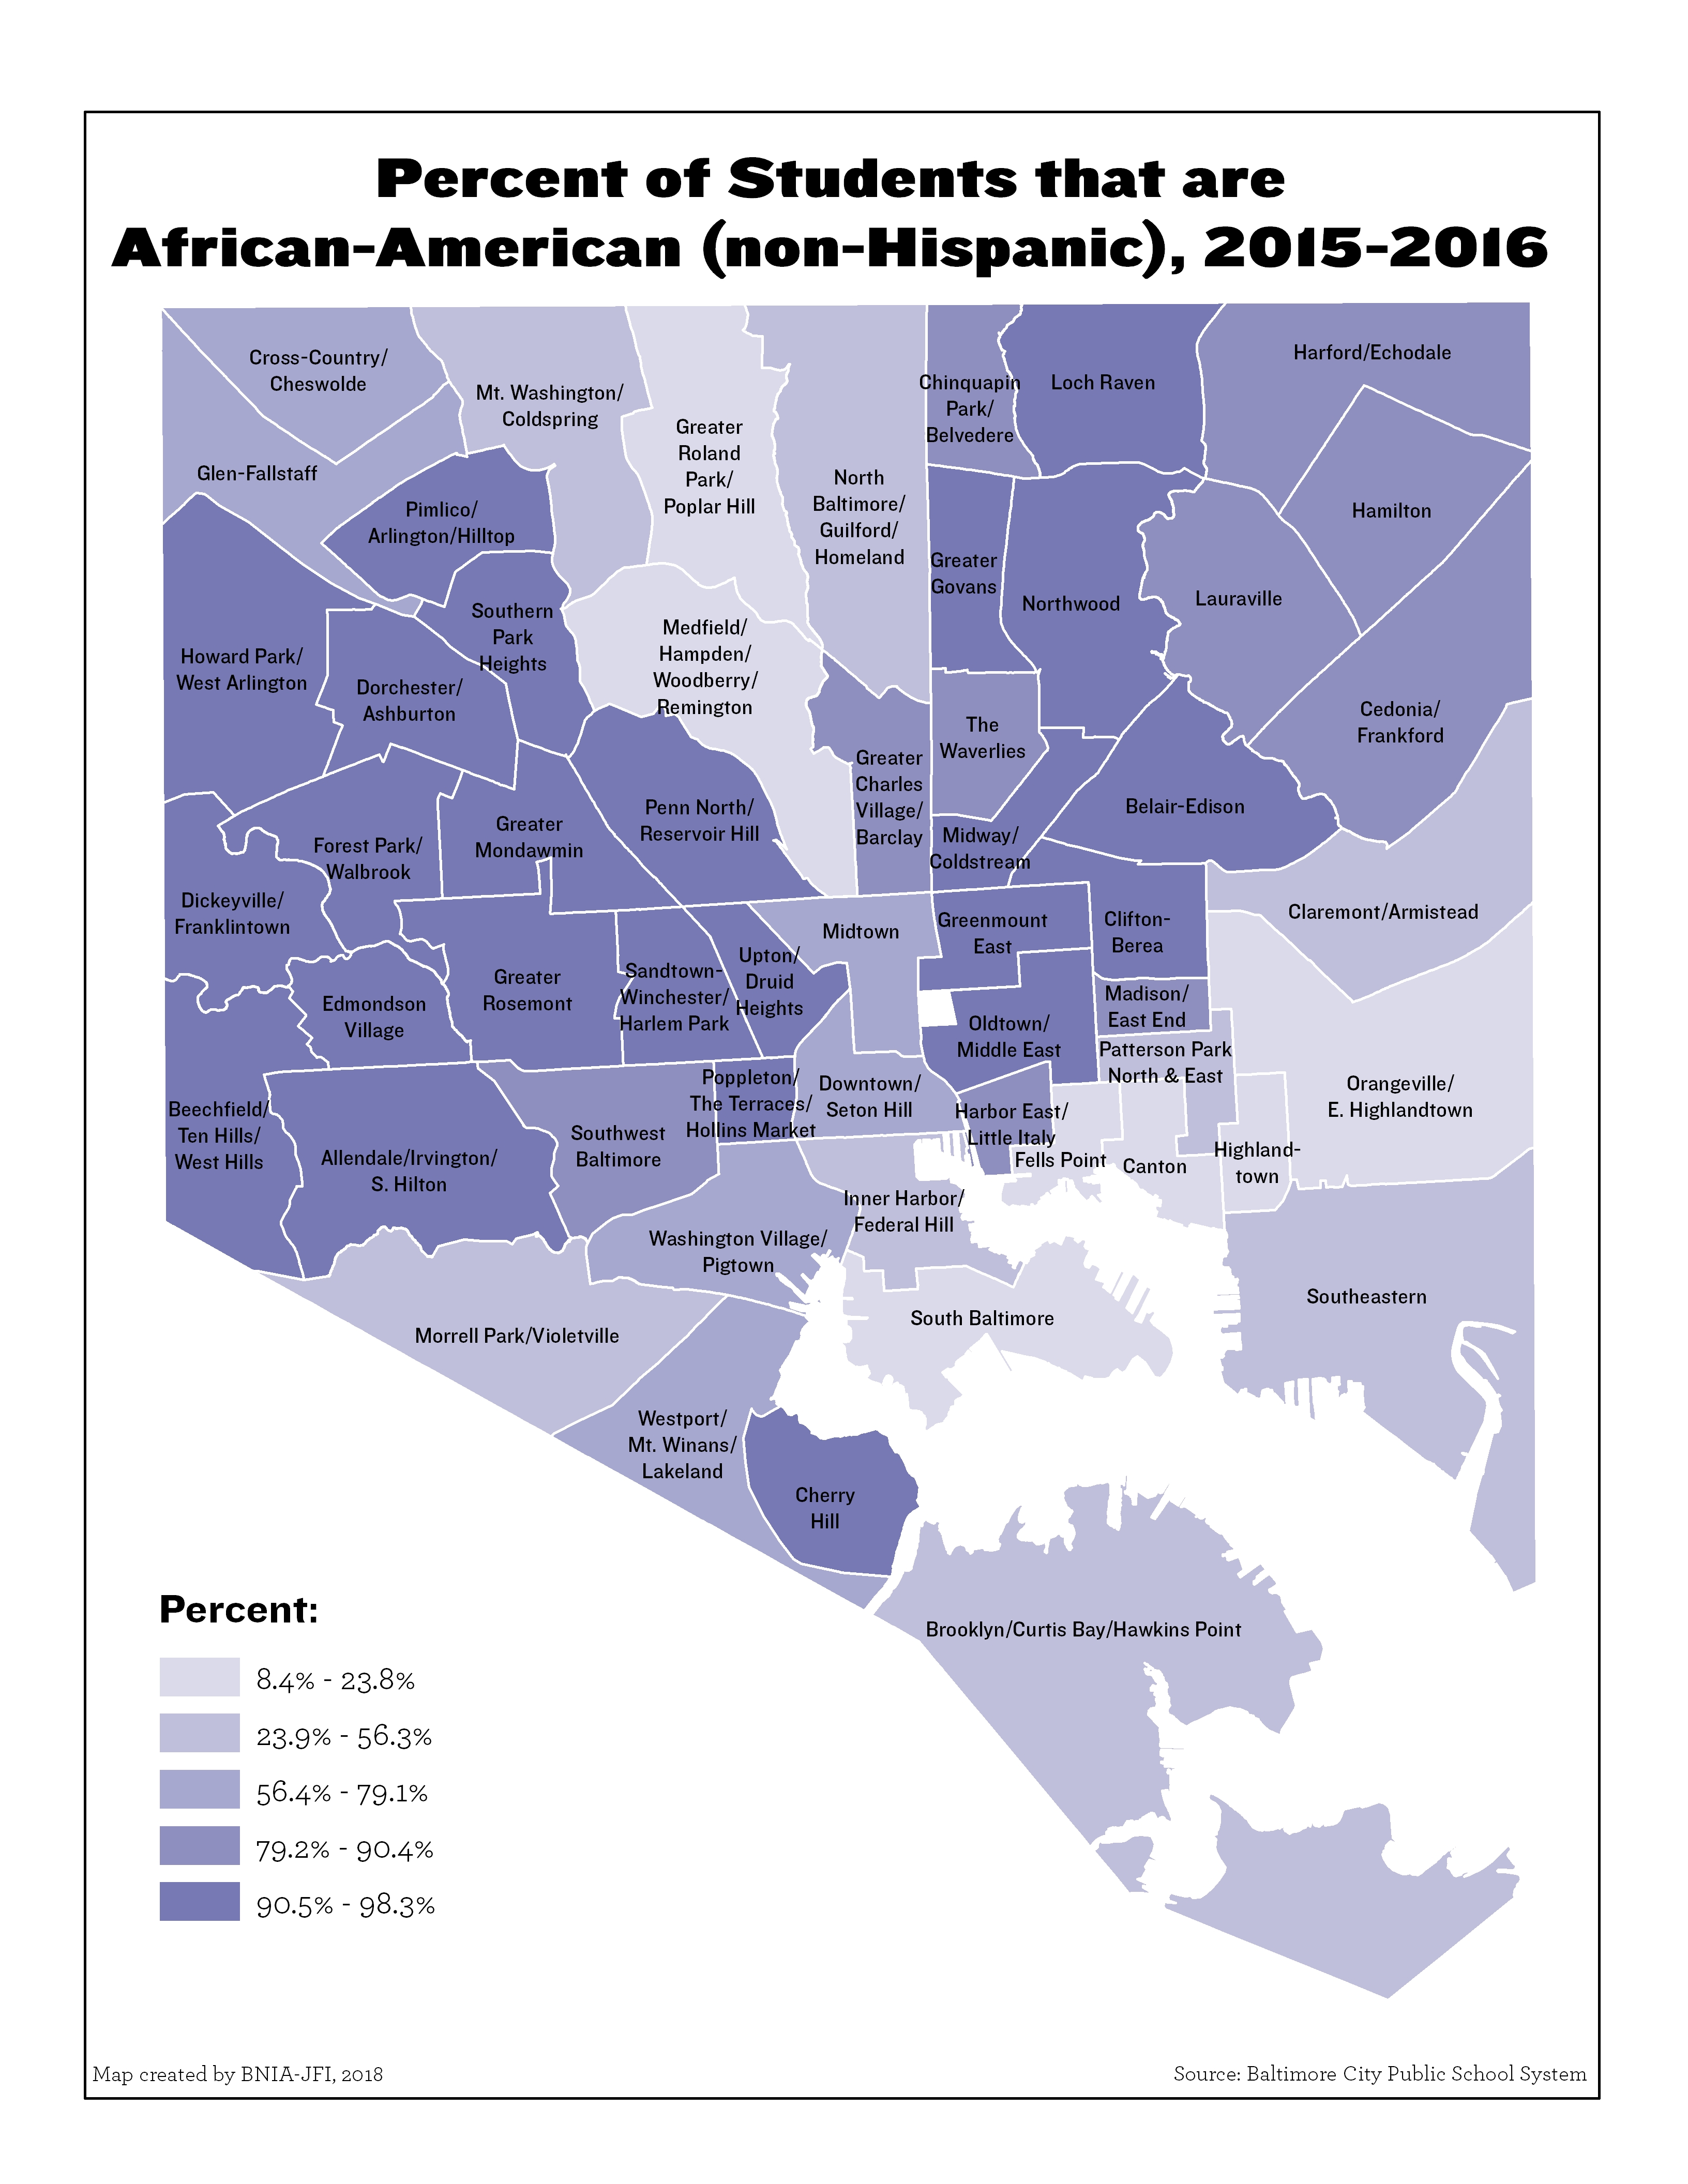
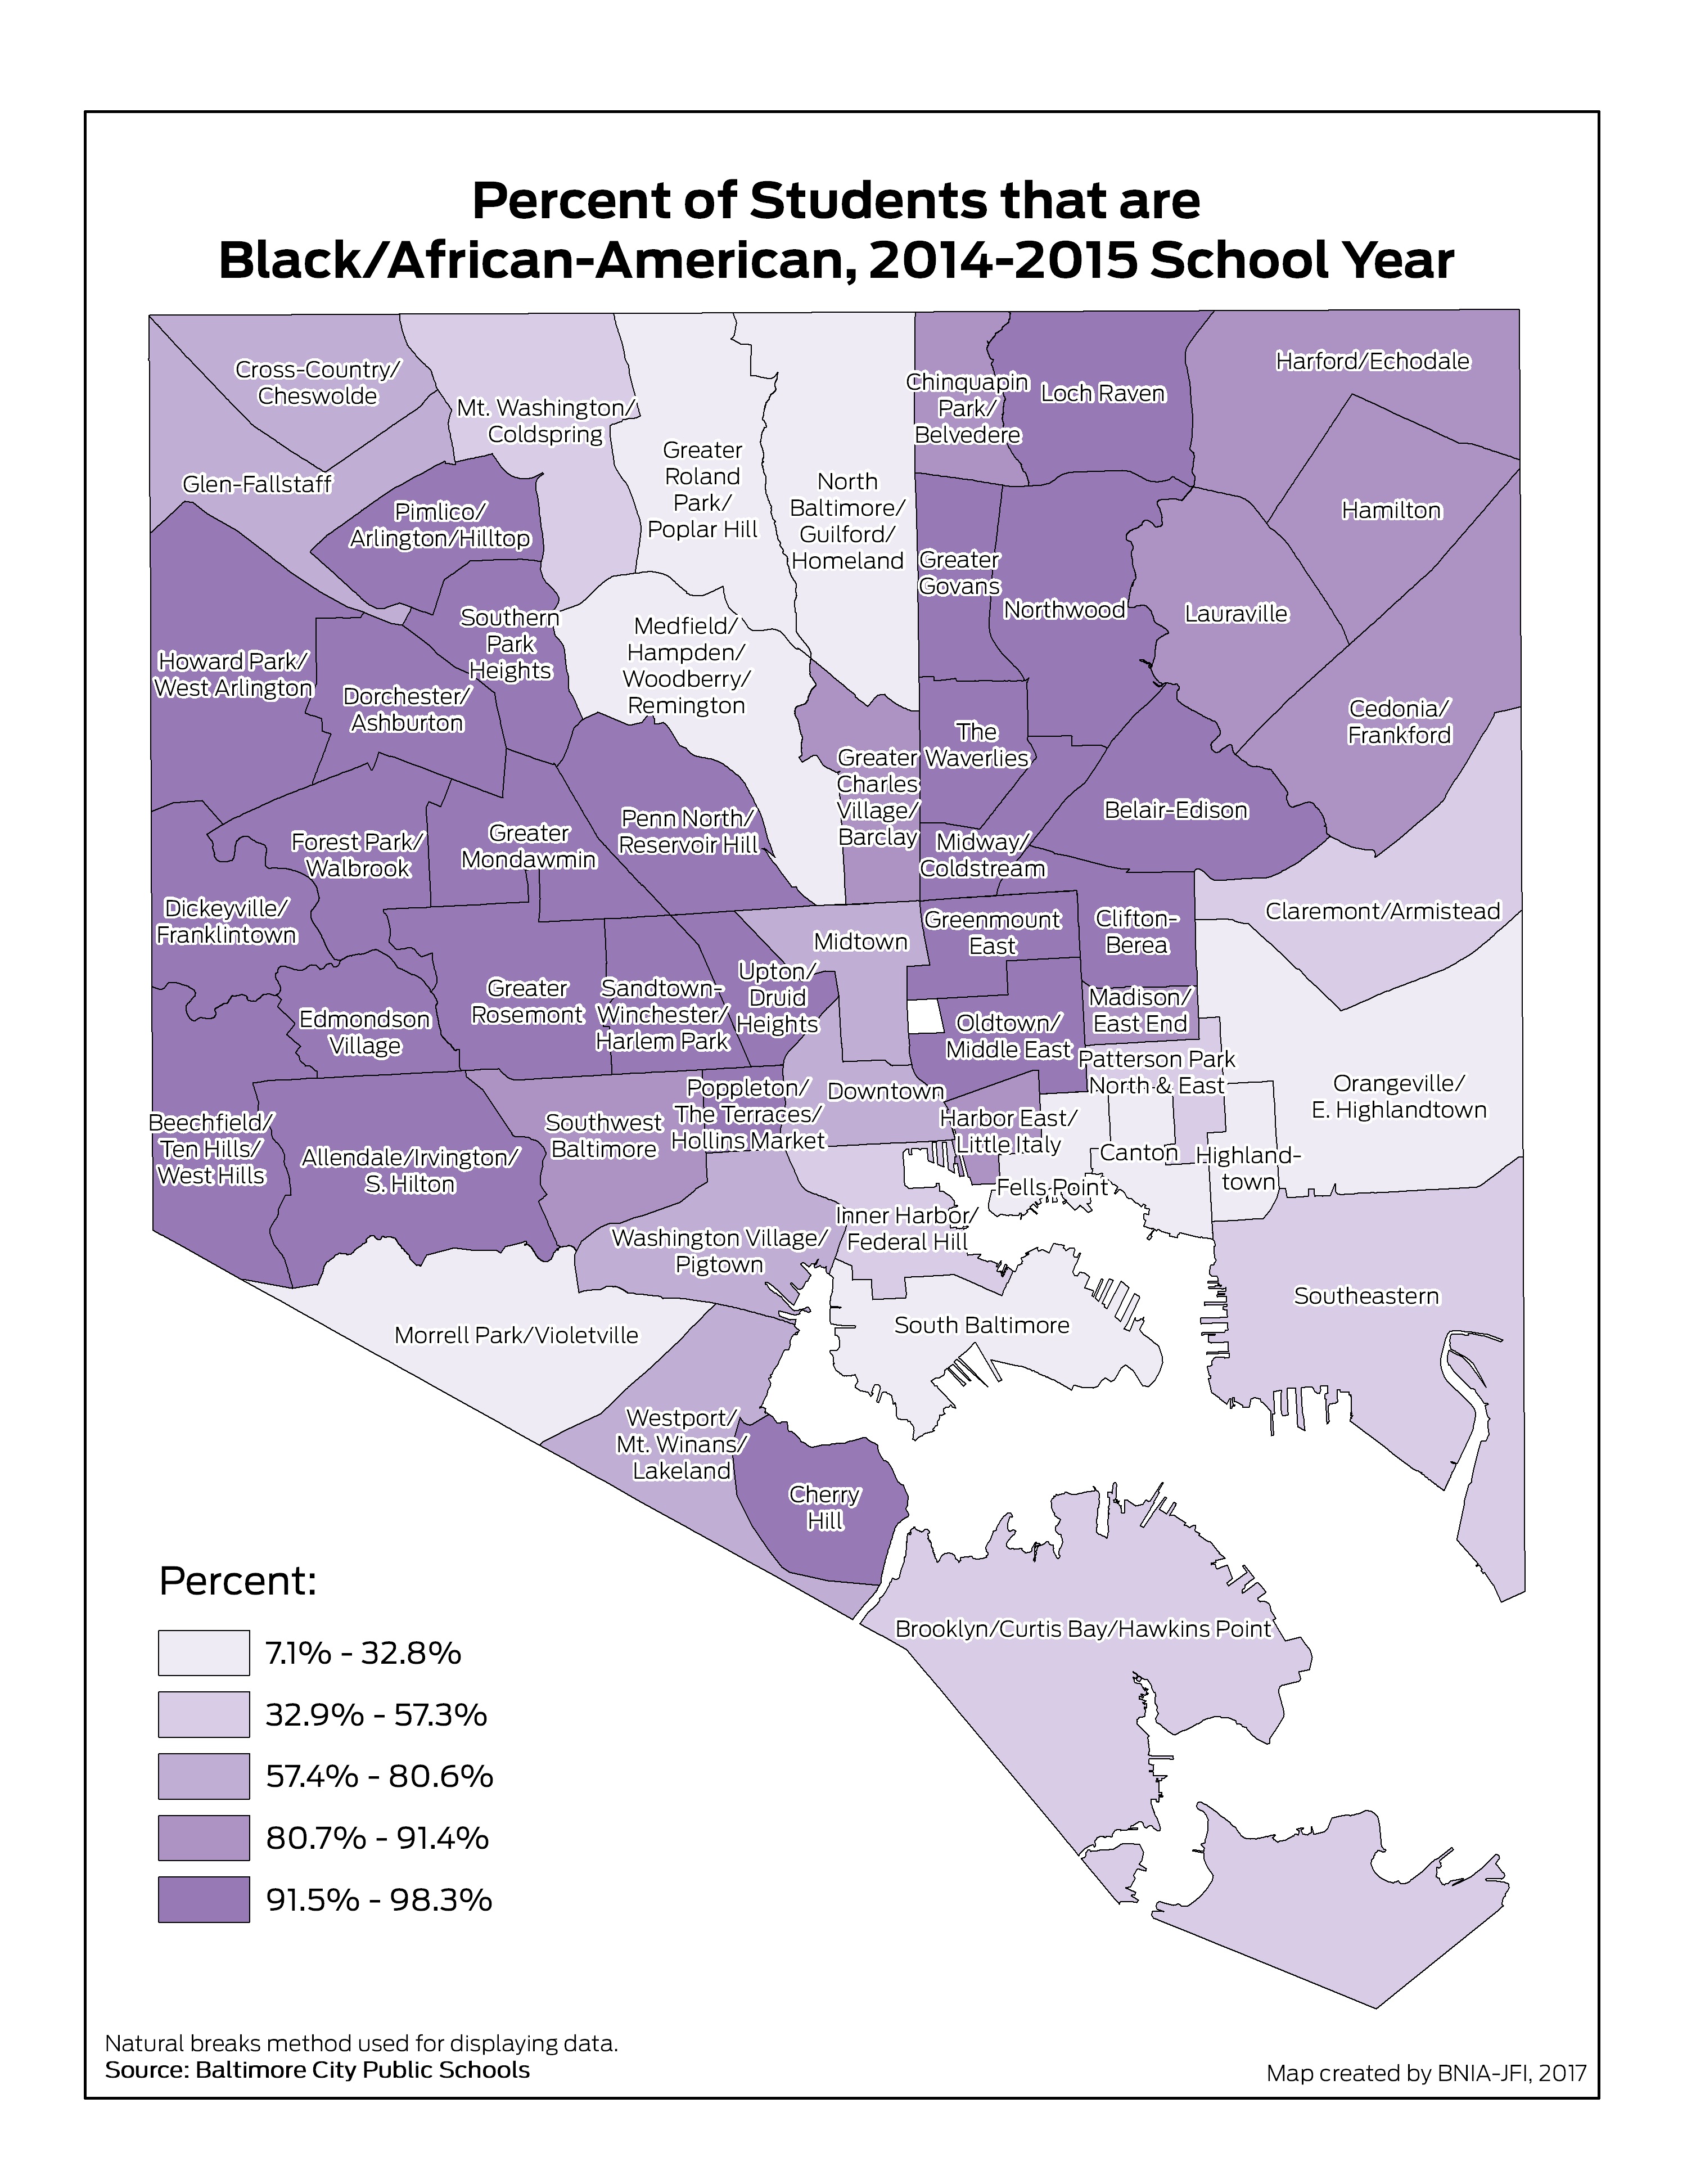
Percent of Students that are African American (Non-Hispanic) (2019-2020)

Number of Students Officially Enrolled in 1st-5th Grade (2018-2019)

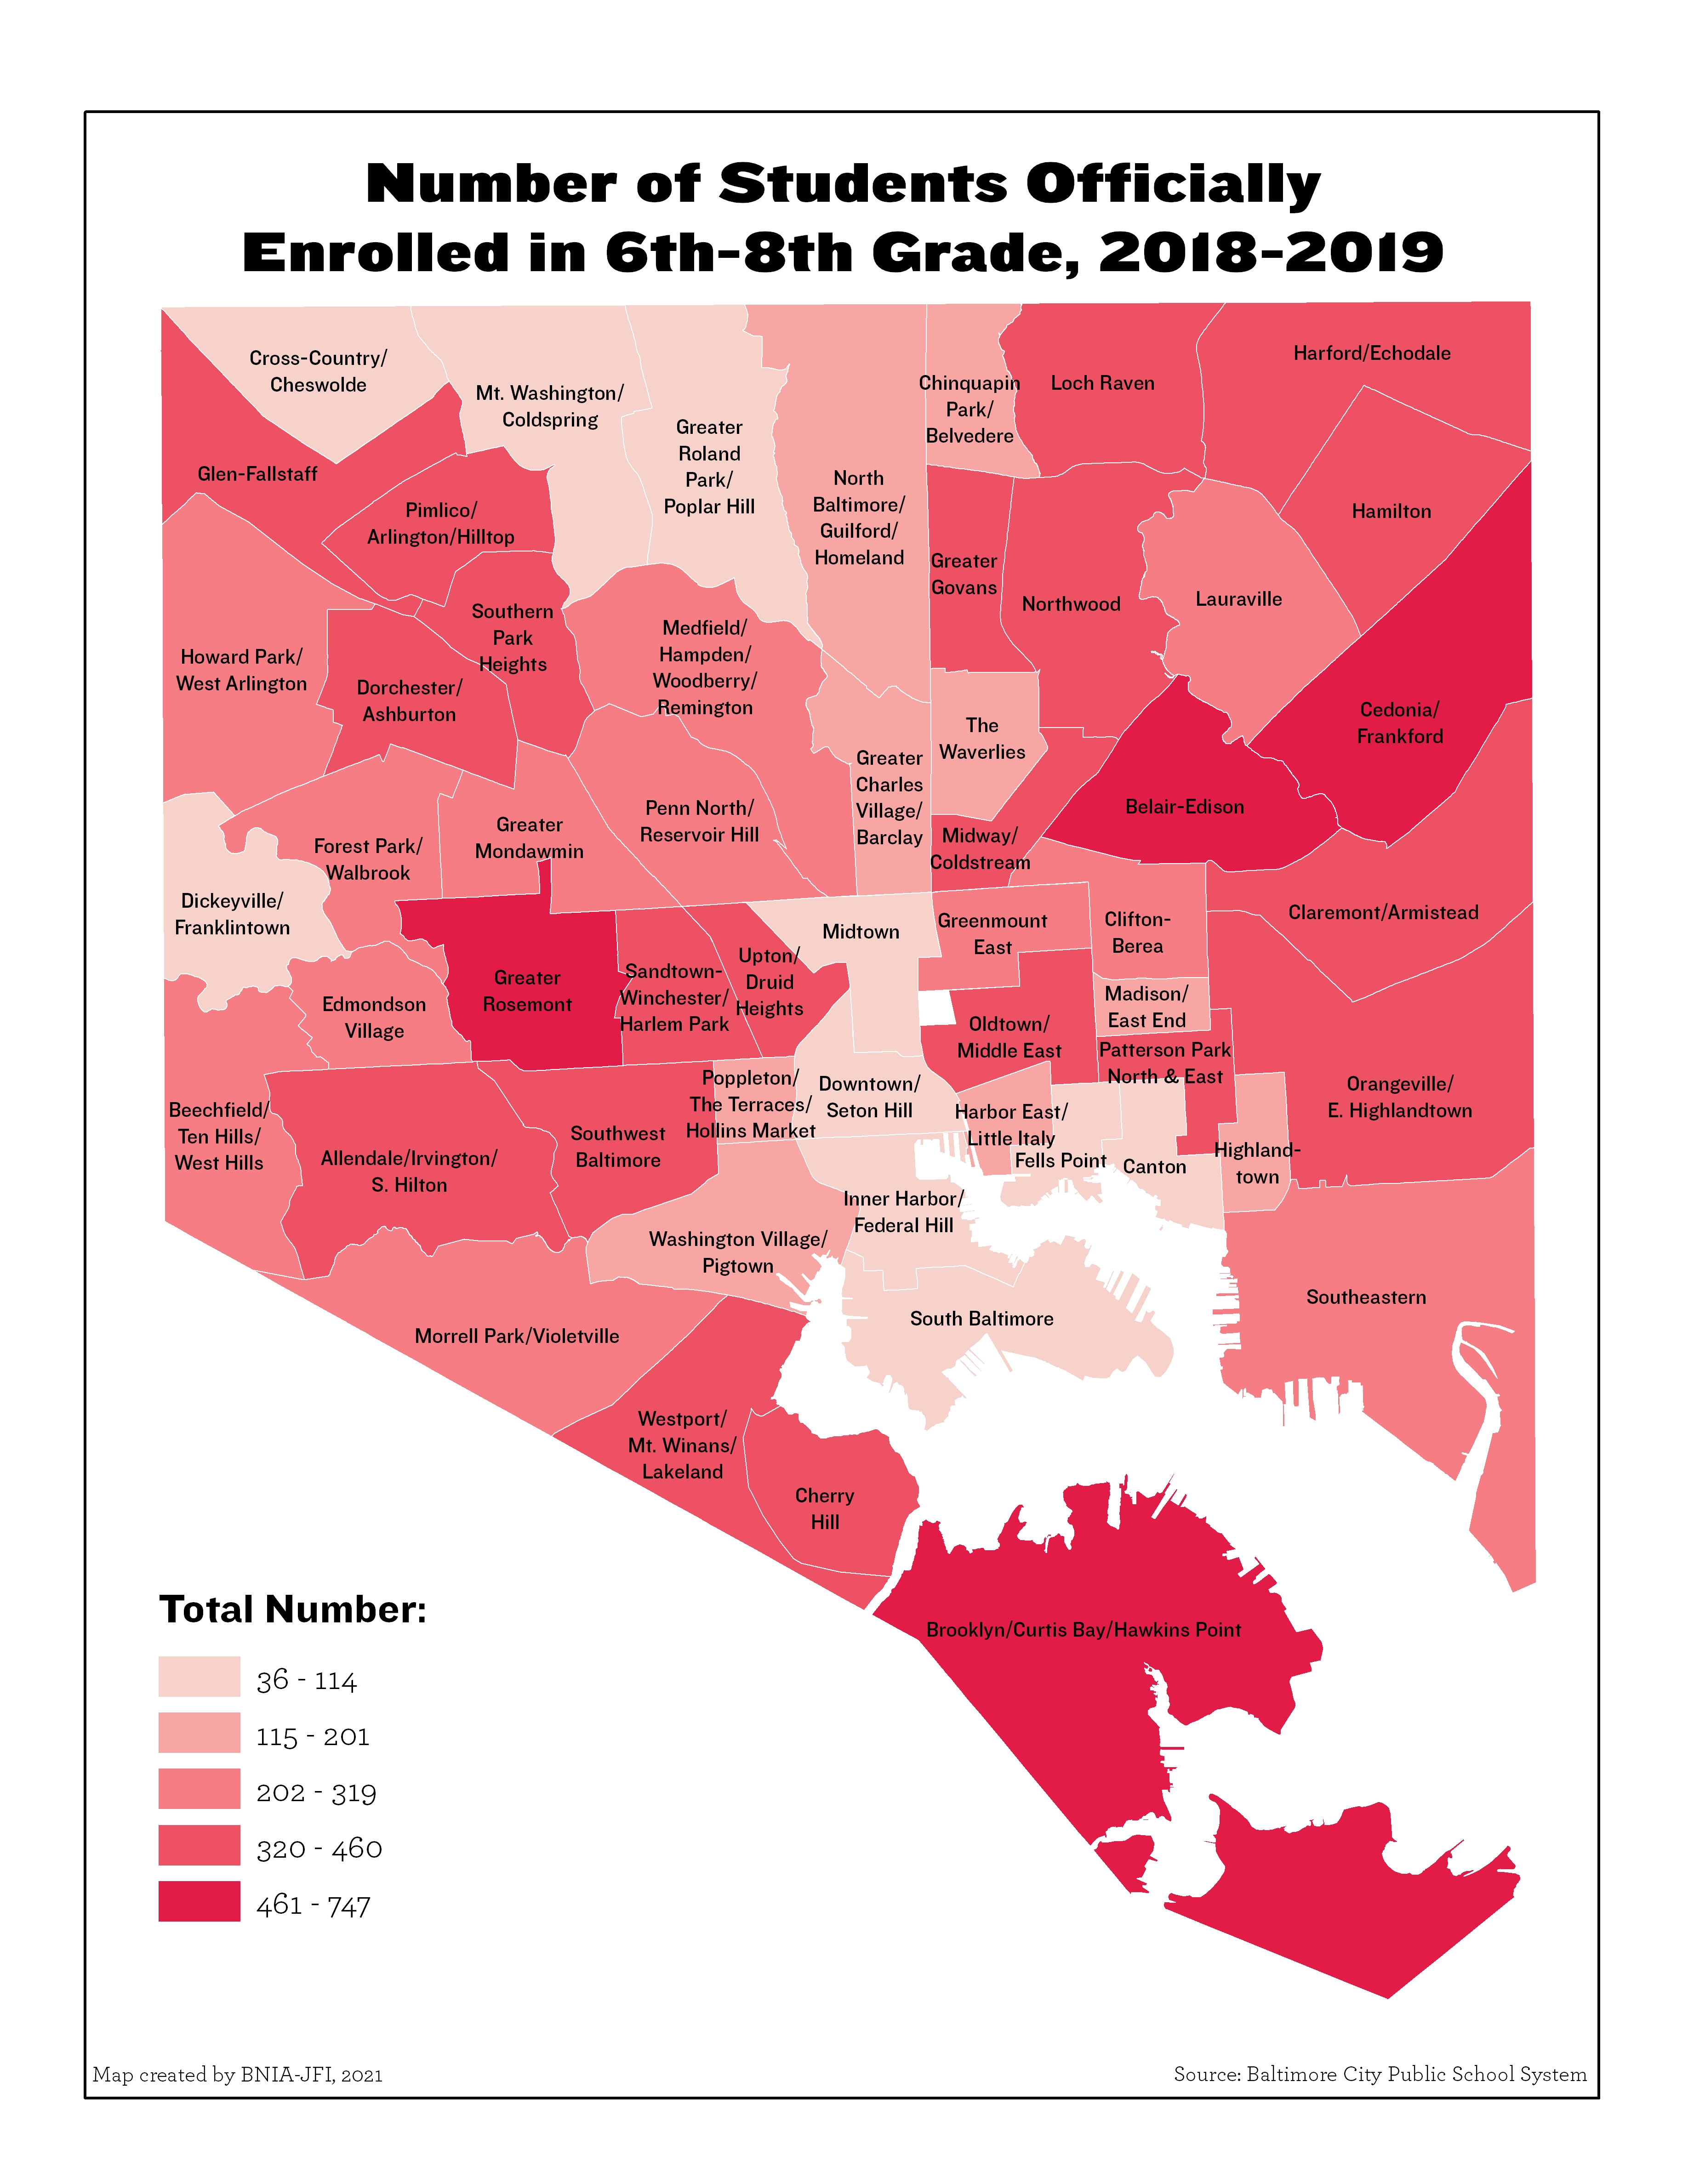
Number of Students Officially Enrolled in 6th-8th Grade (2018-2019)
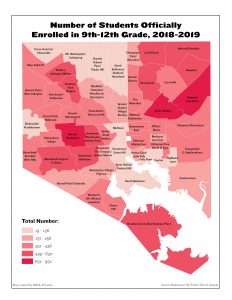
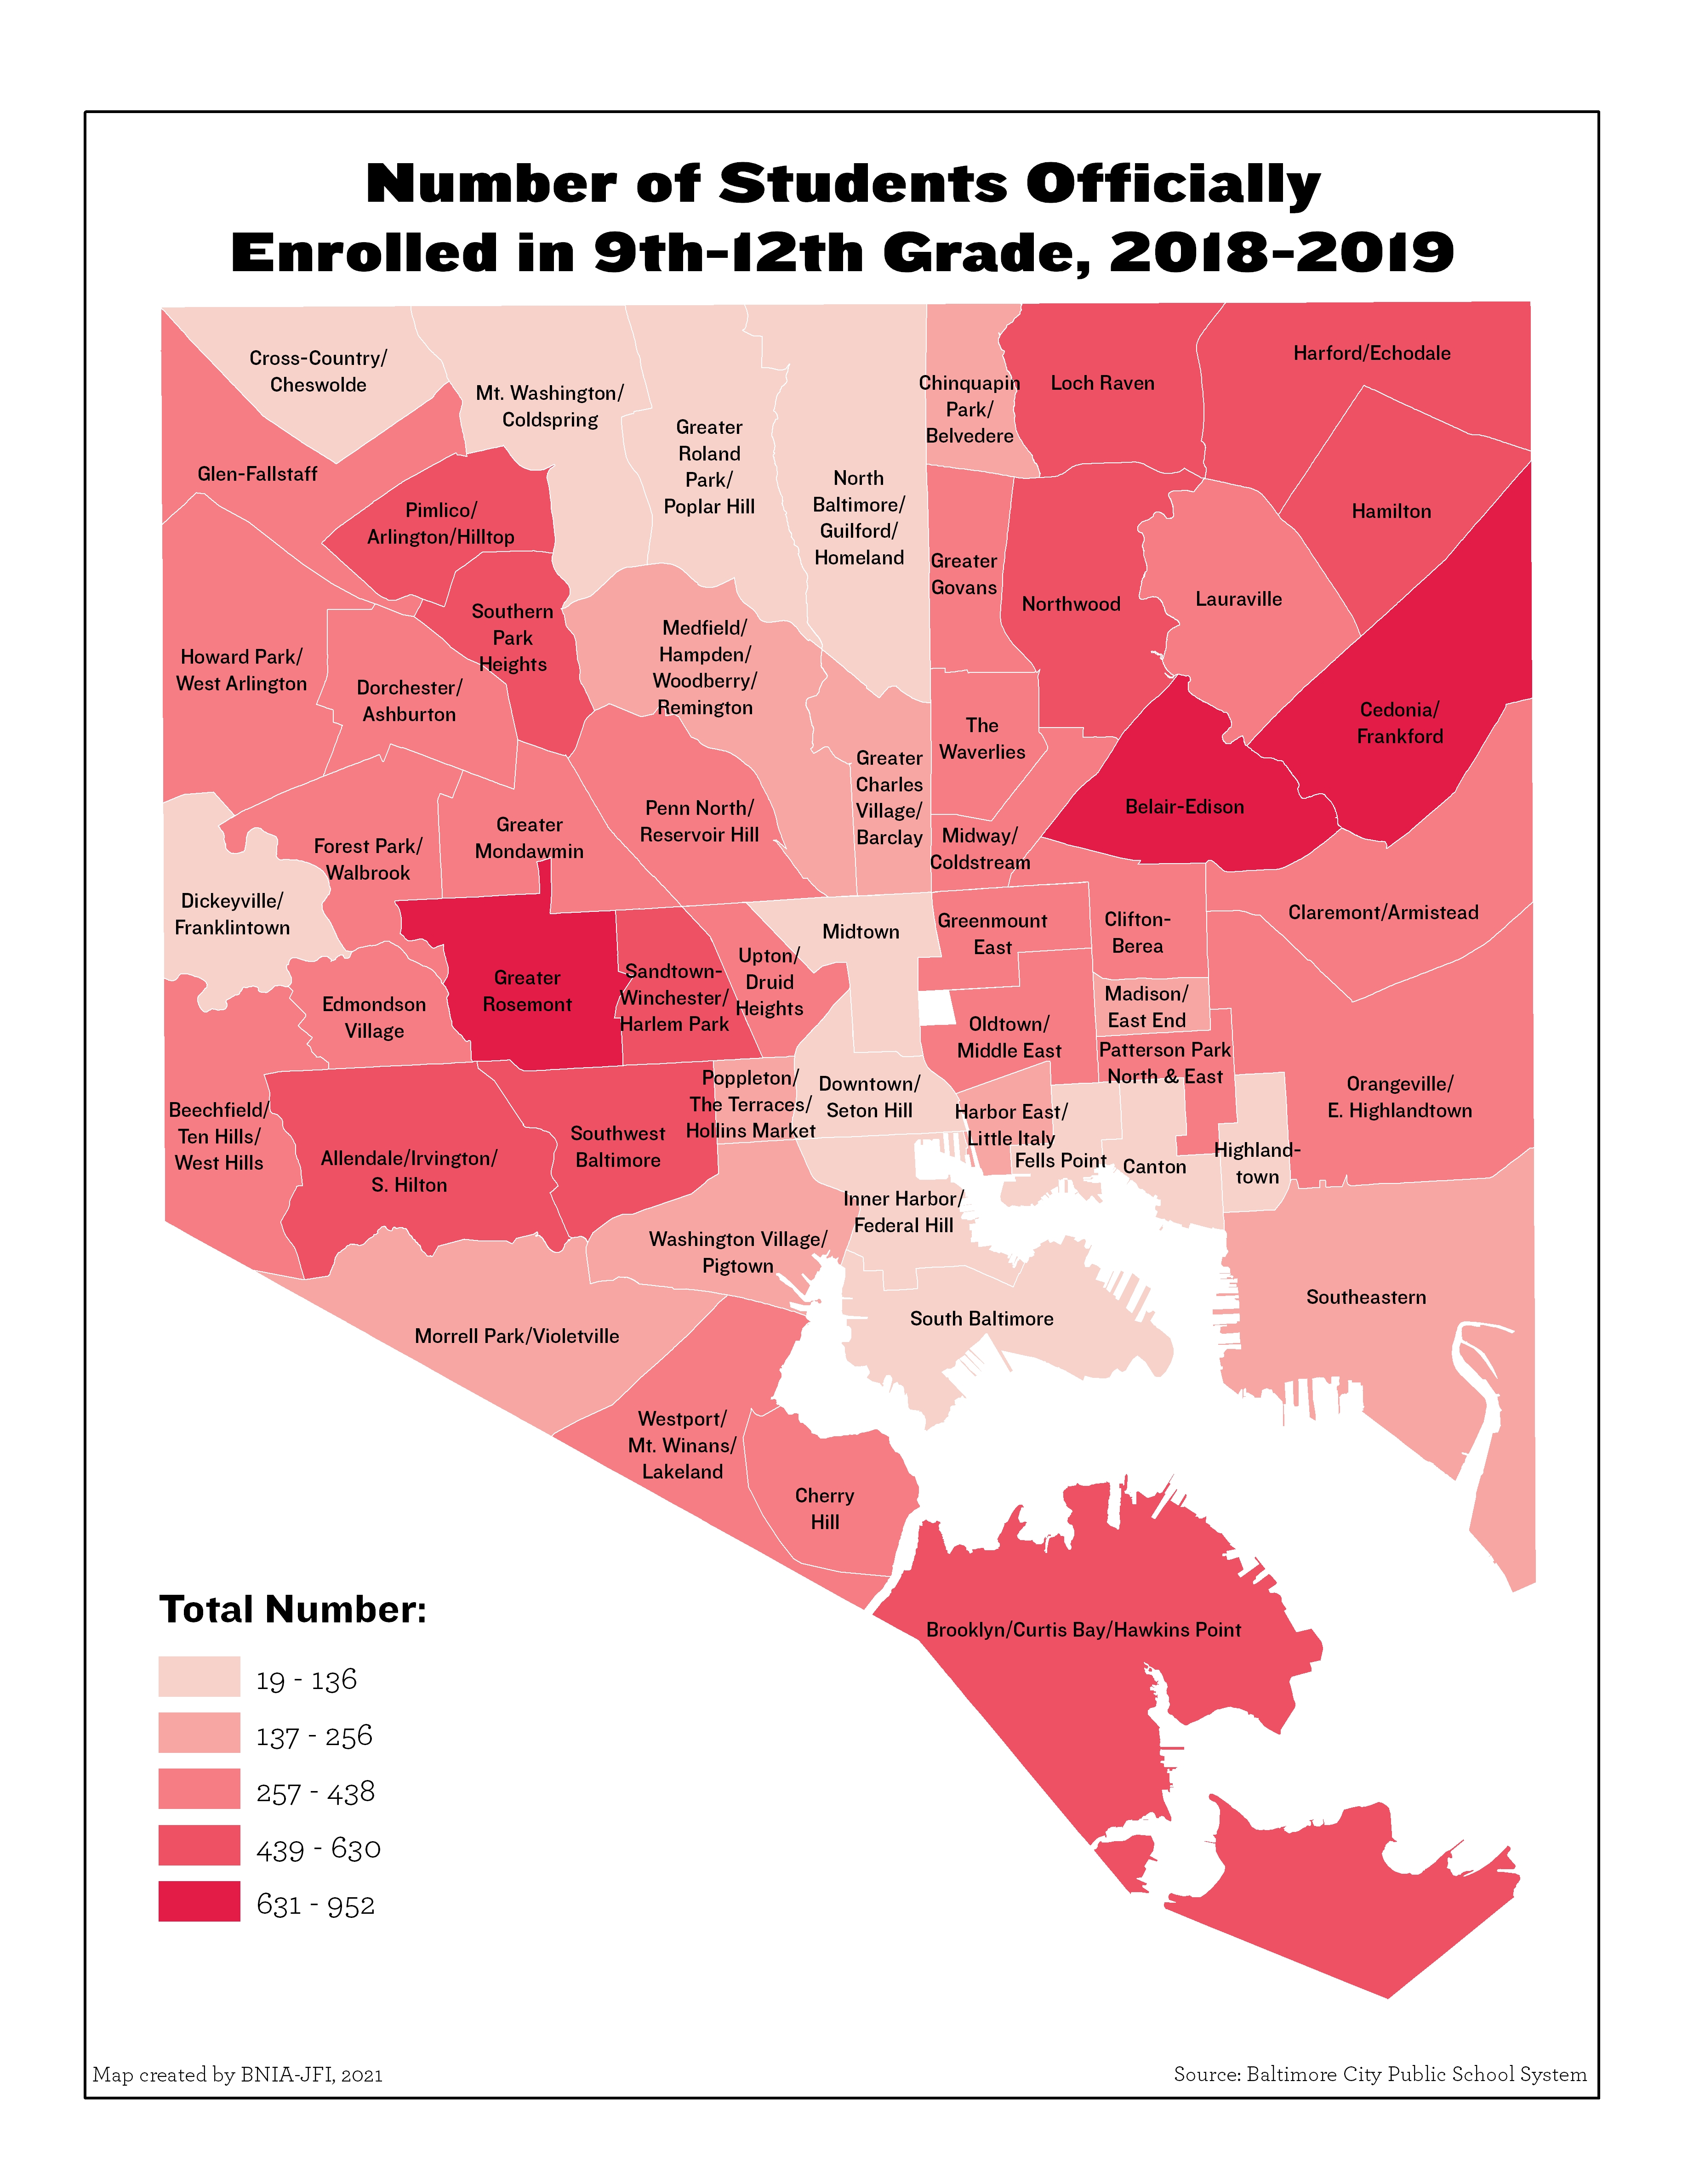
Number of Students Officially Enrolled in 9th-12th Grade (2018-2019)
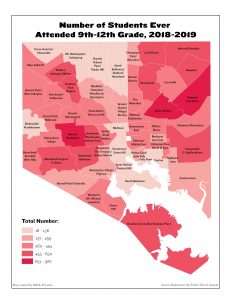
Number of Students Ever Attended 9th-12th Grade (2018-2019)
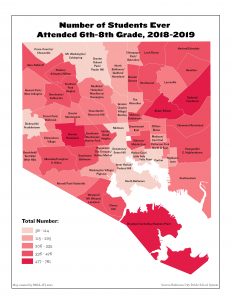
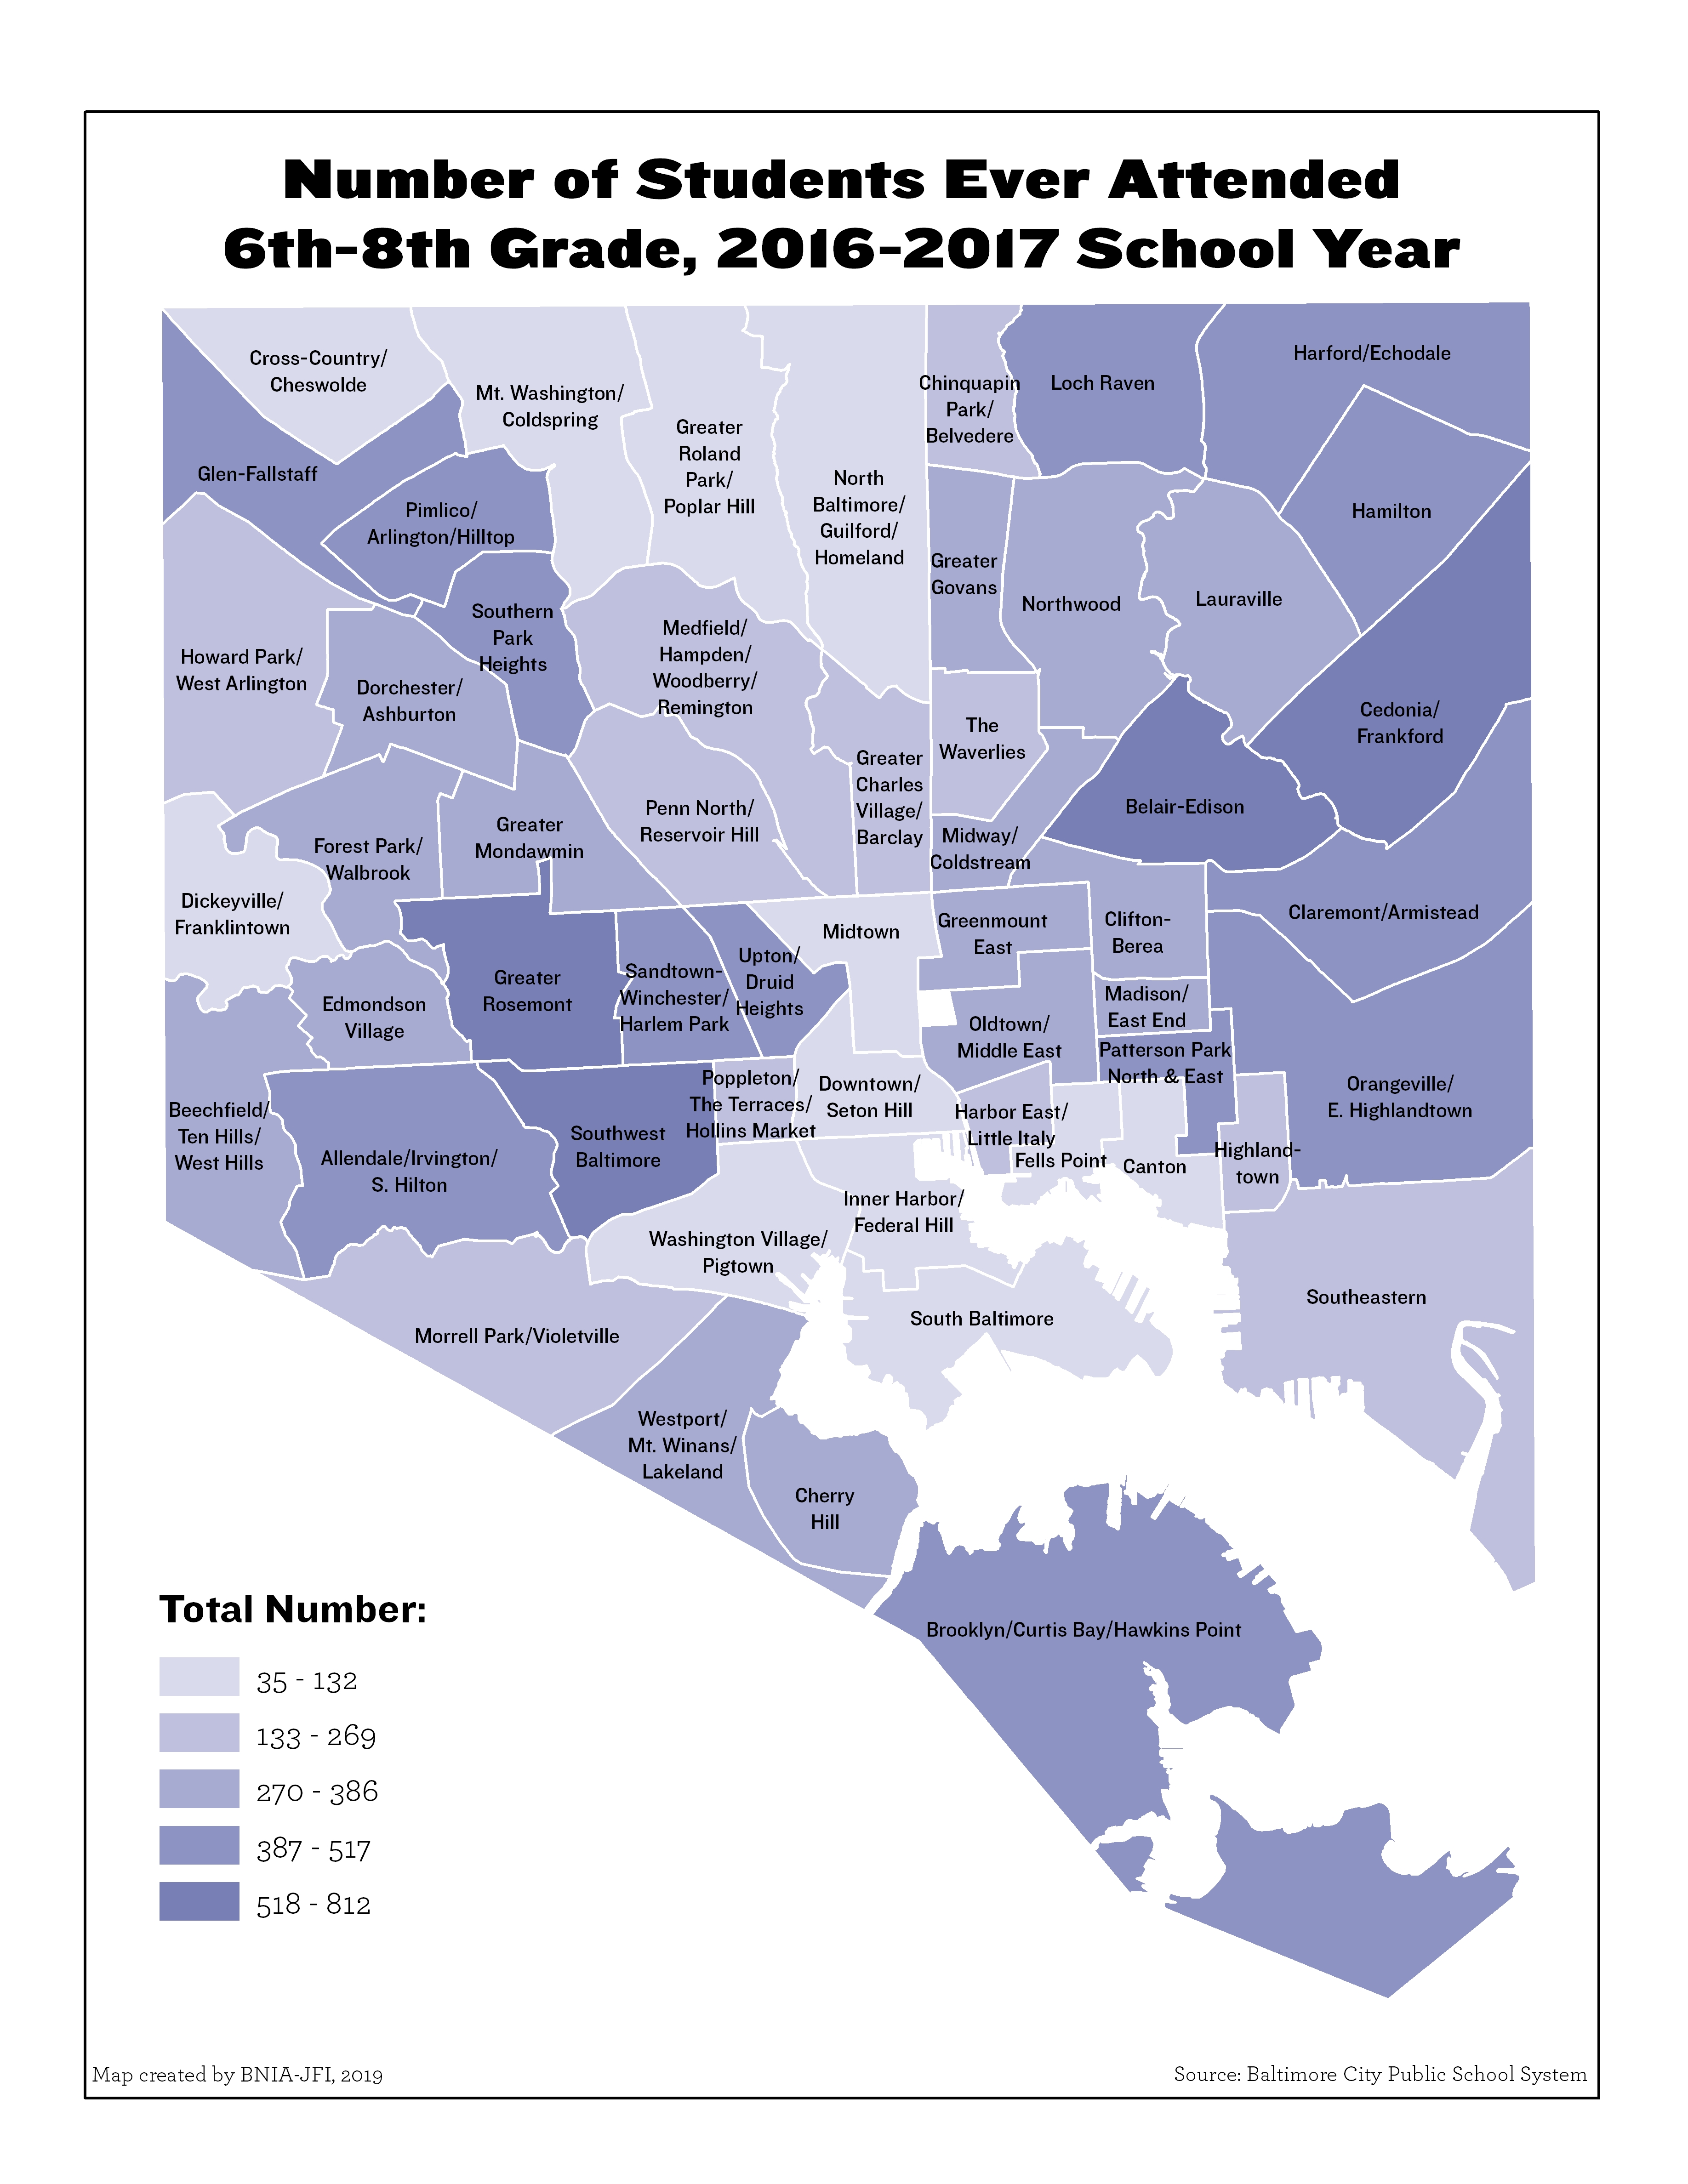
Number of Students Ever Attended 6th-8th Grade (2018-2019)
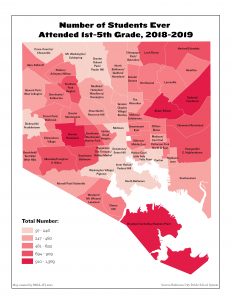
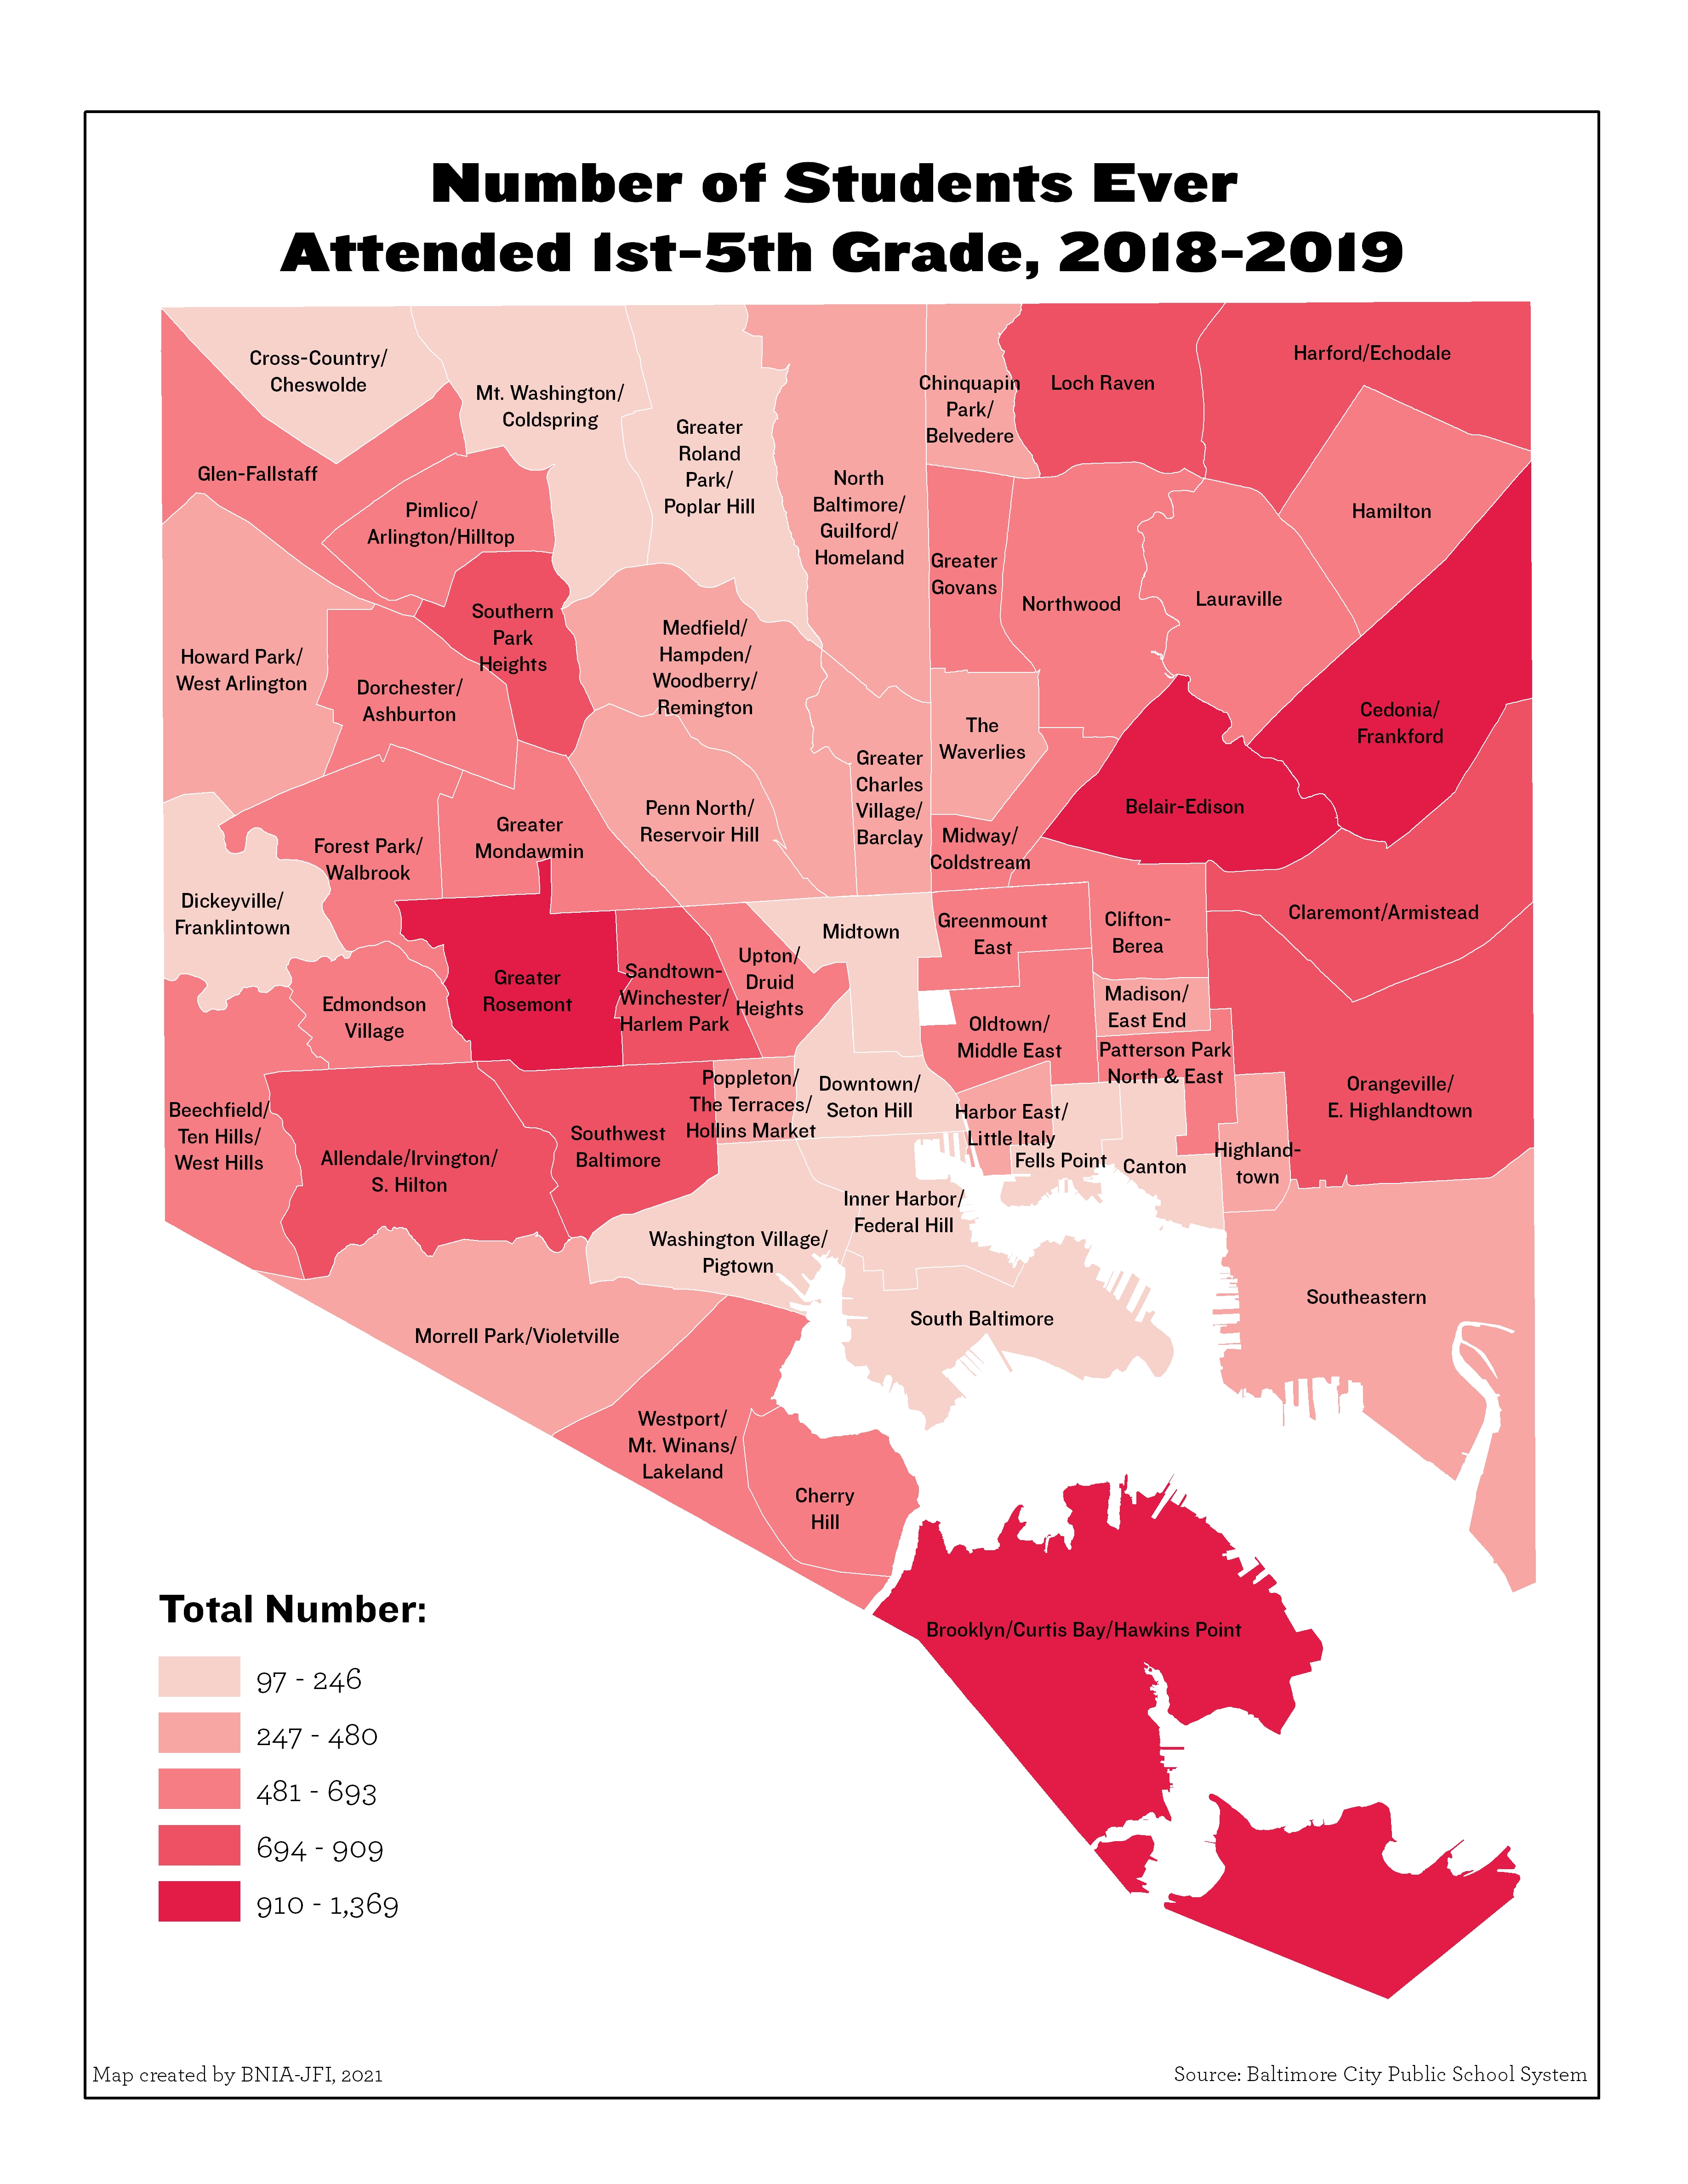
Number of Students Ever Attended 1st-5th Grade (2018-2019)
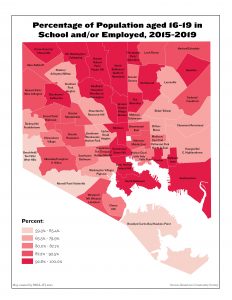
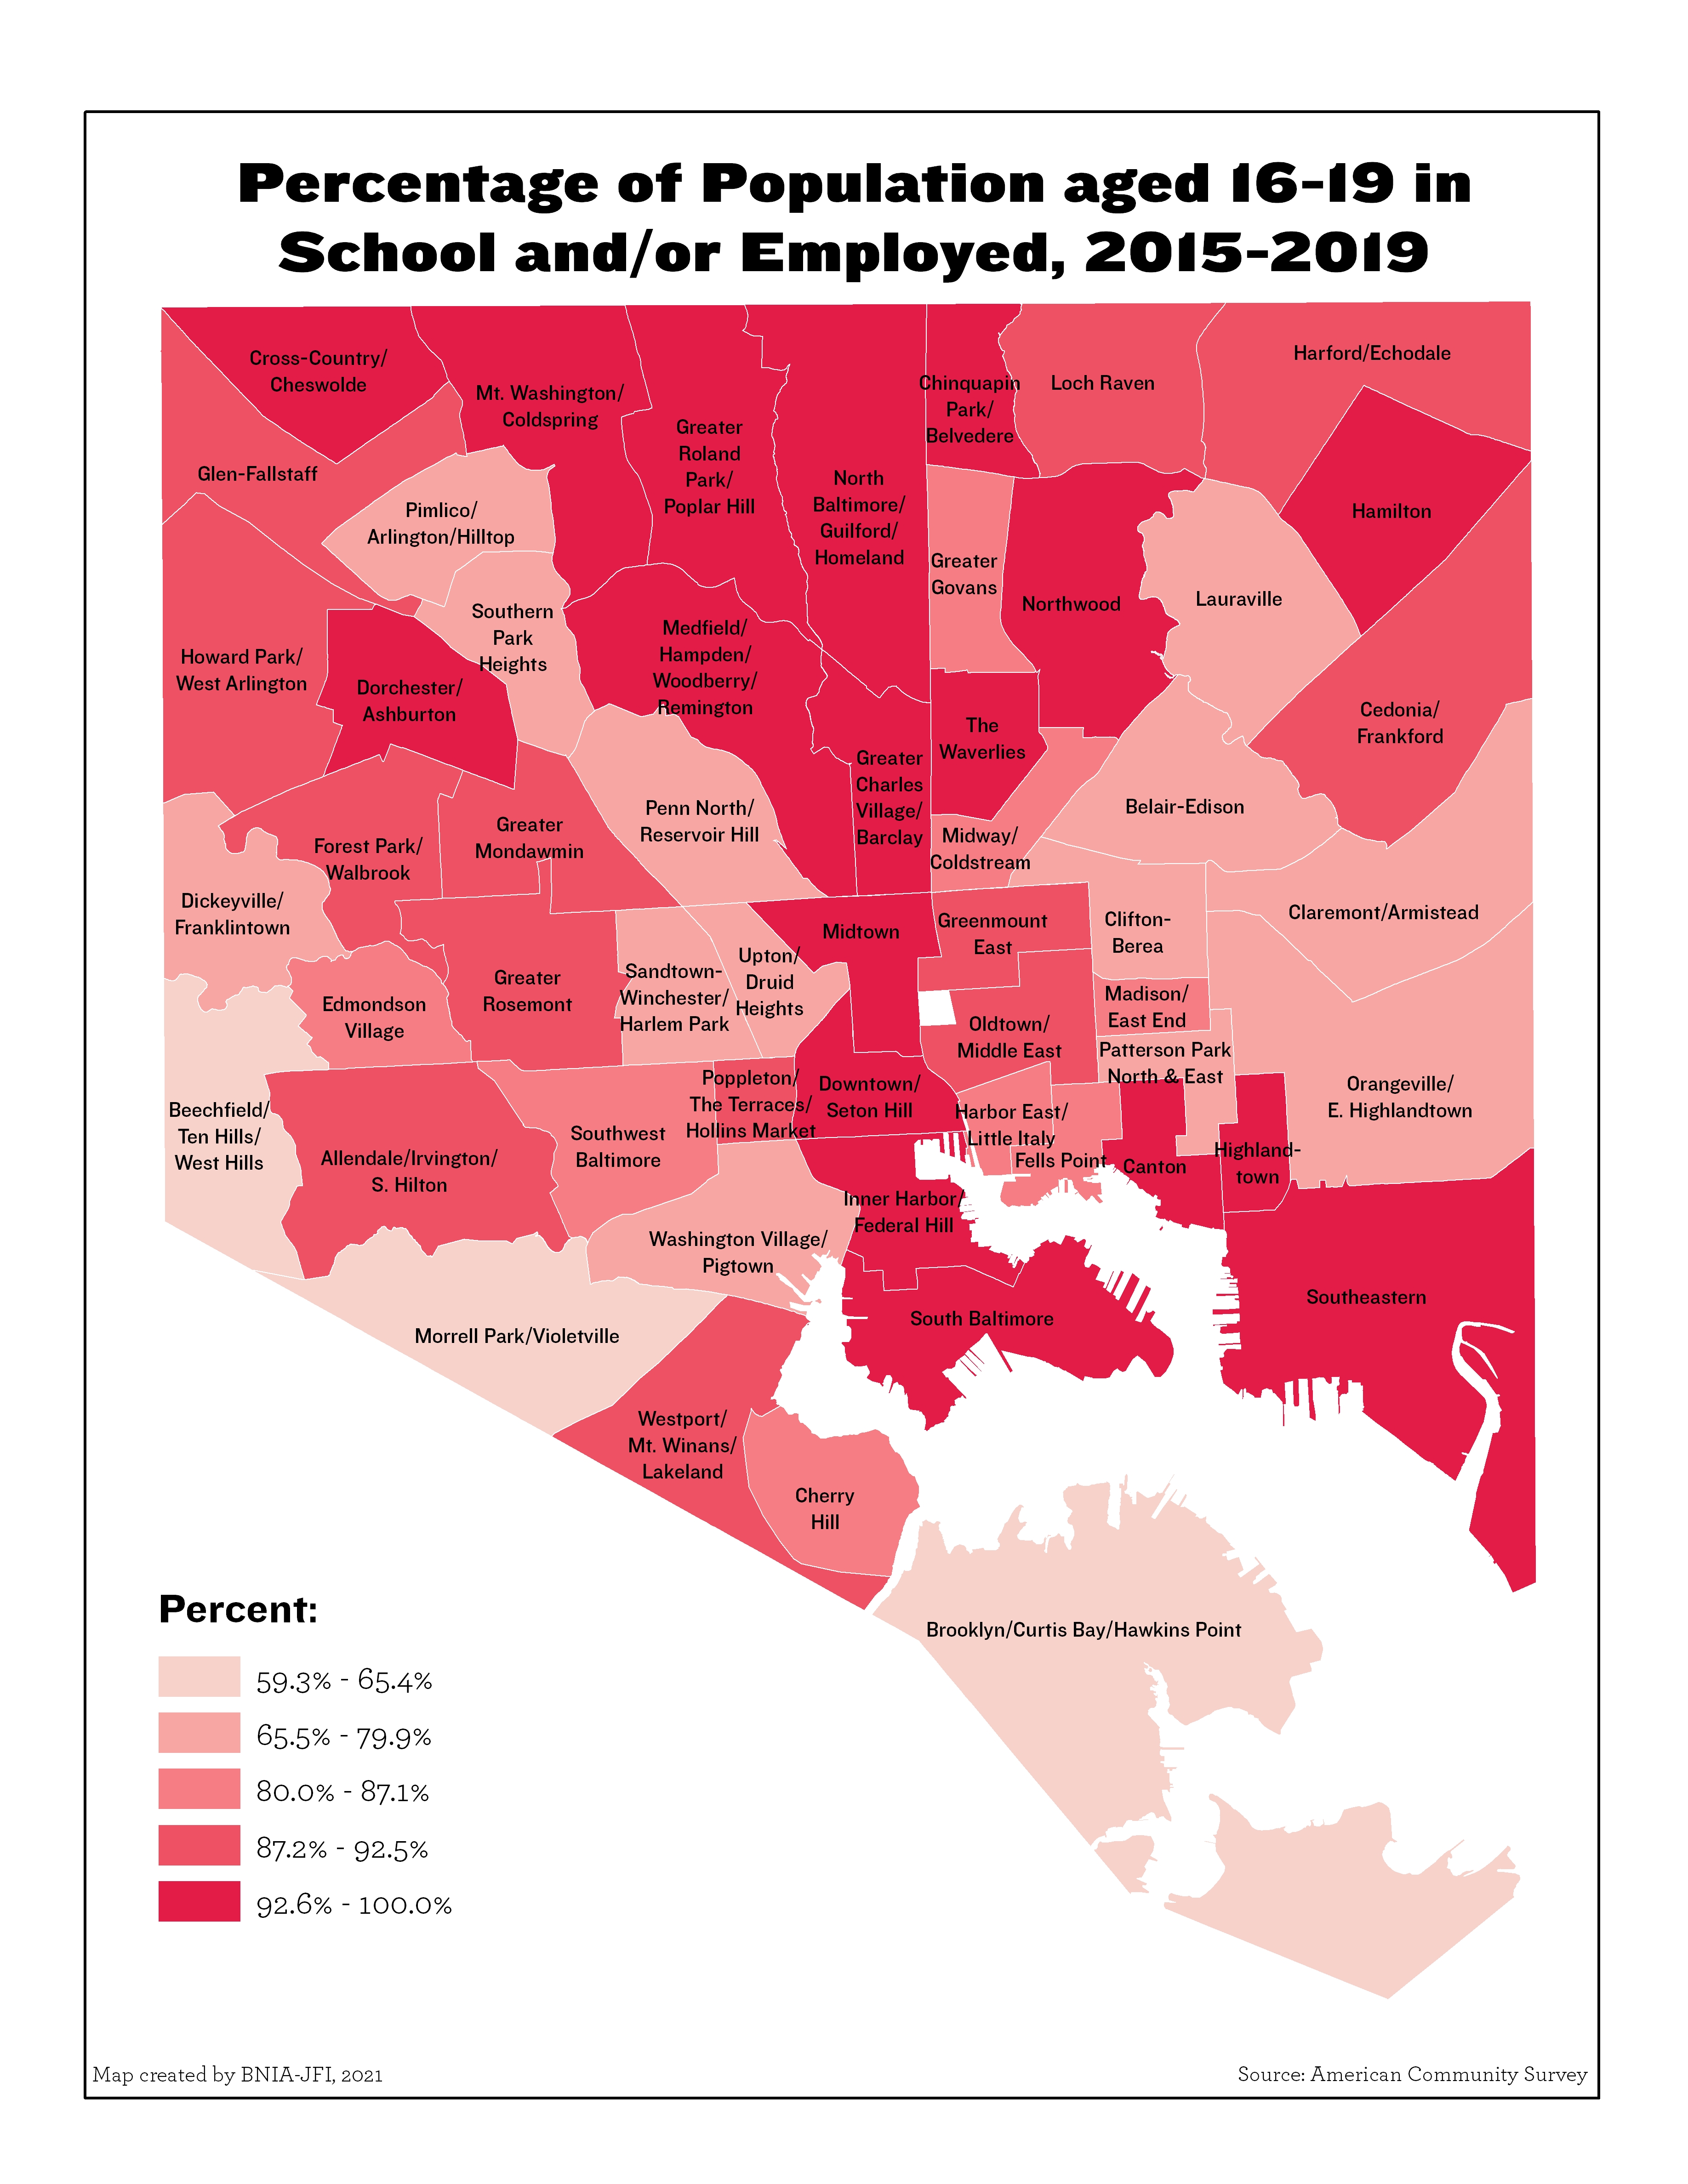
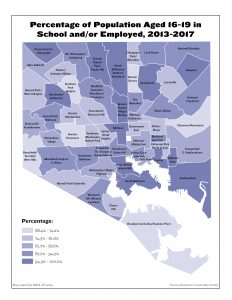
Percentage of Population aged 16-19 in School and/or Employed
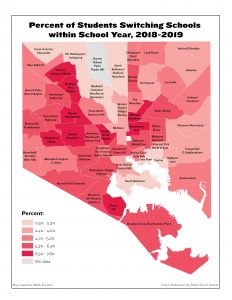
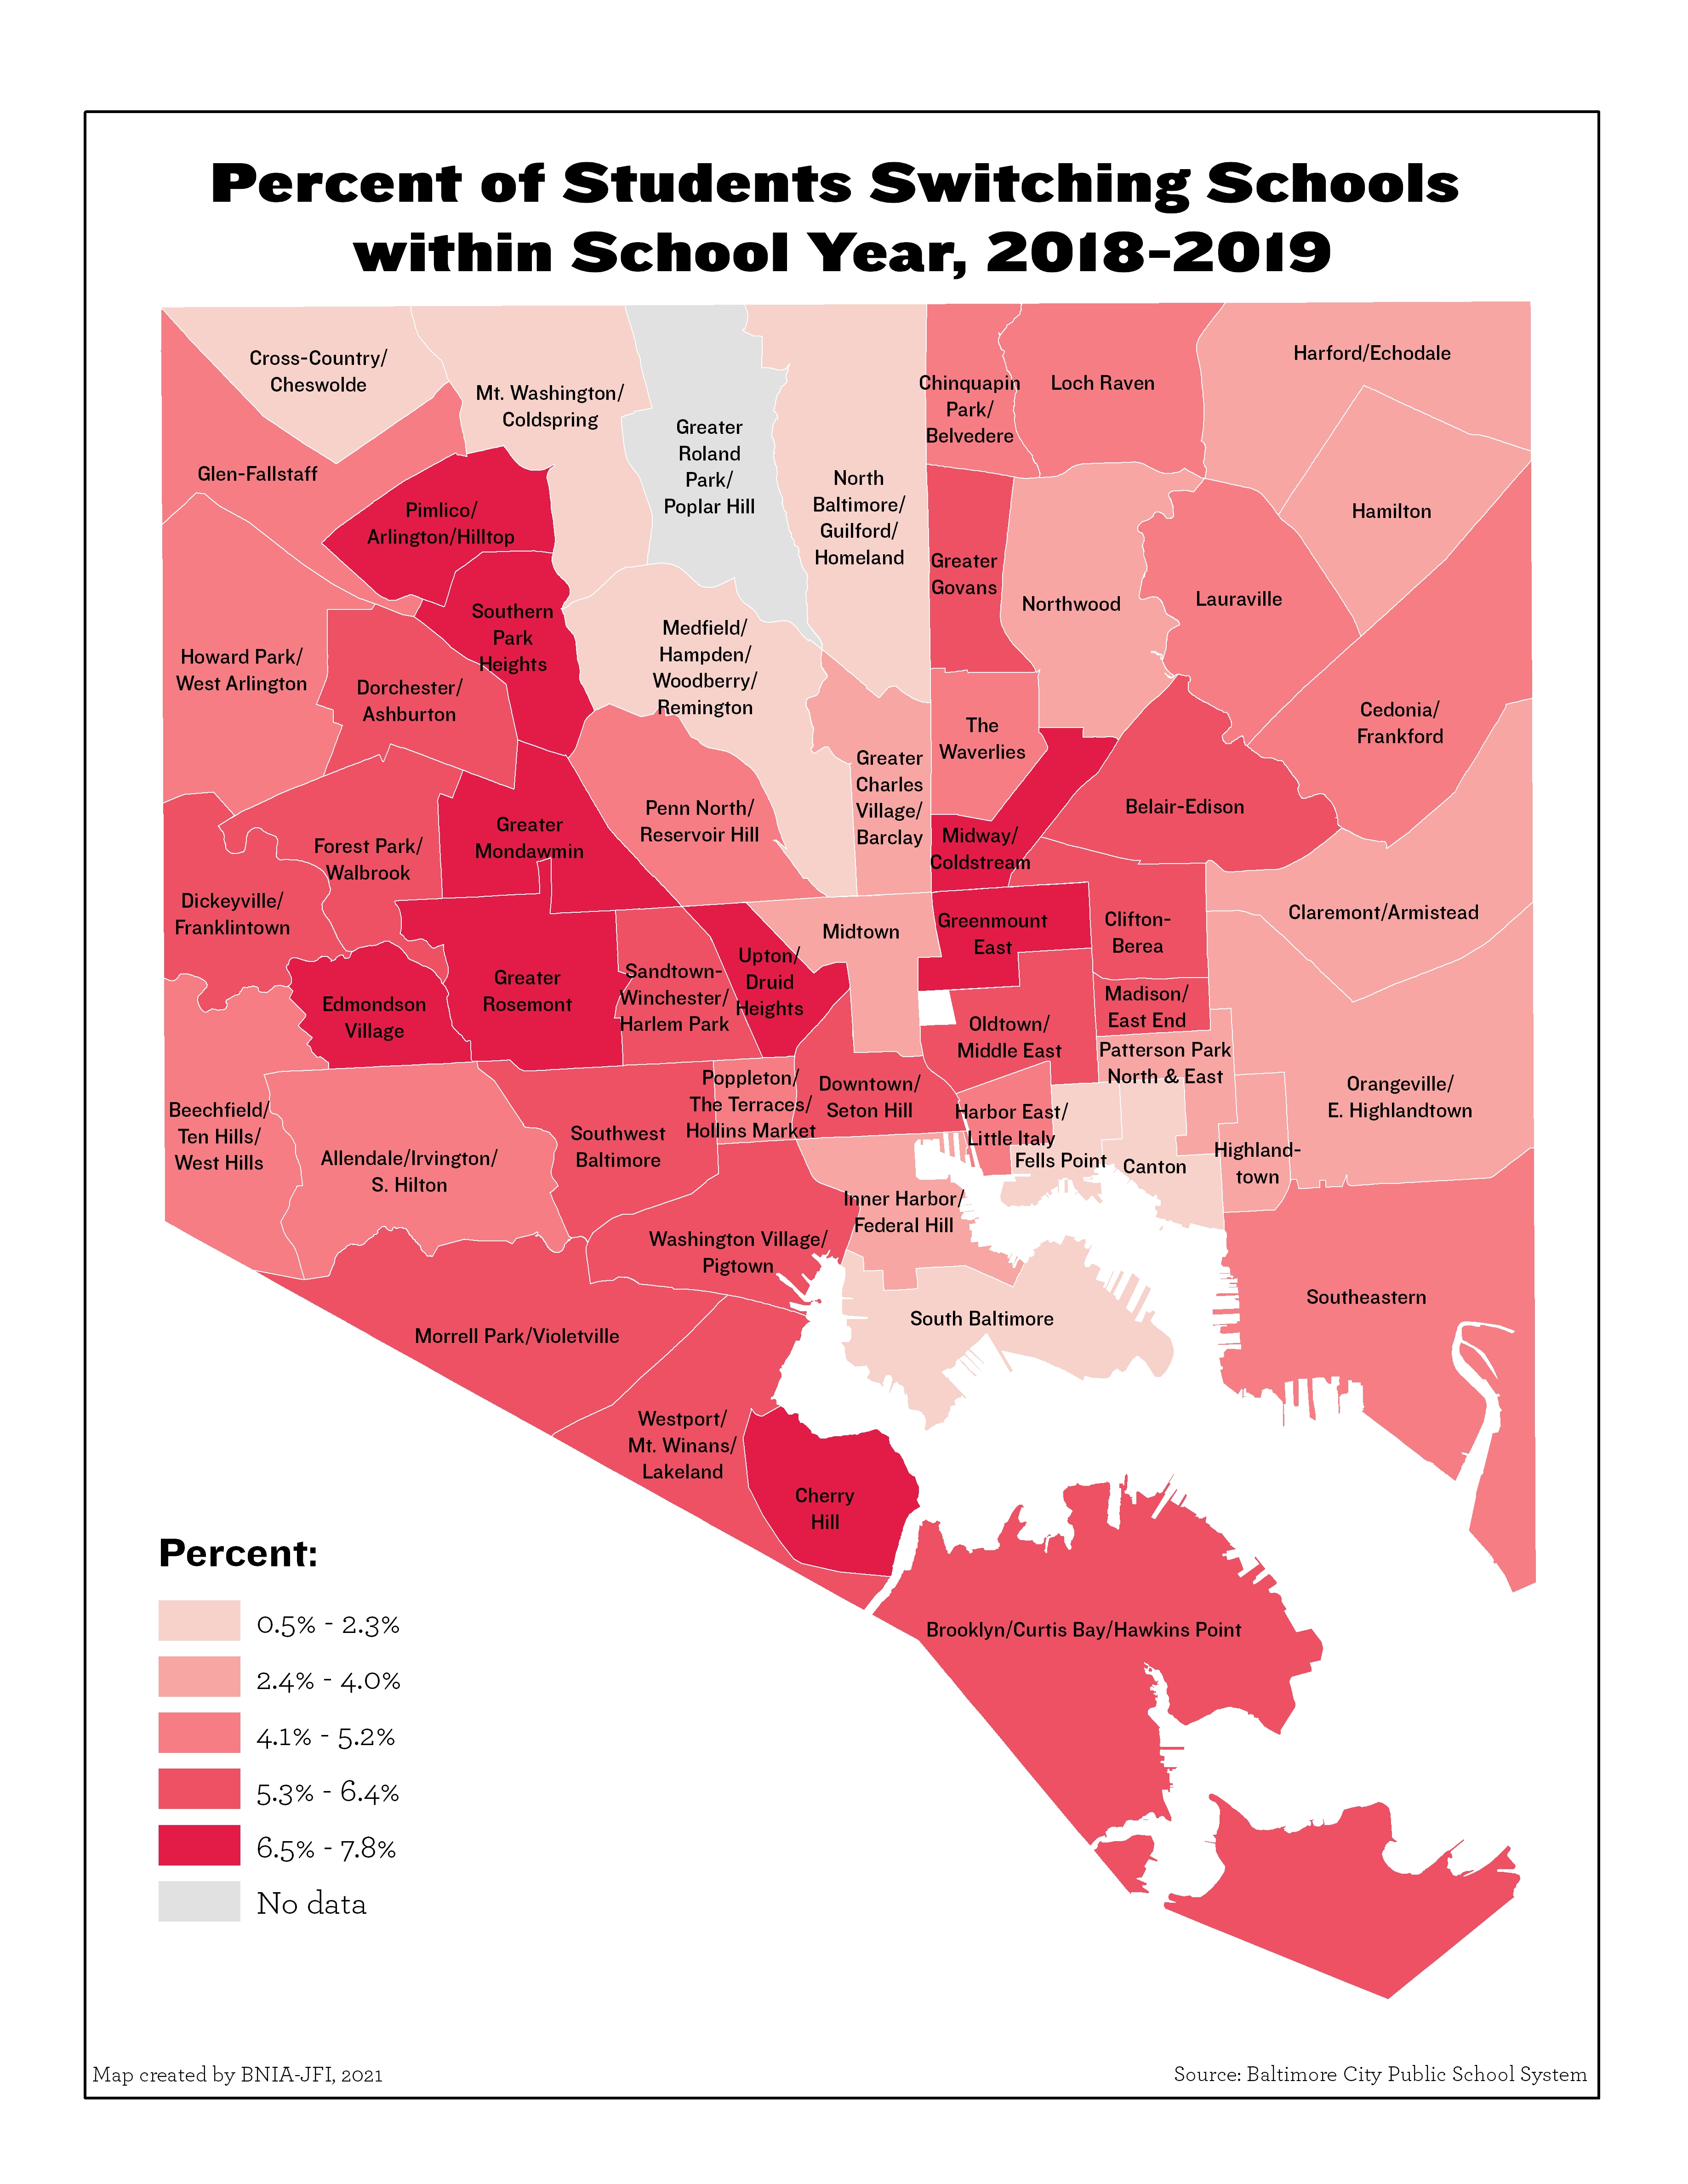
Percent of Students Switching Schools within School Year (2018-2019)
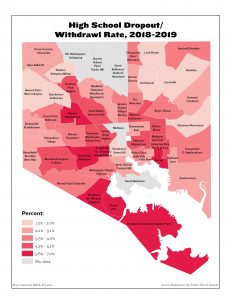
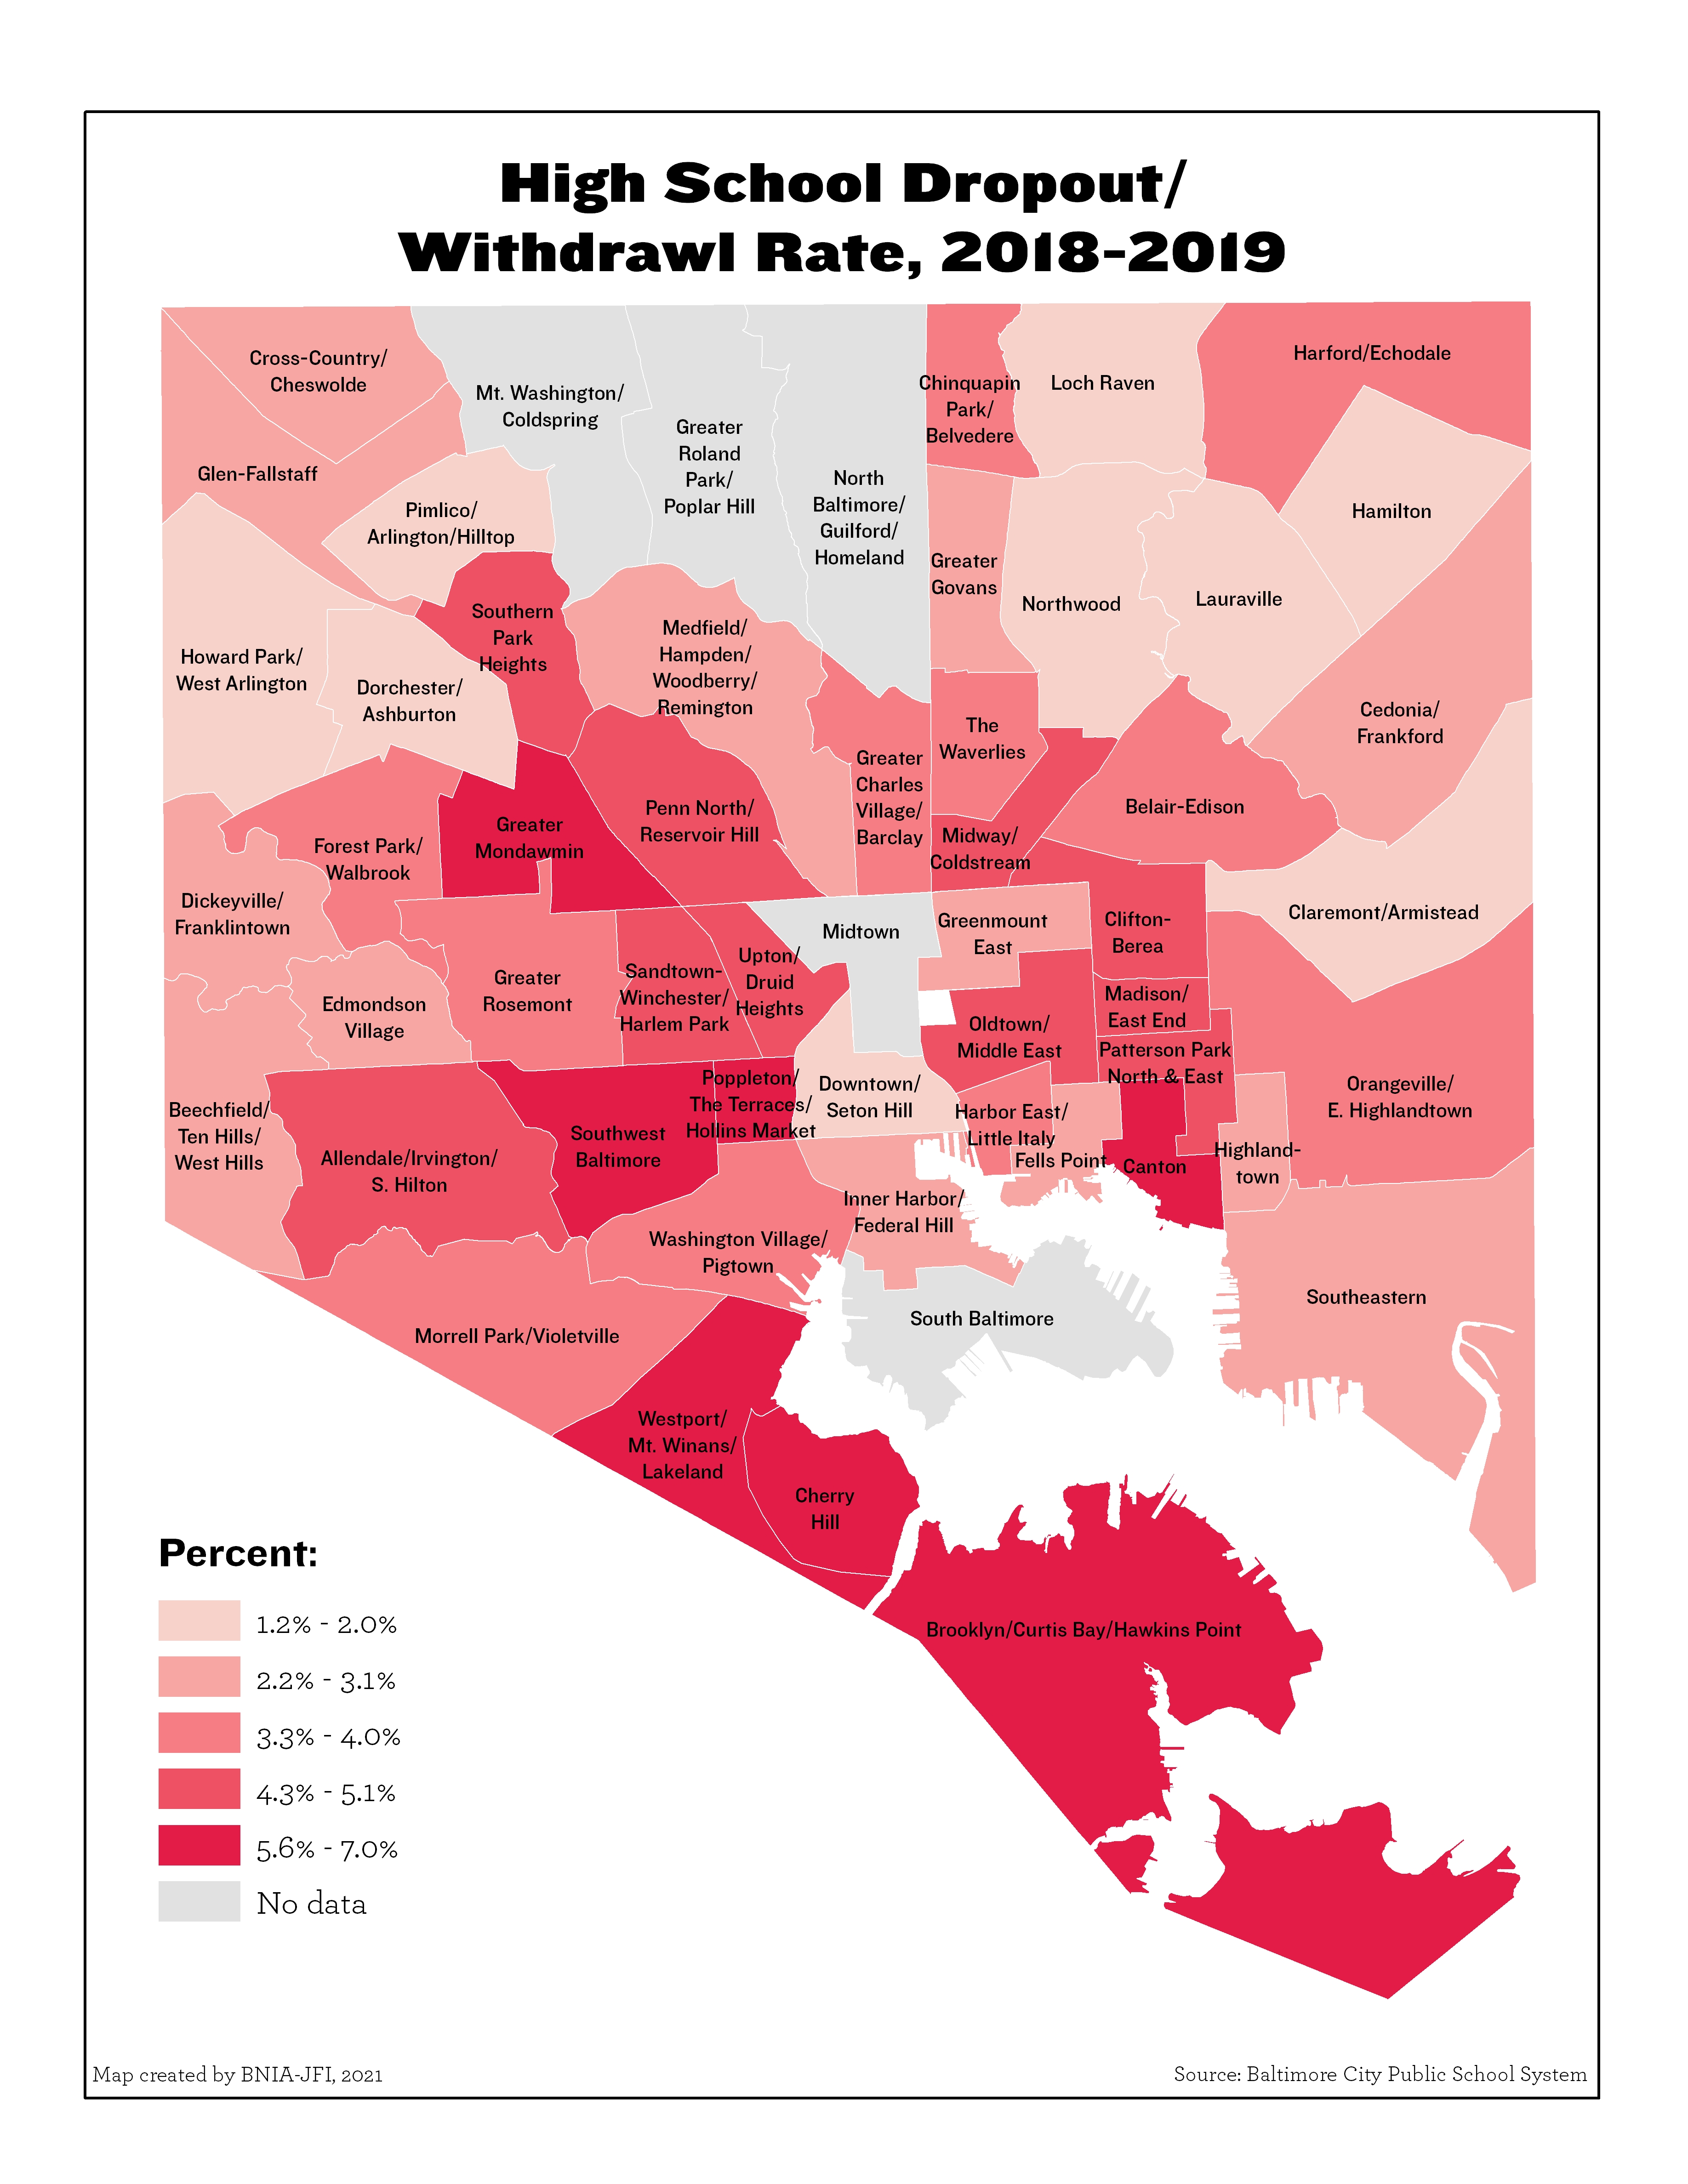
High School Dropout/Withdrawl Rate (2018-2019)
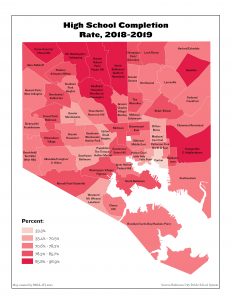
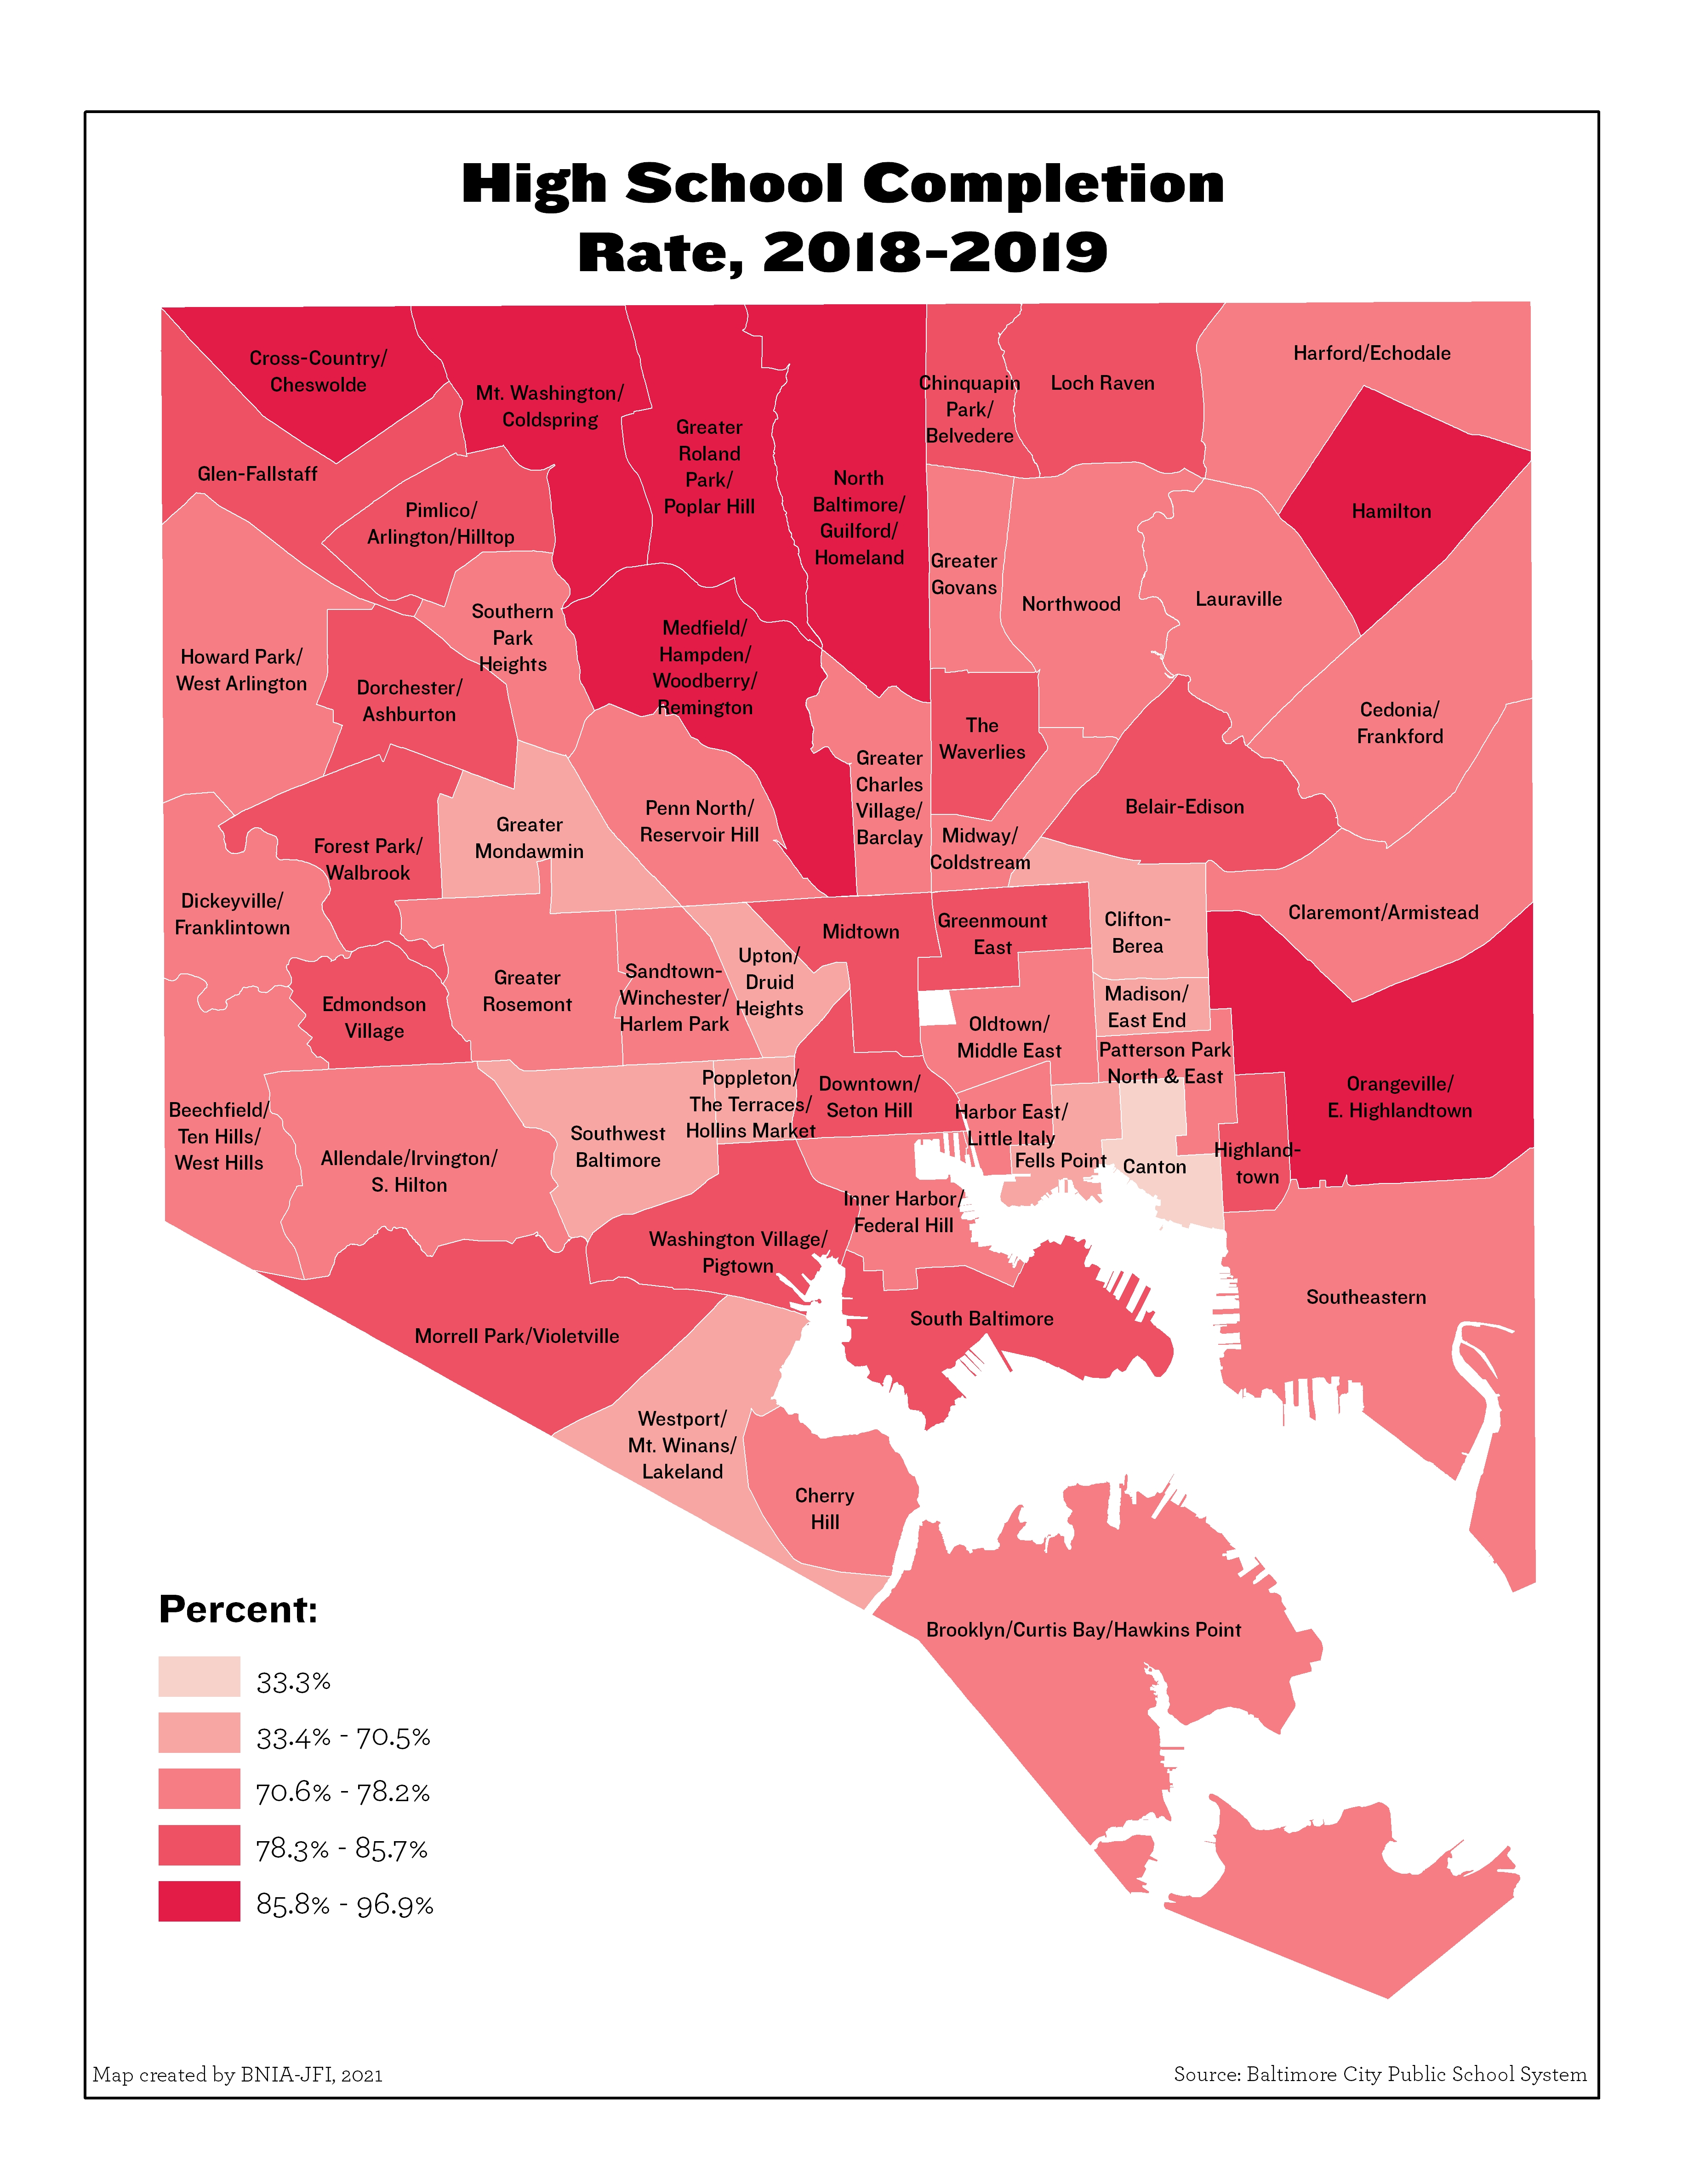
High School Completion Rate (2018-2019)
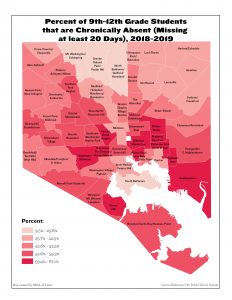
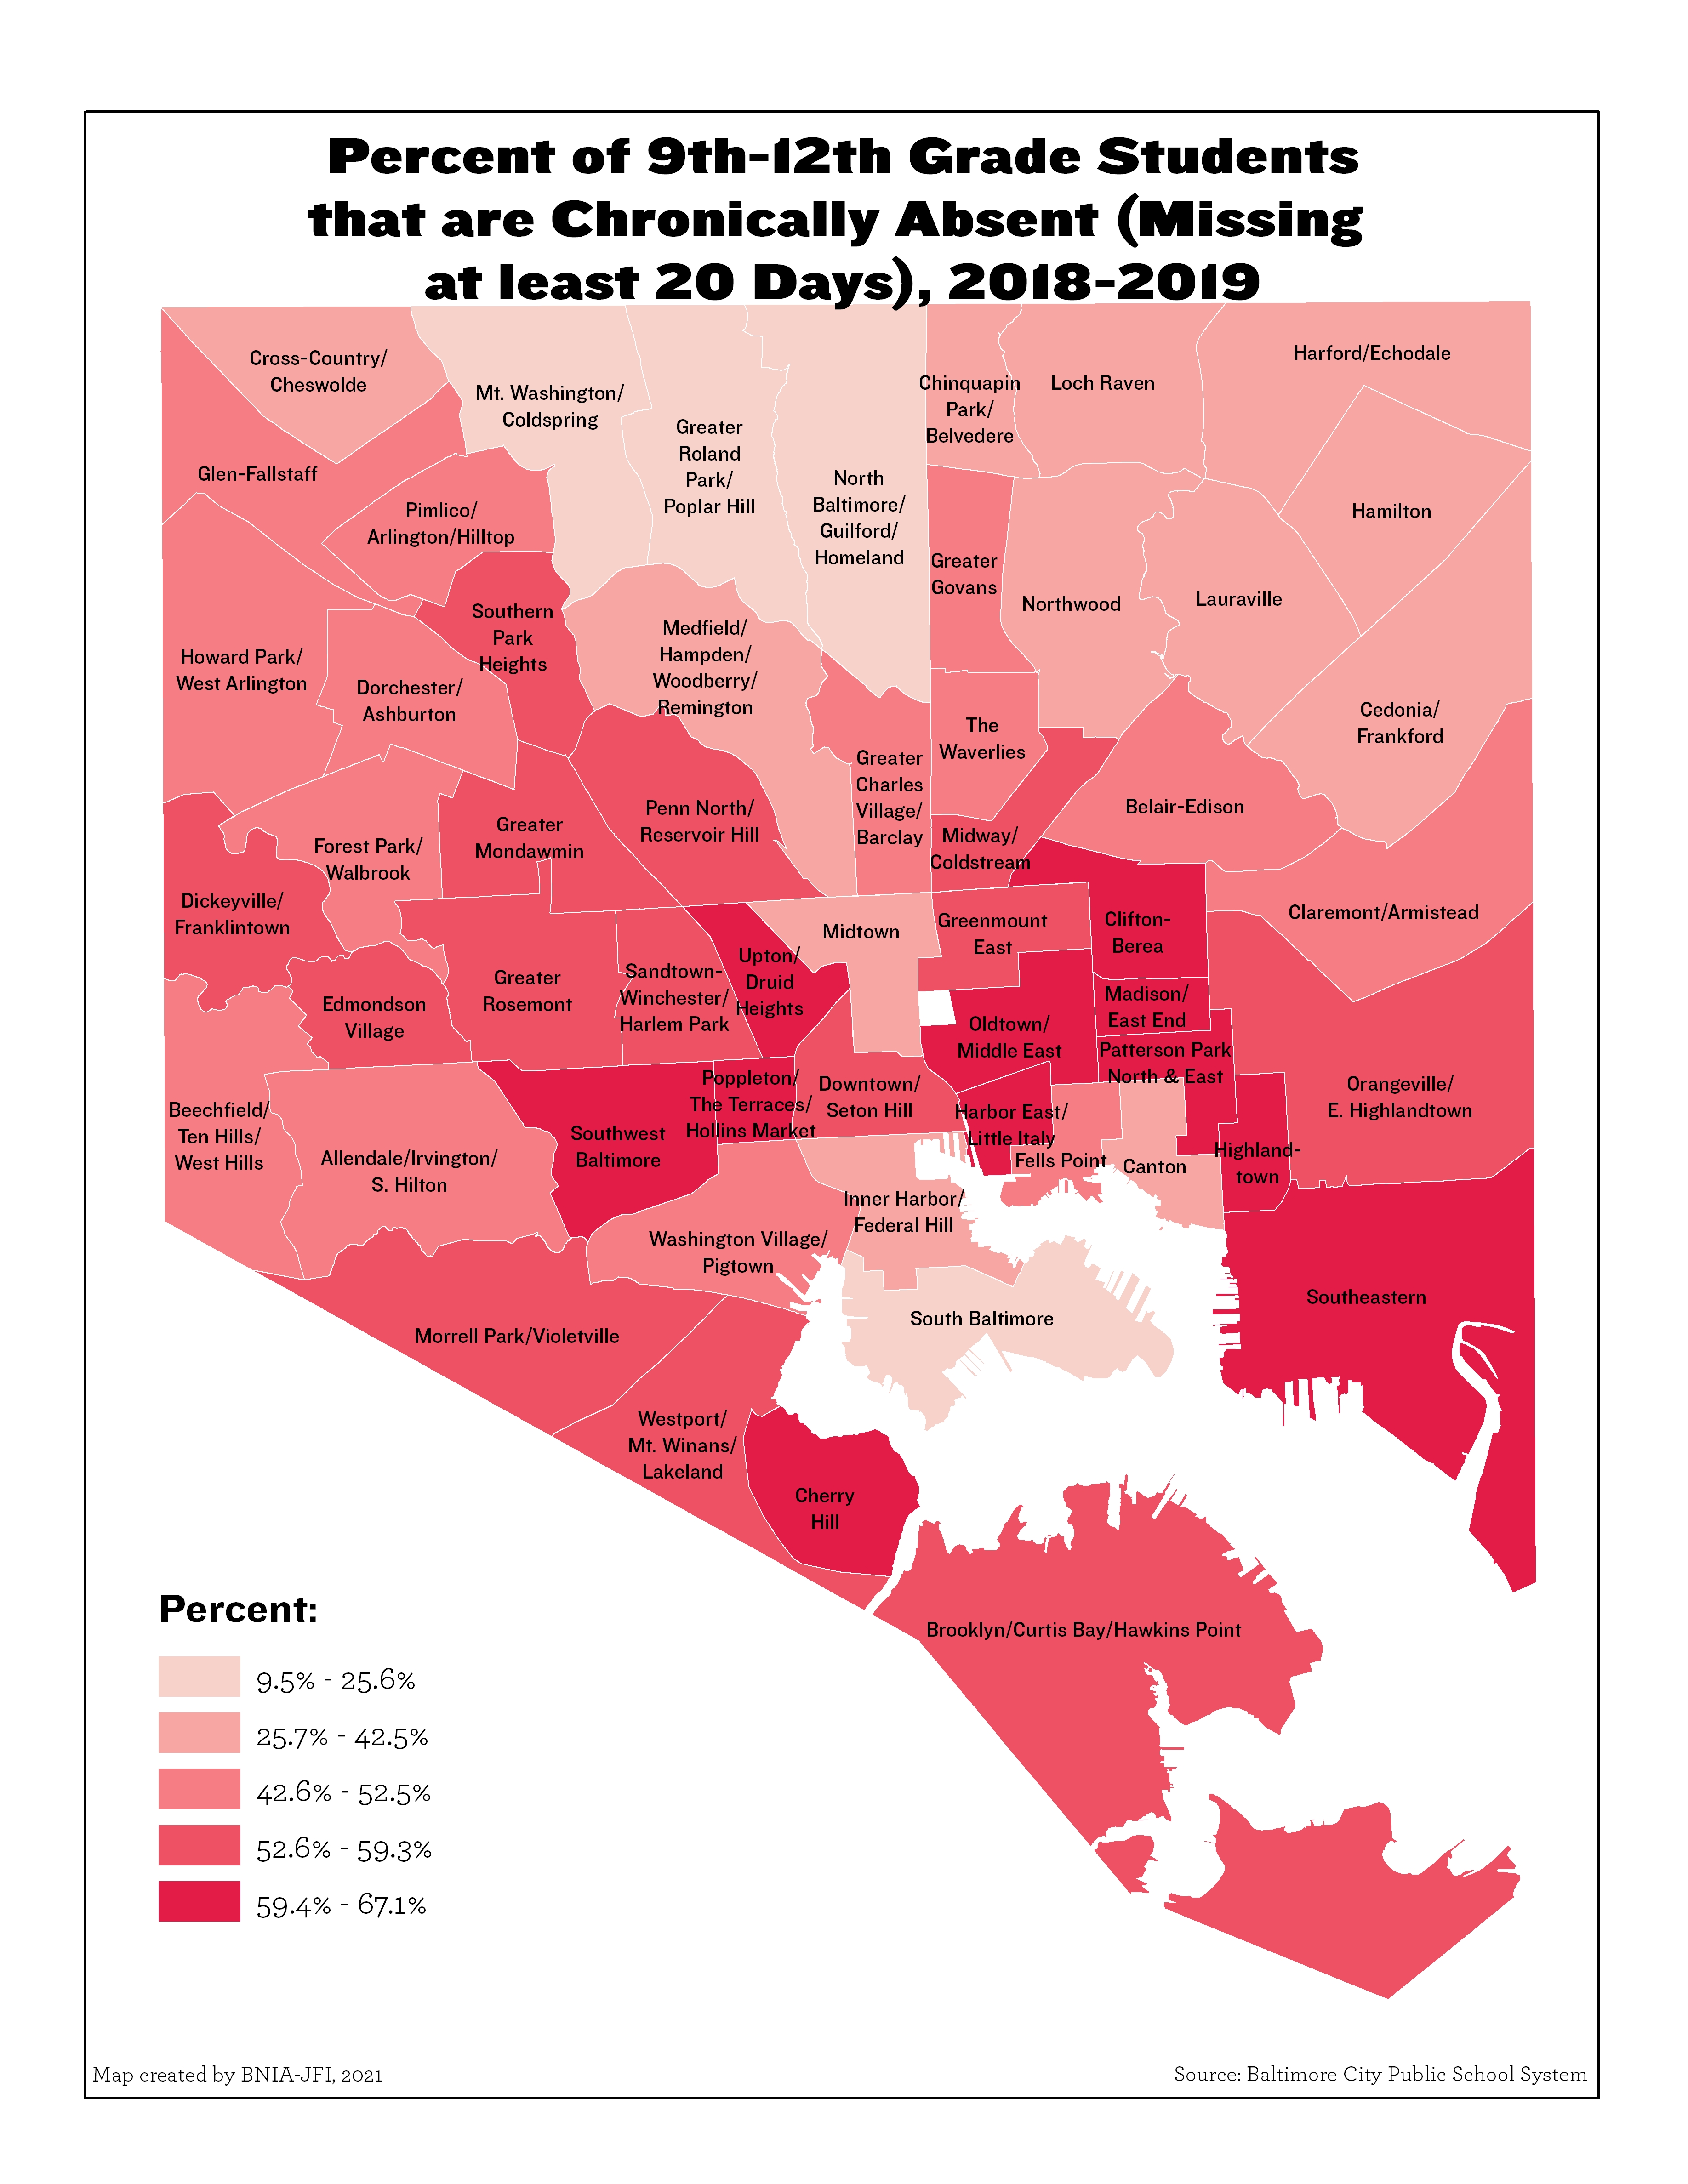
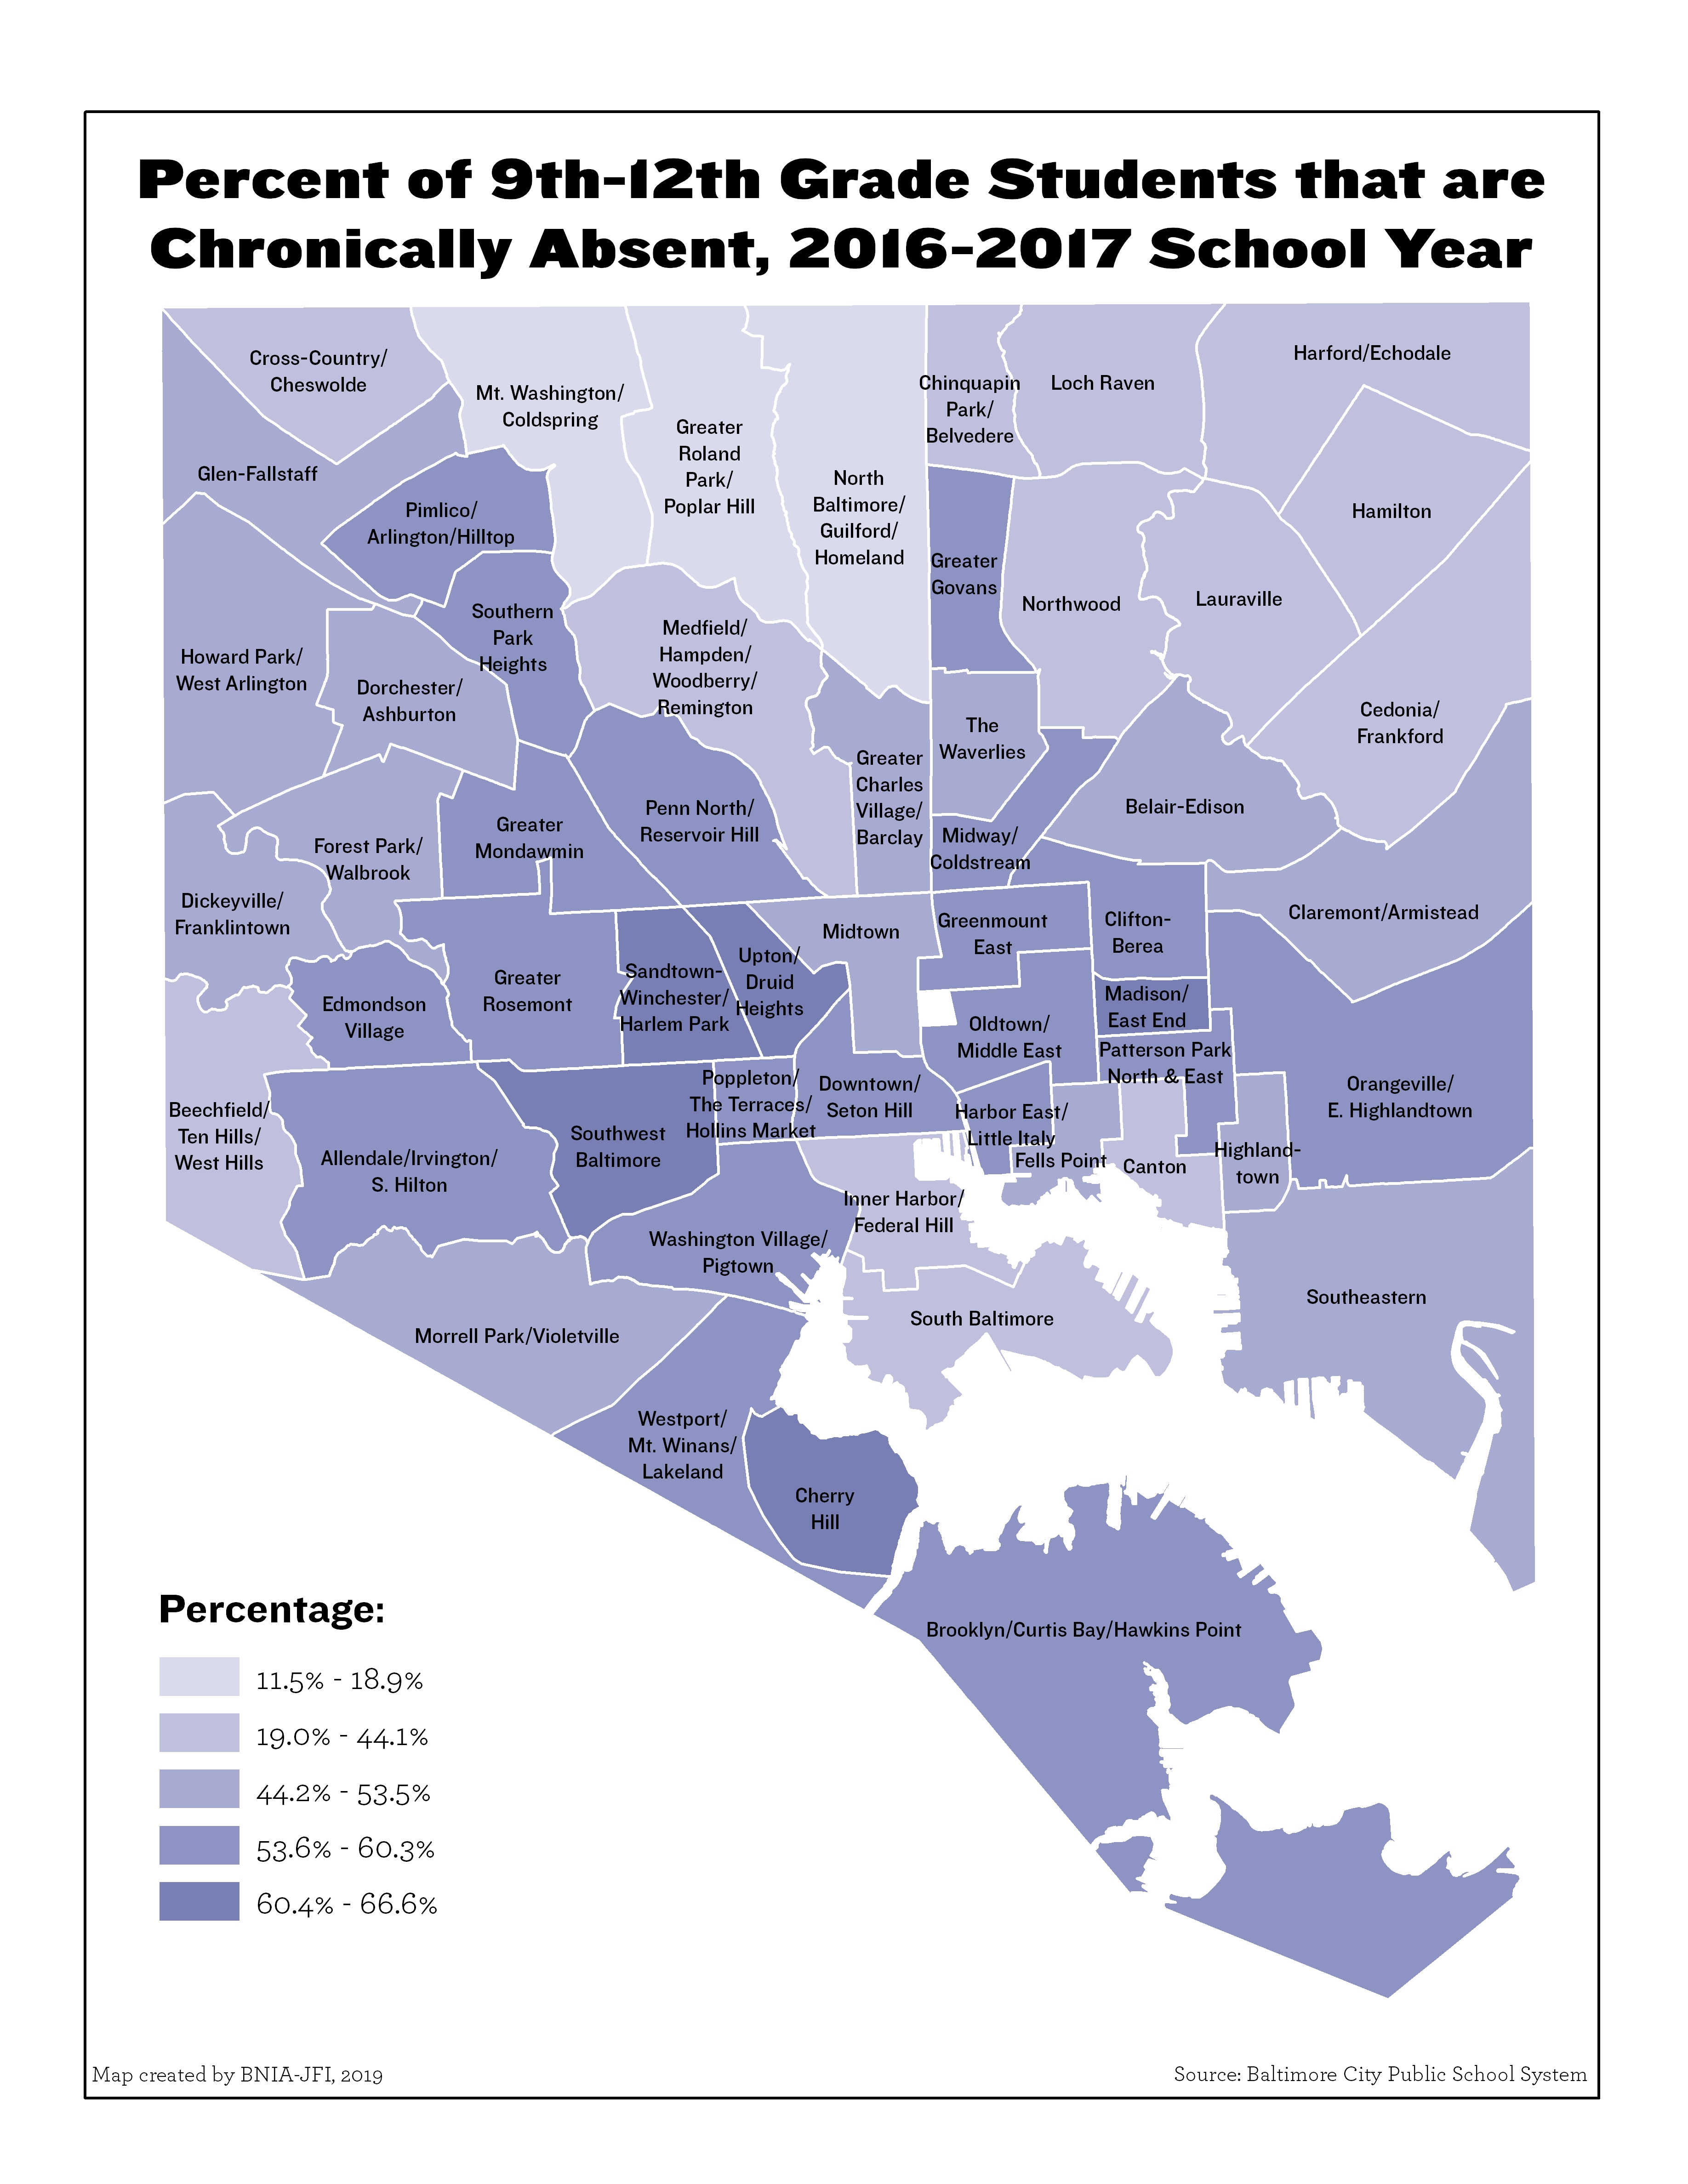
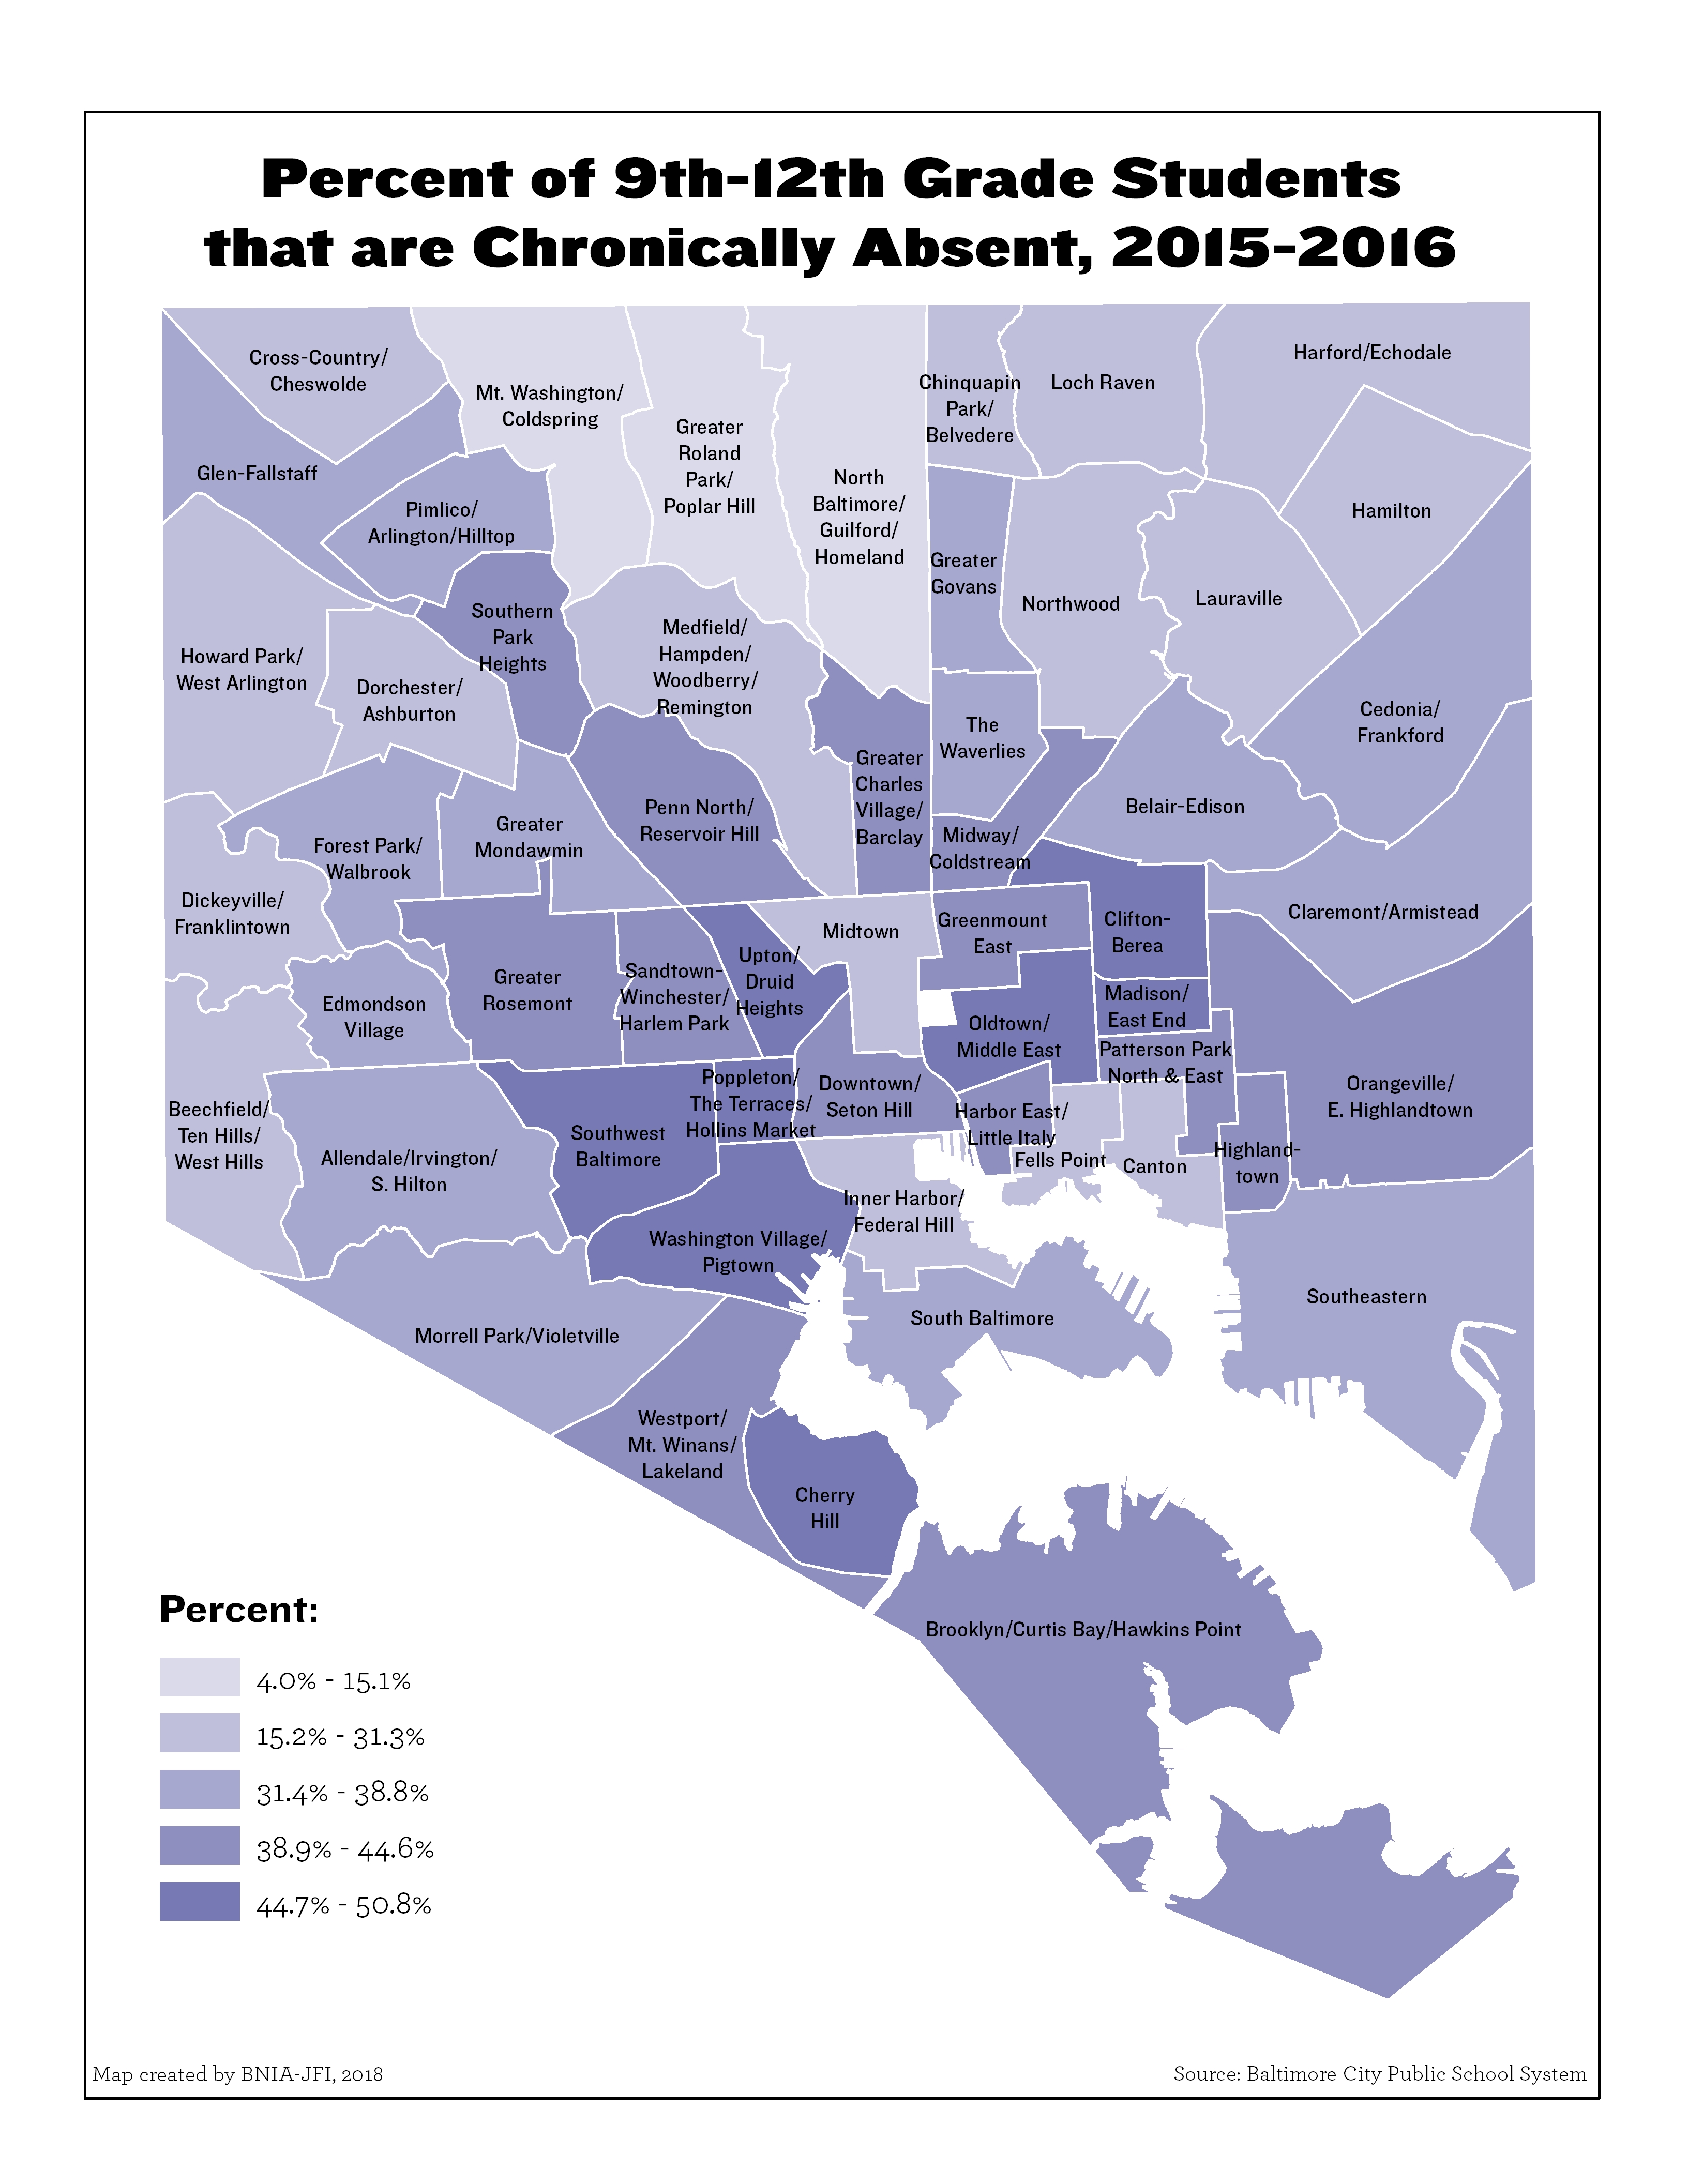
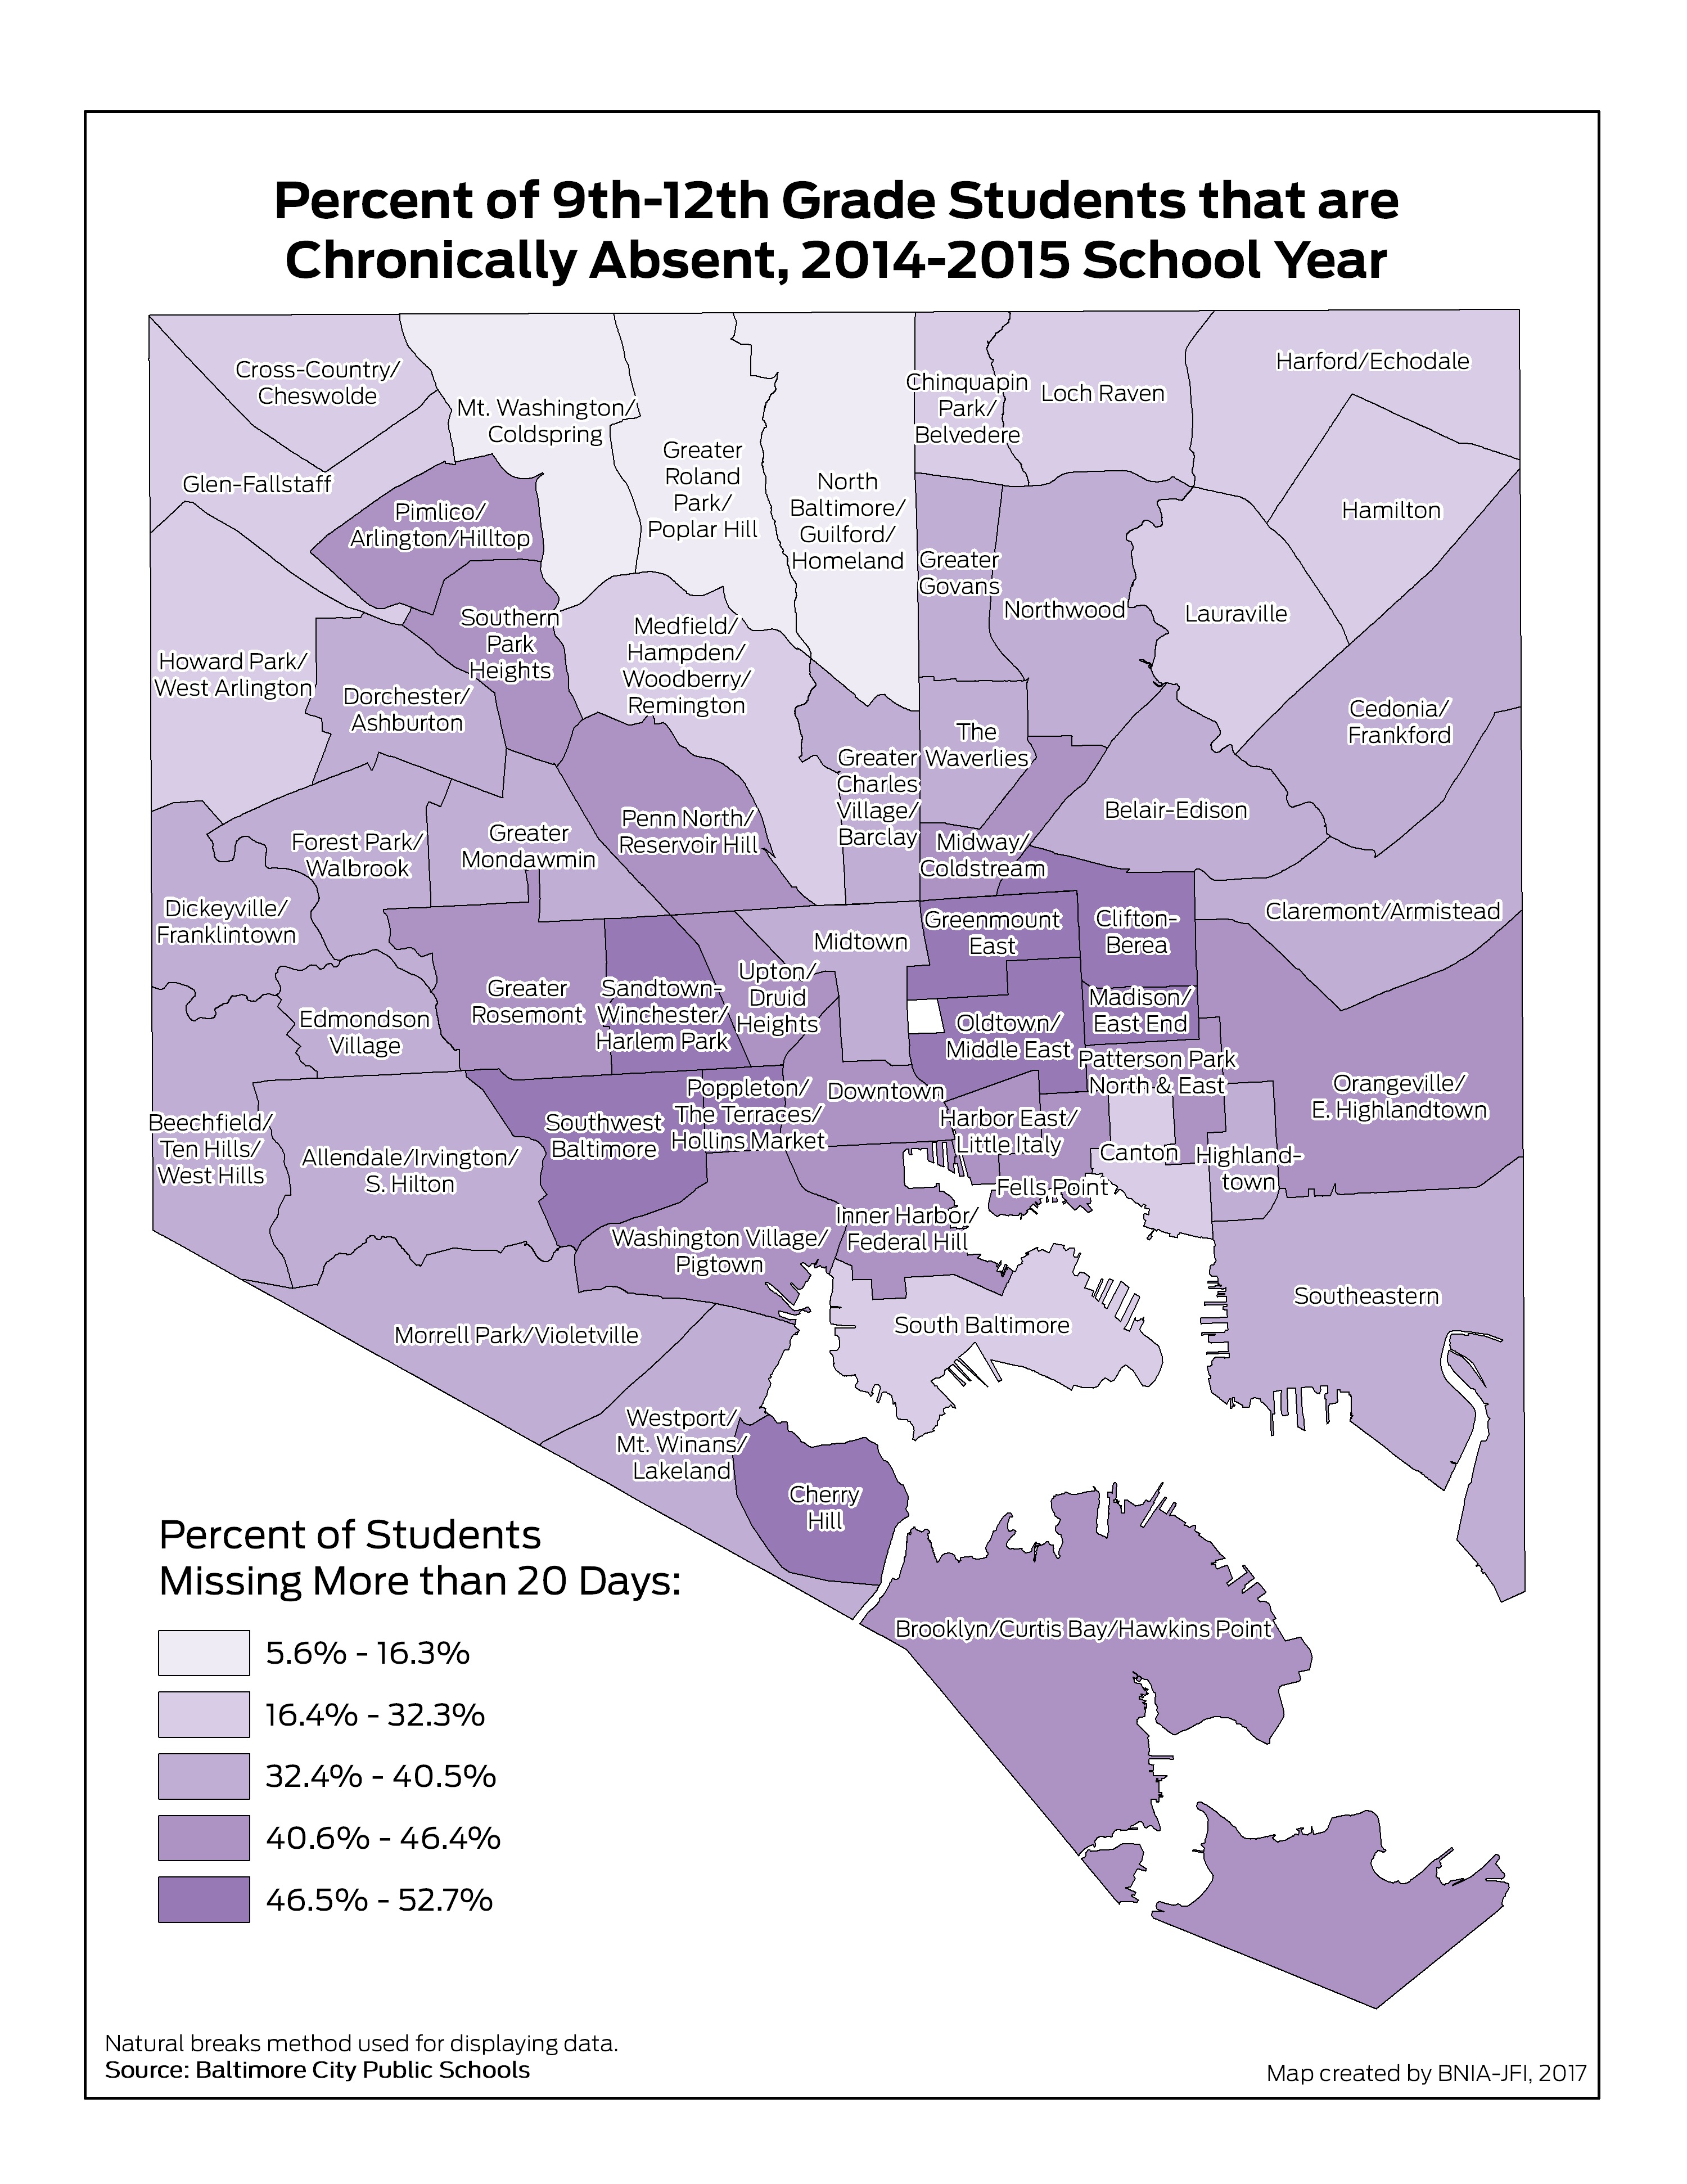
Percent of 9th-12th Grade Students that are Chronically Absent (Missing at least 20 Days)
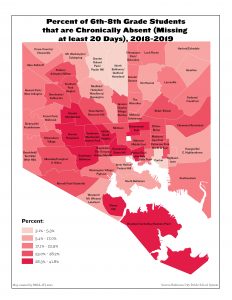
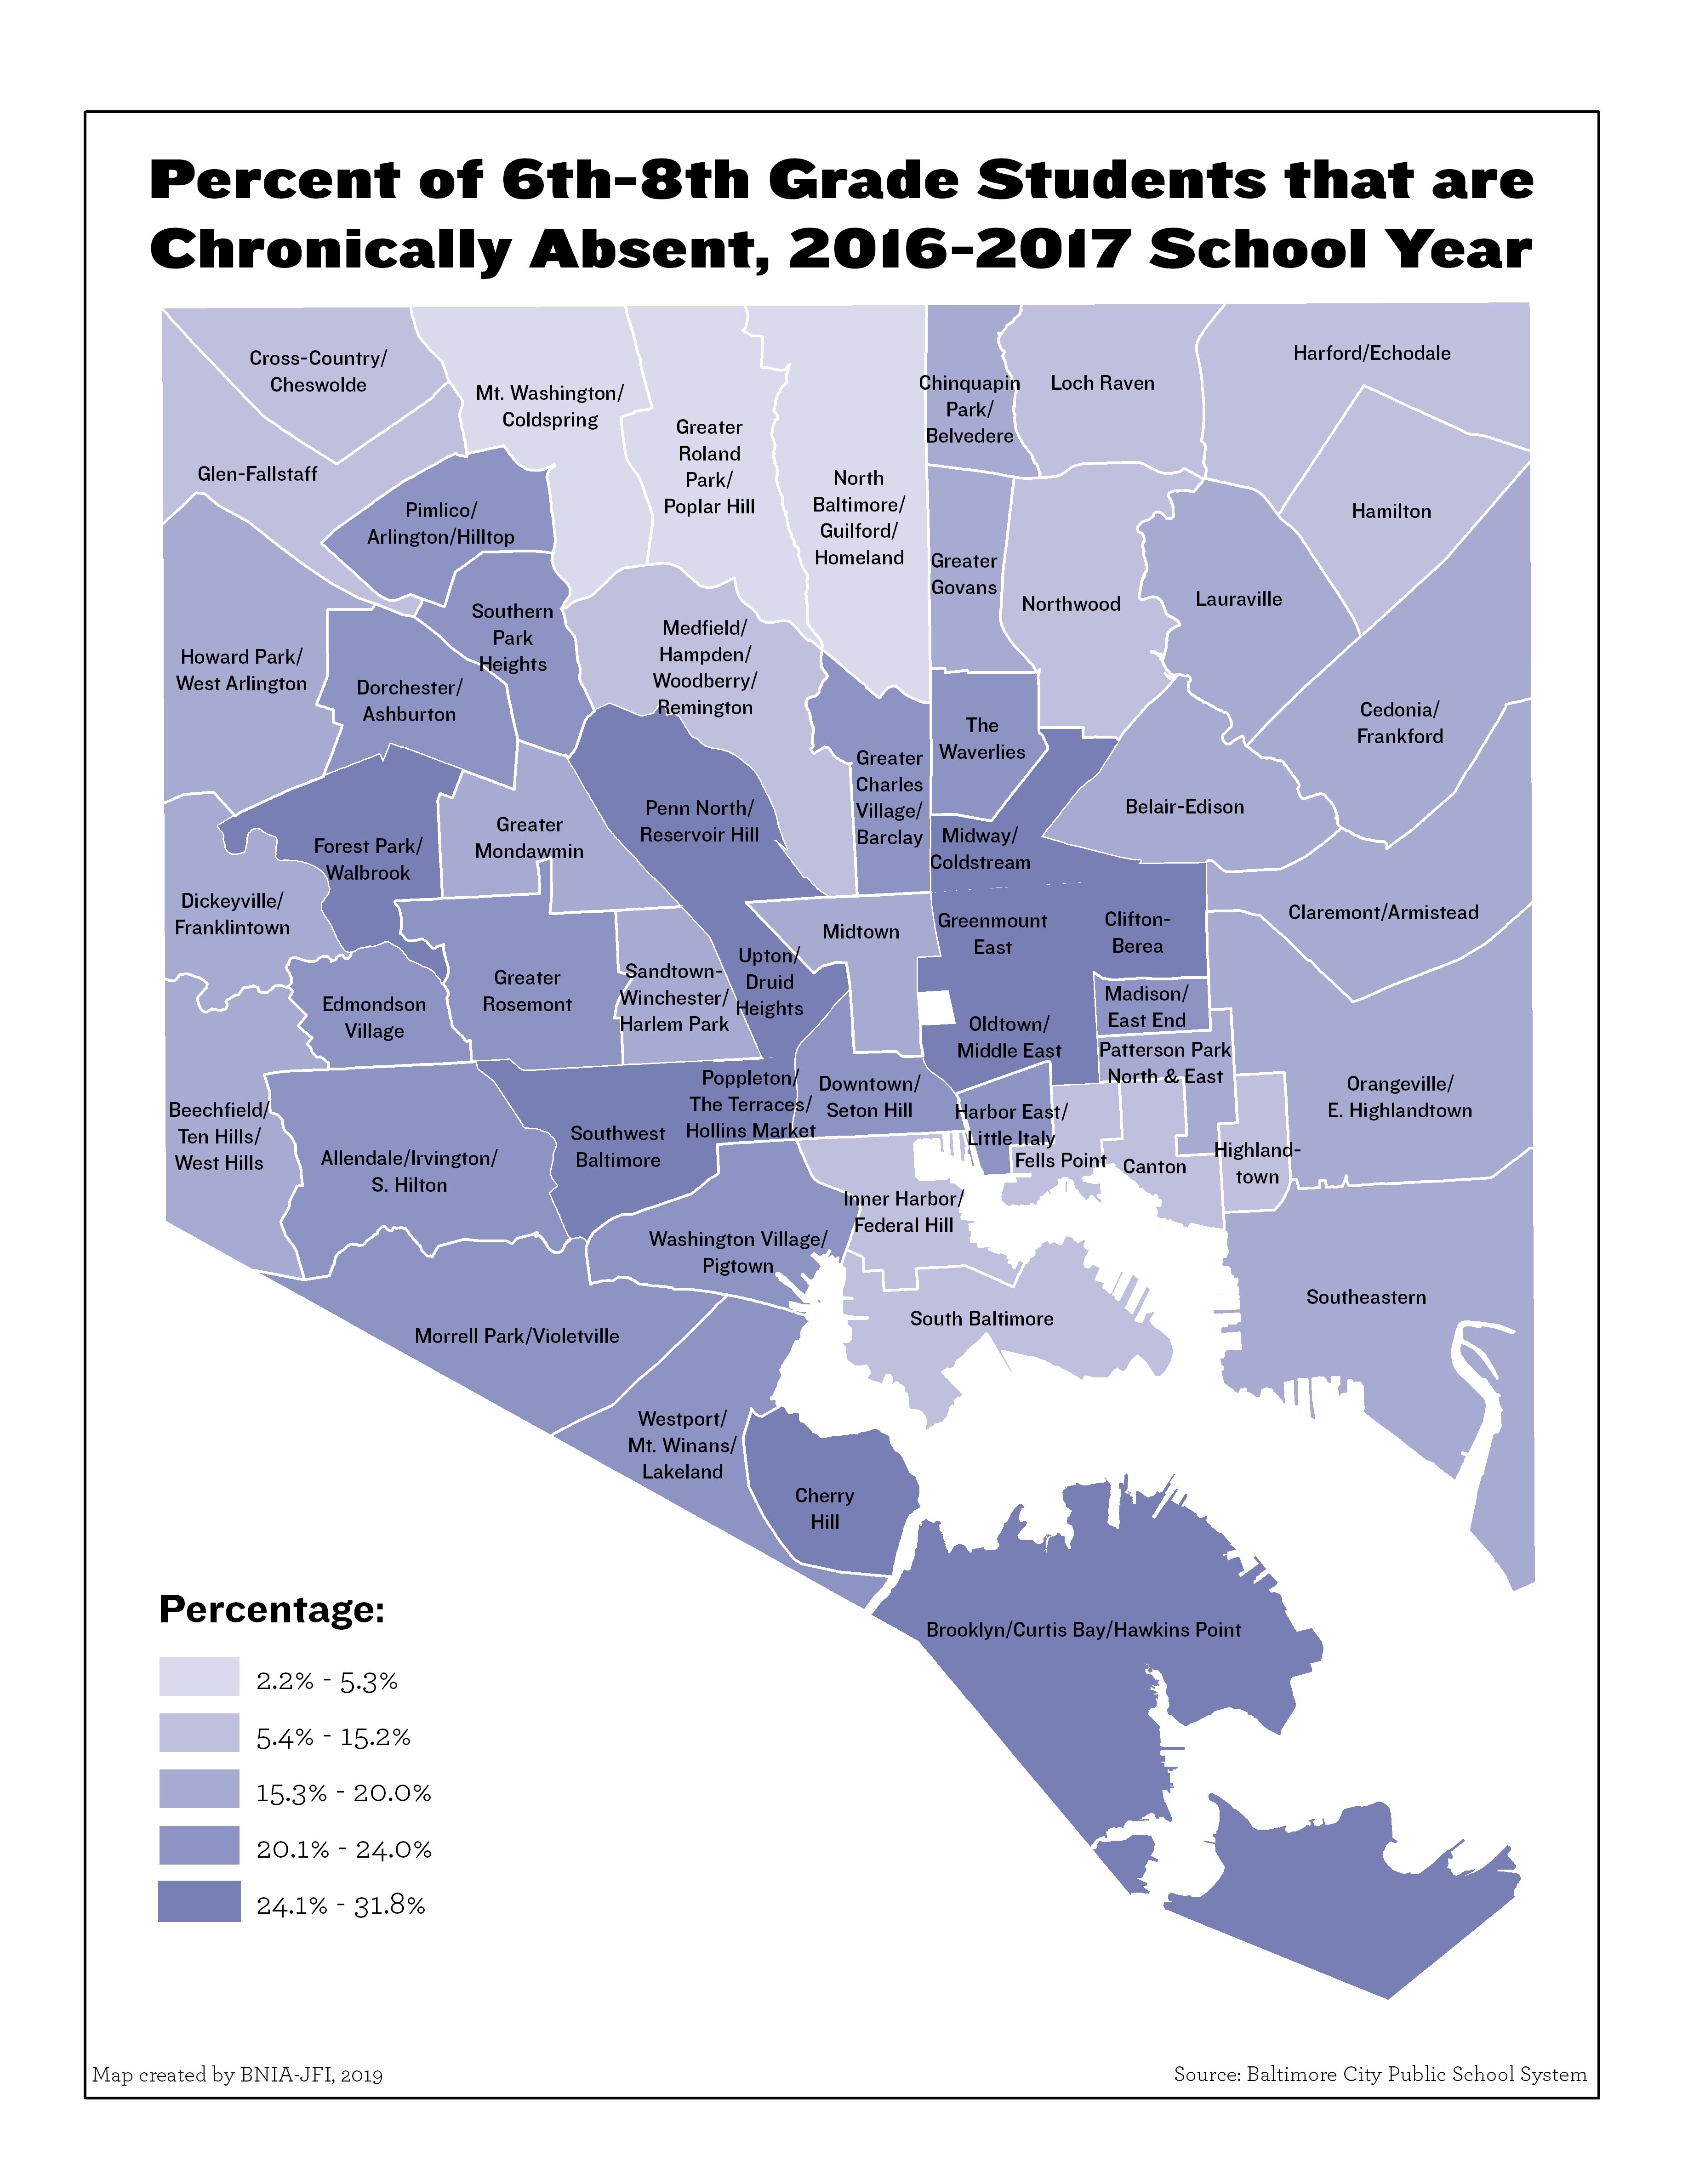
Percent of 6th-8th Grade Students that are Chronically Absent (Missing at least 20 Days)
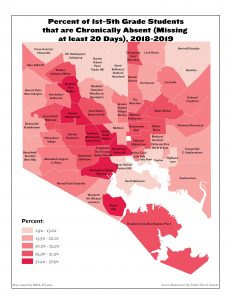
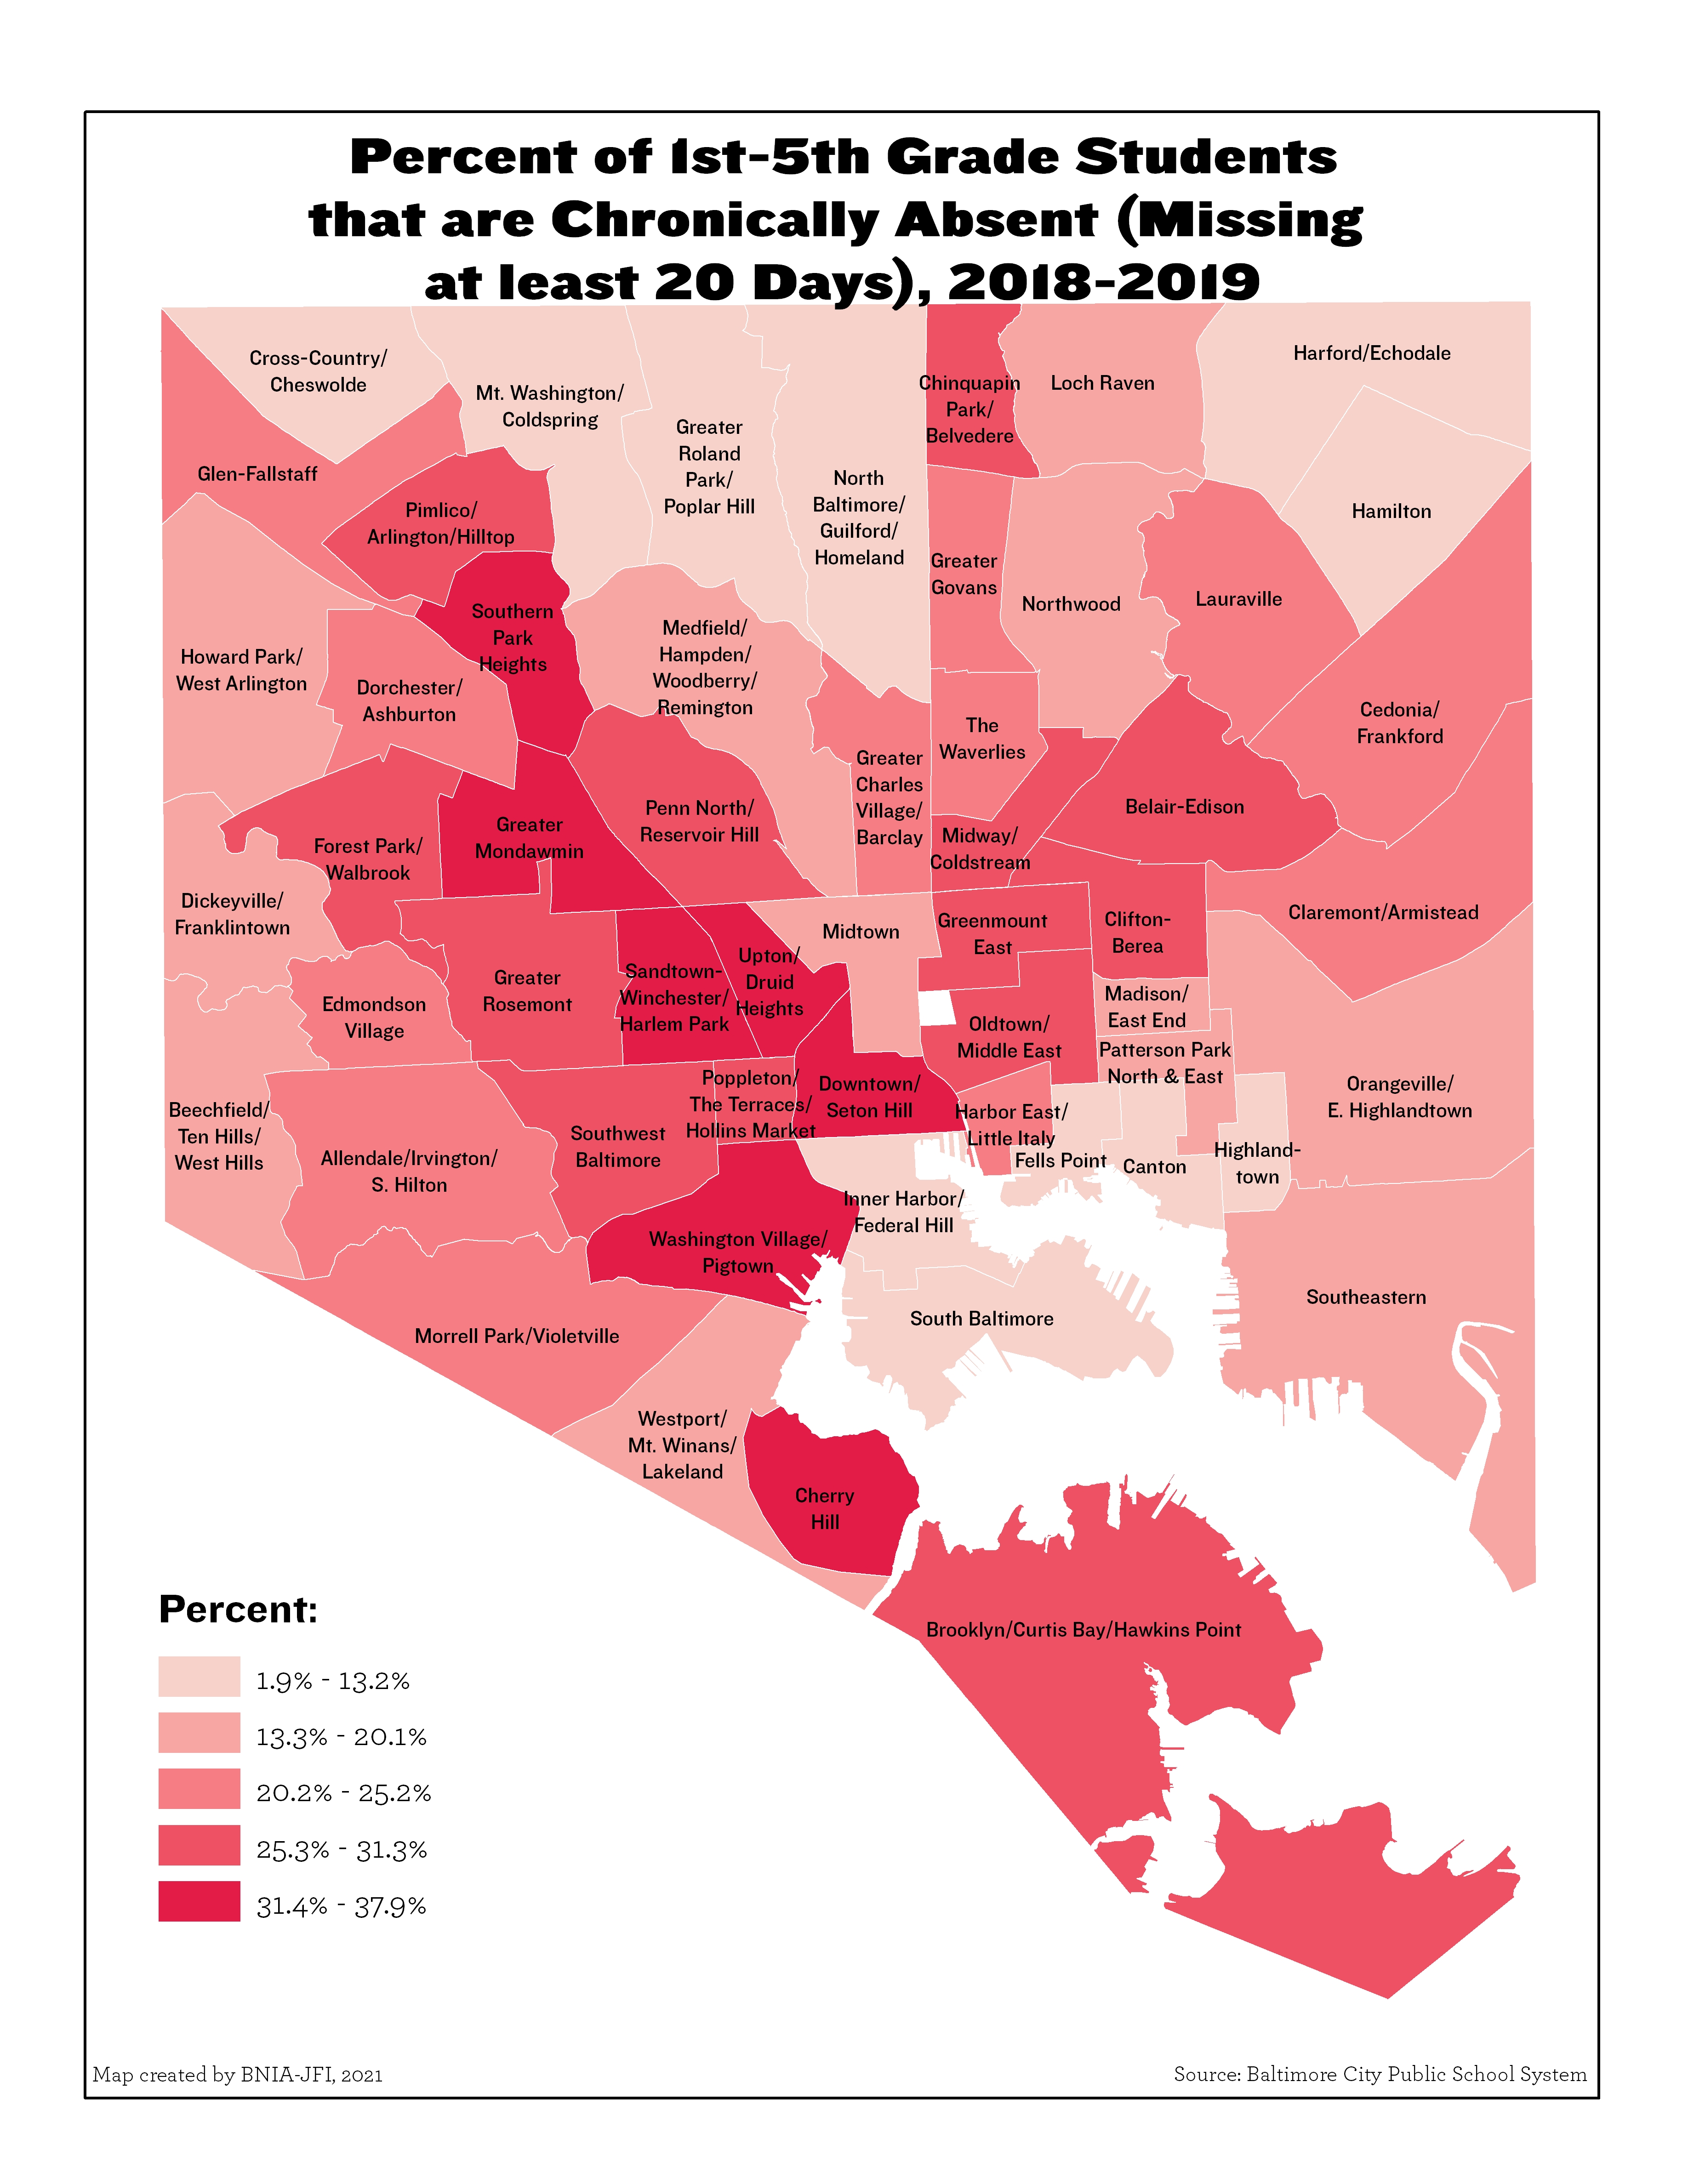
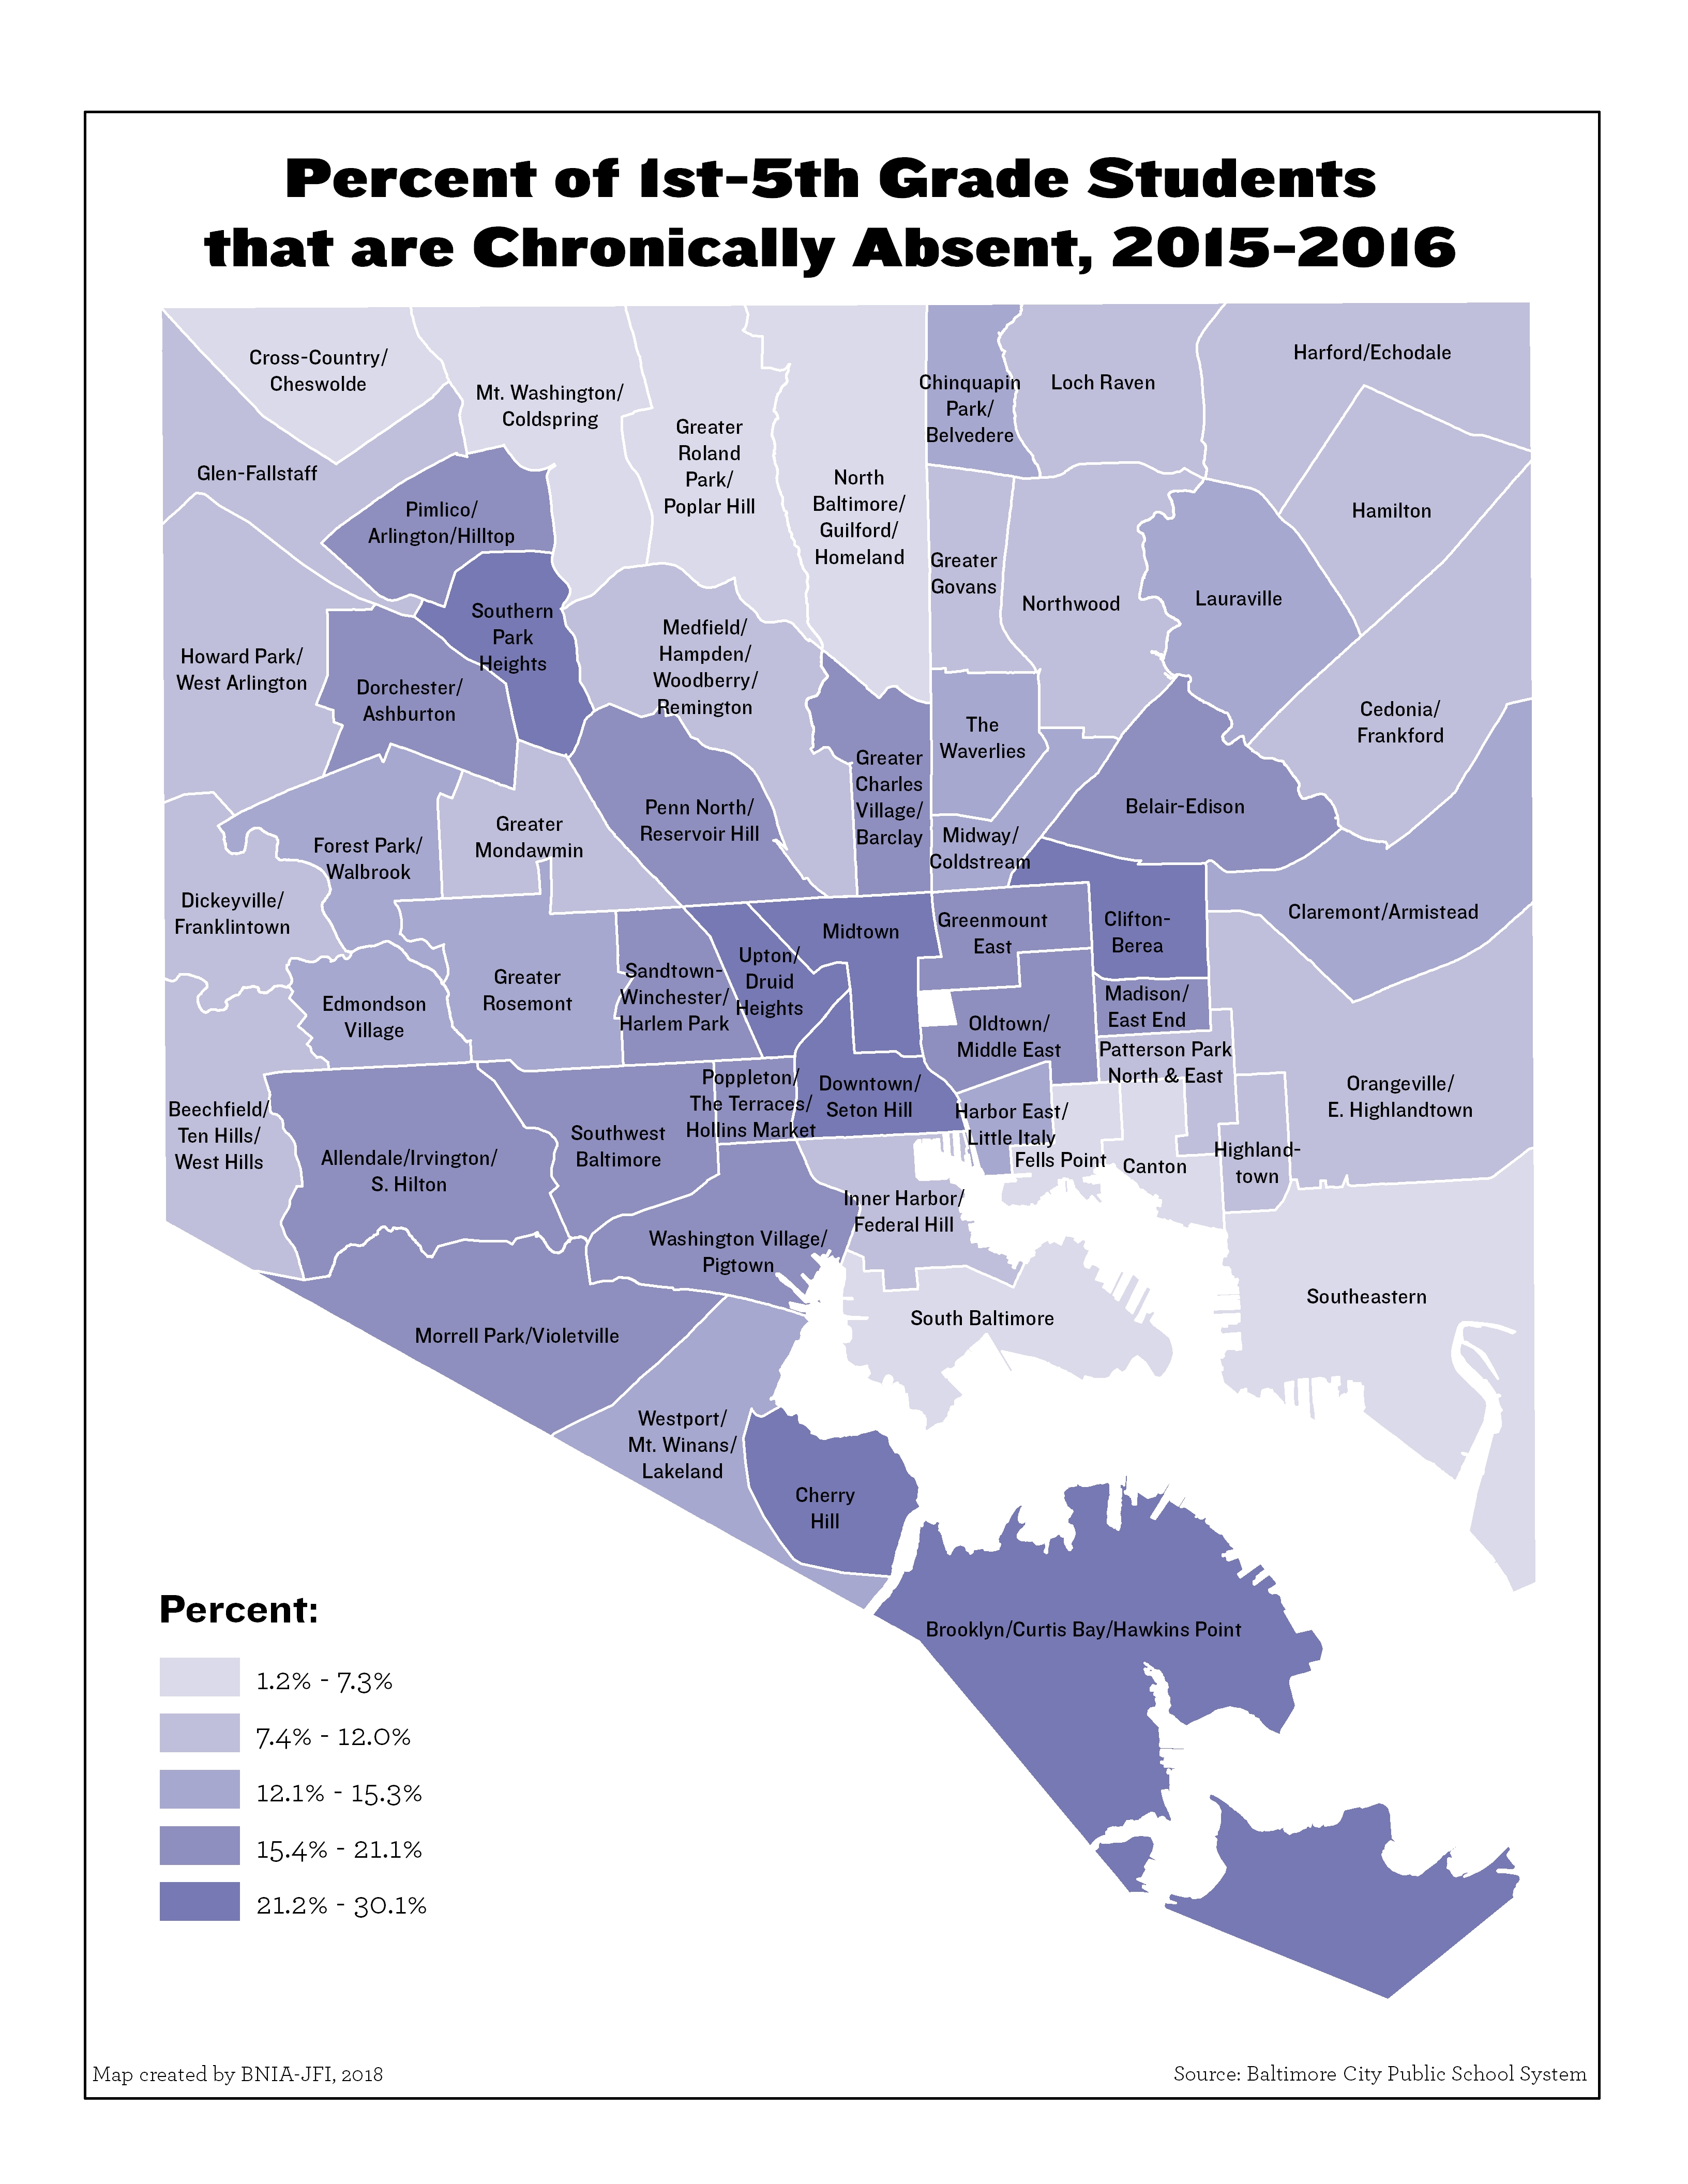
Percent of 1st-5th Grade Students that are Chronically Absent (Missing at least 20 Days)
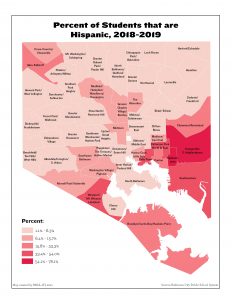
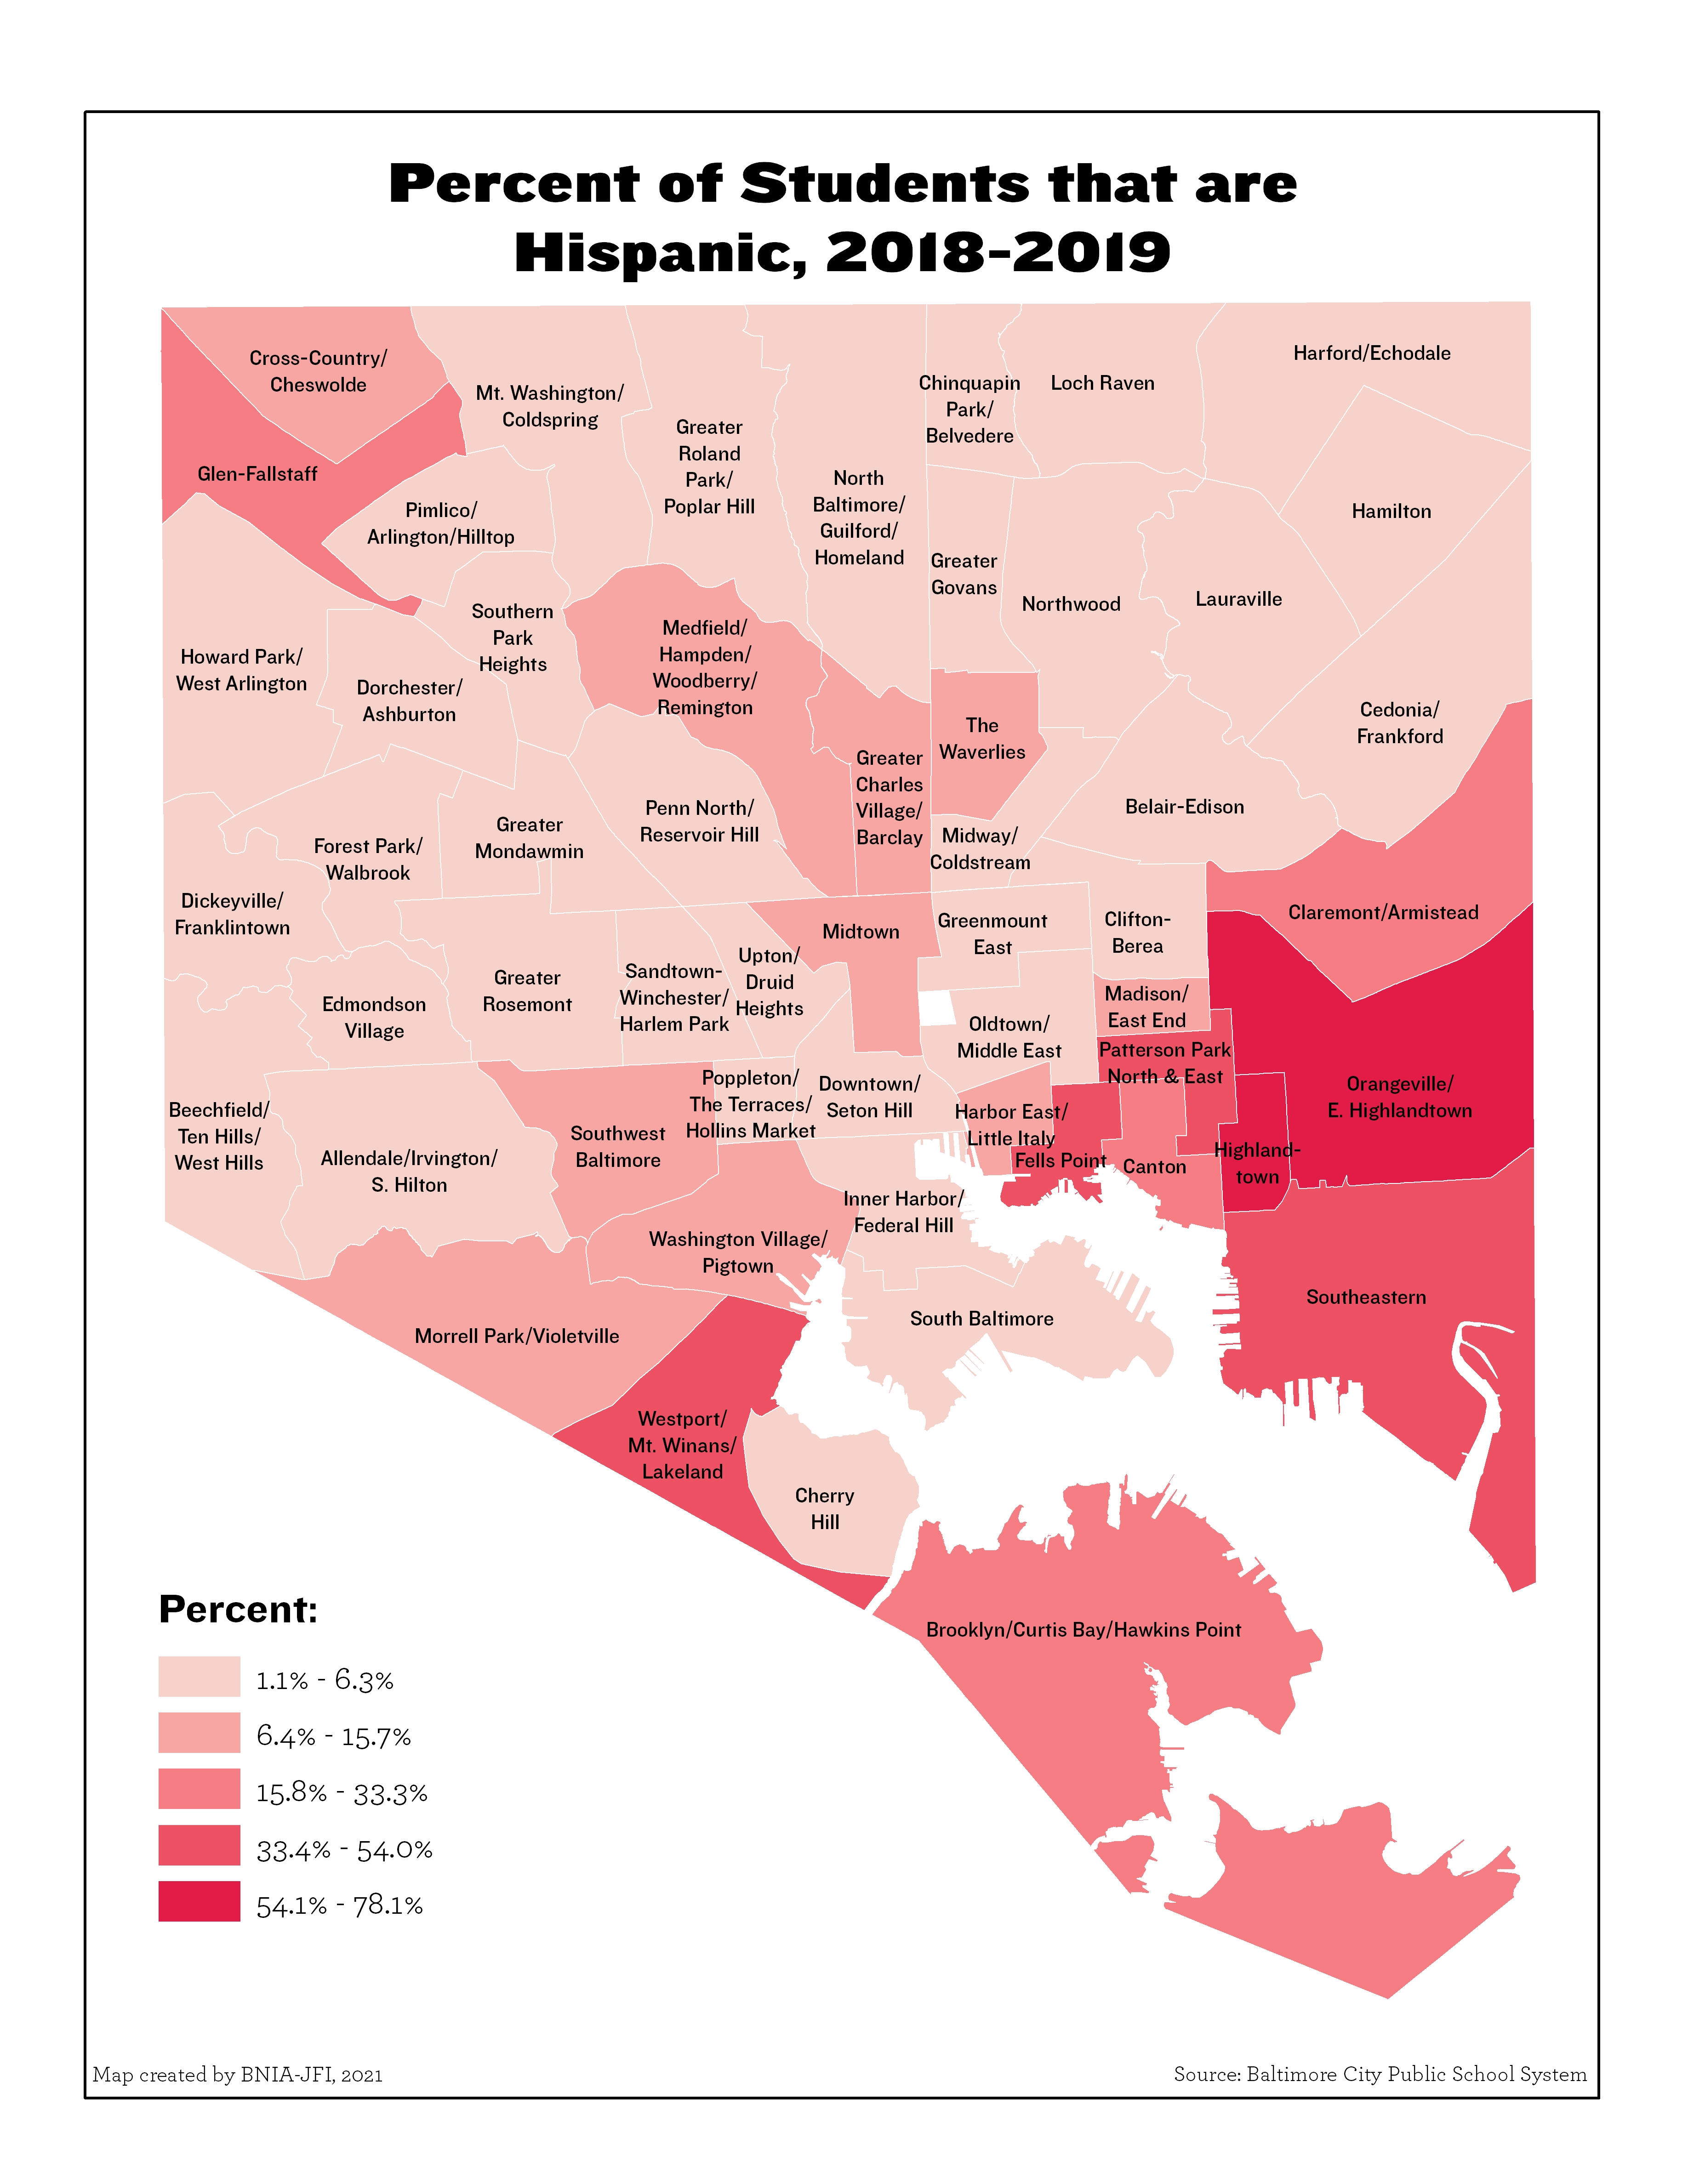
Percent of Students that are Hispanic (2018-2019))
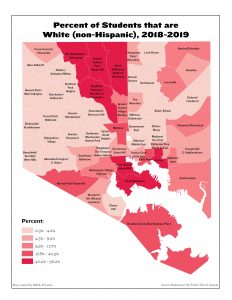
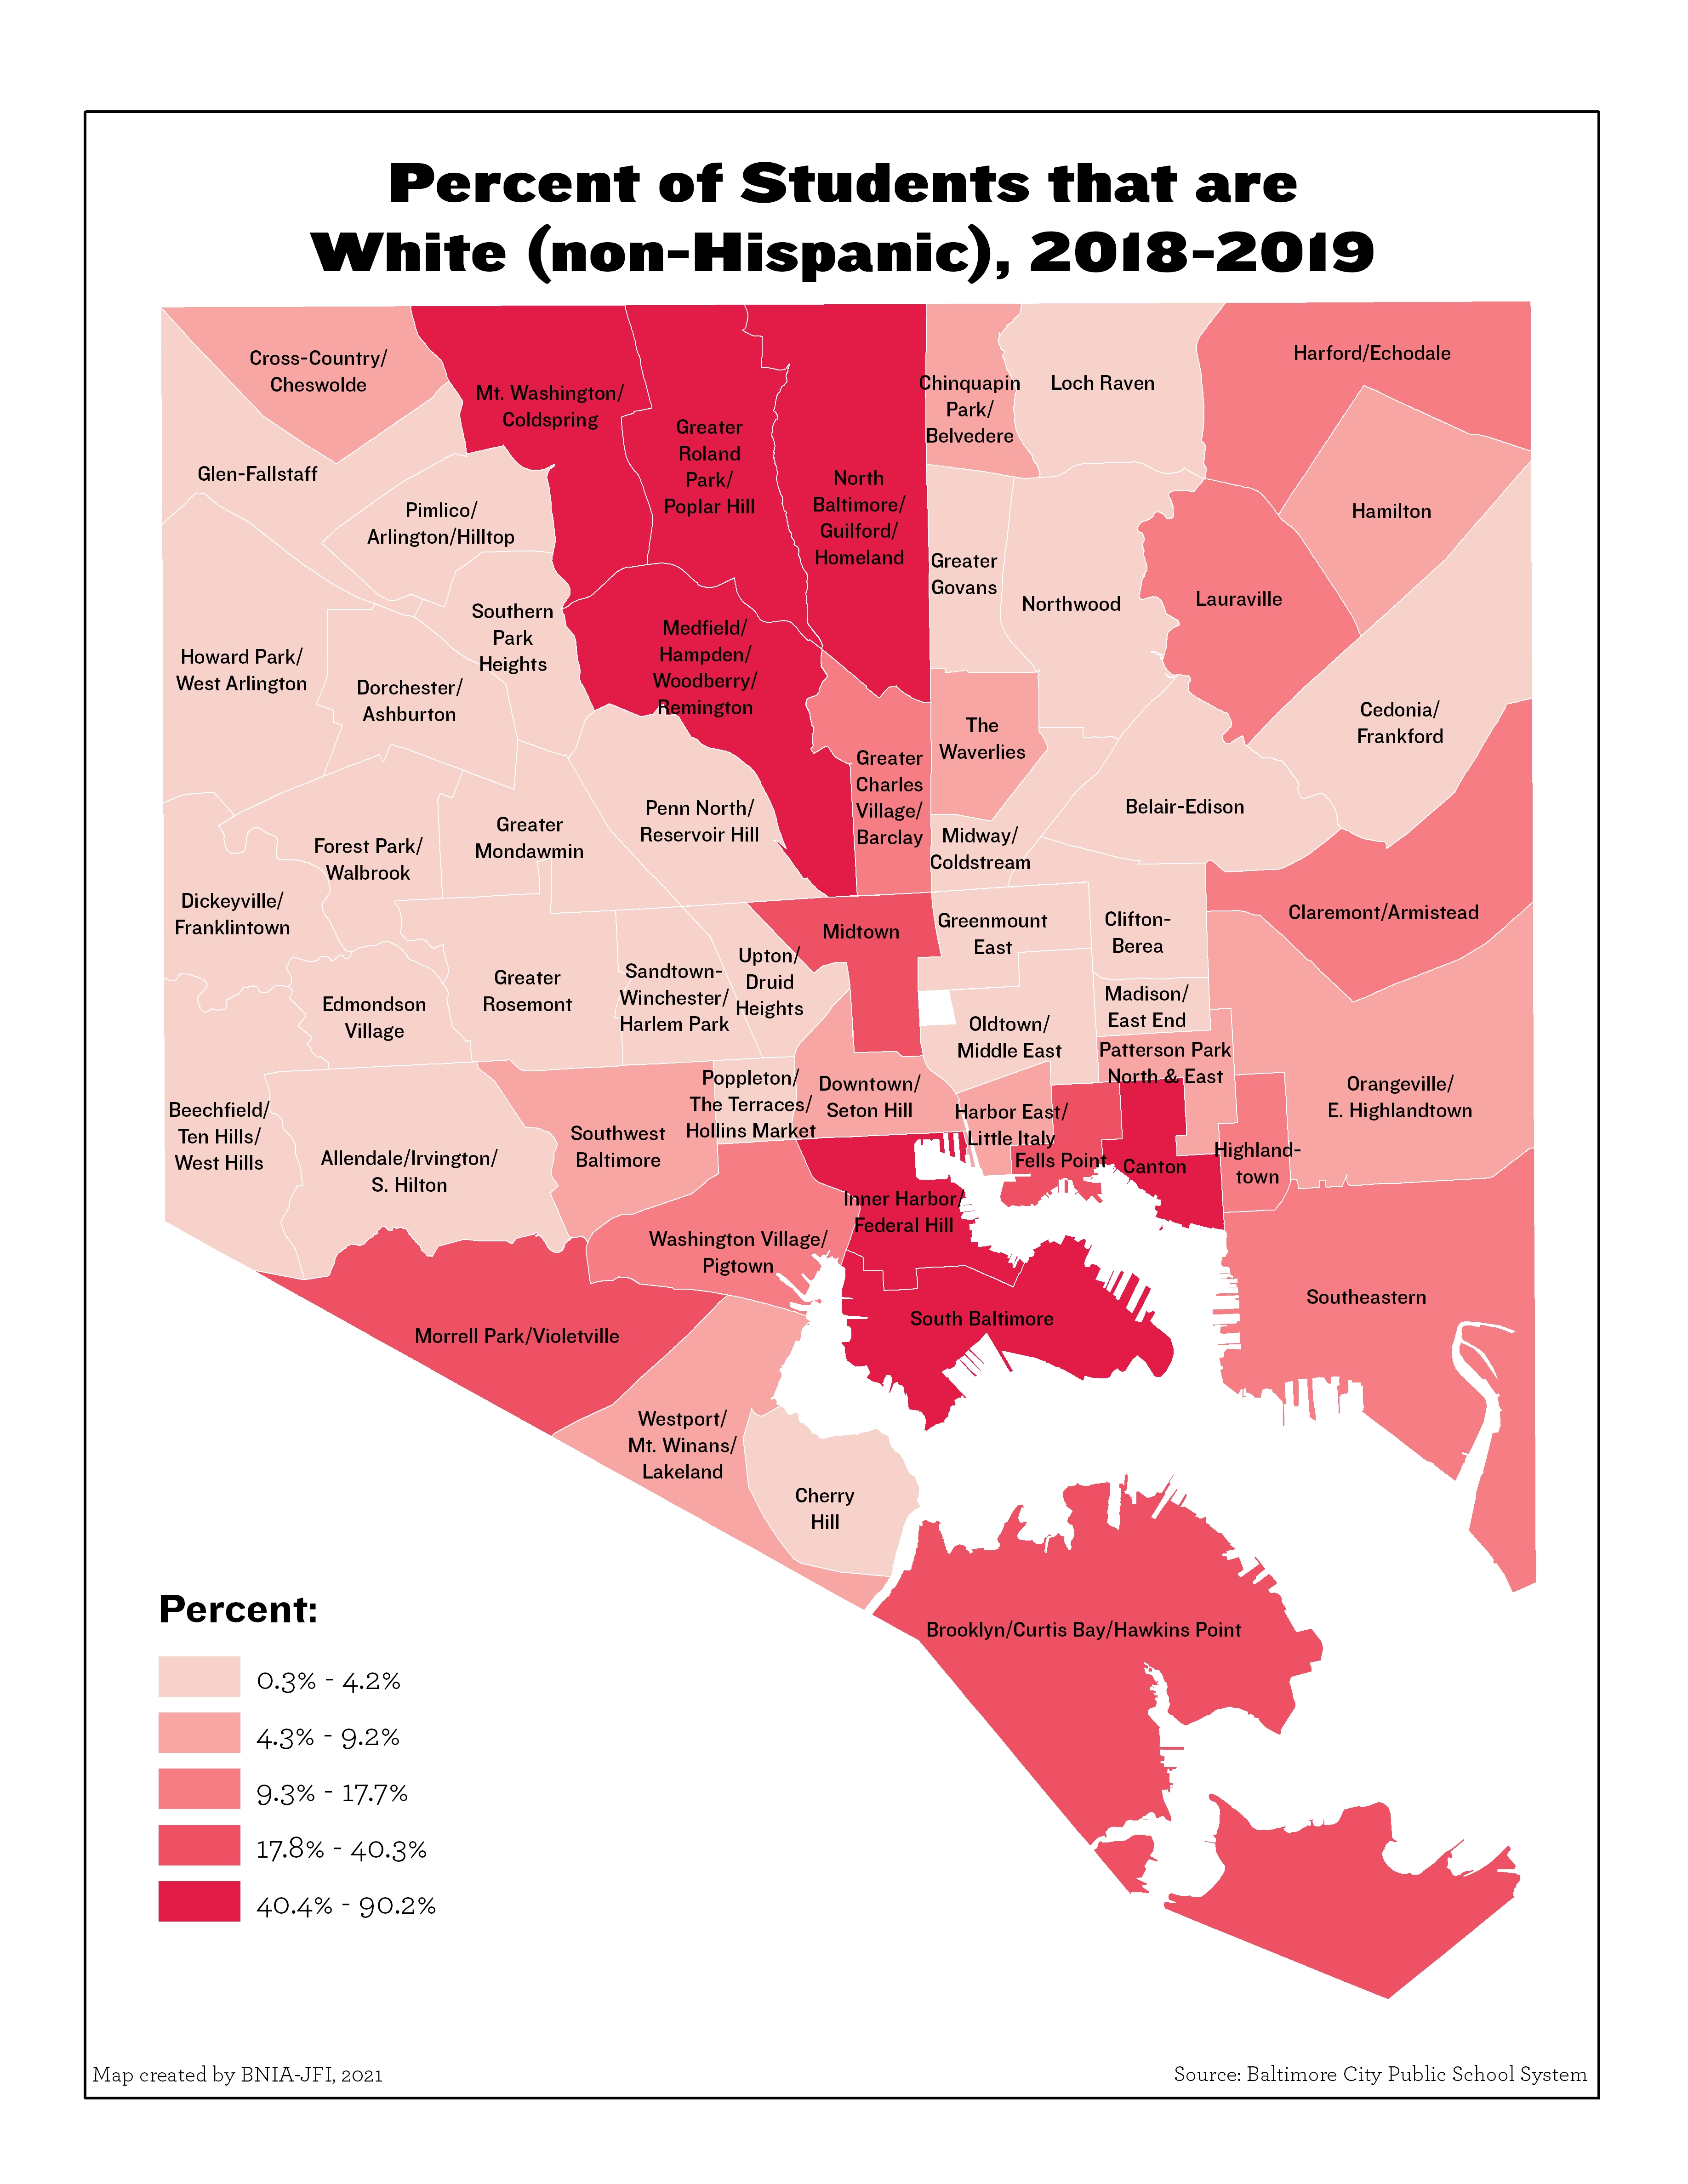
Percent of Students that are White (Non-Hispanic) (2018-2019)

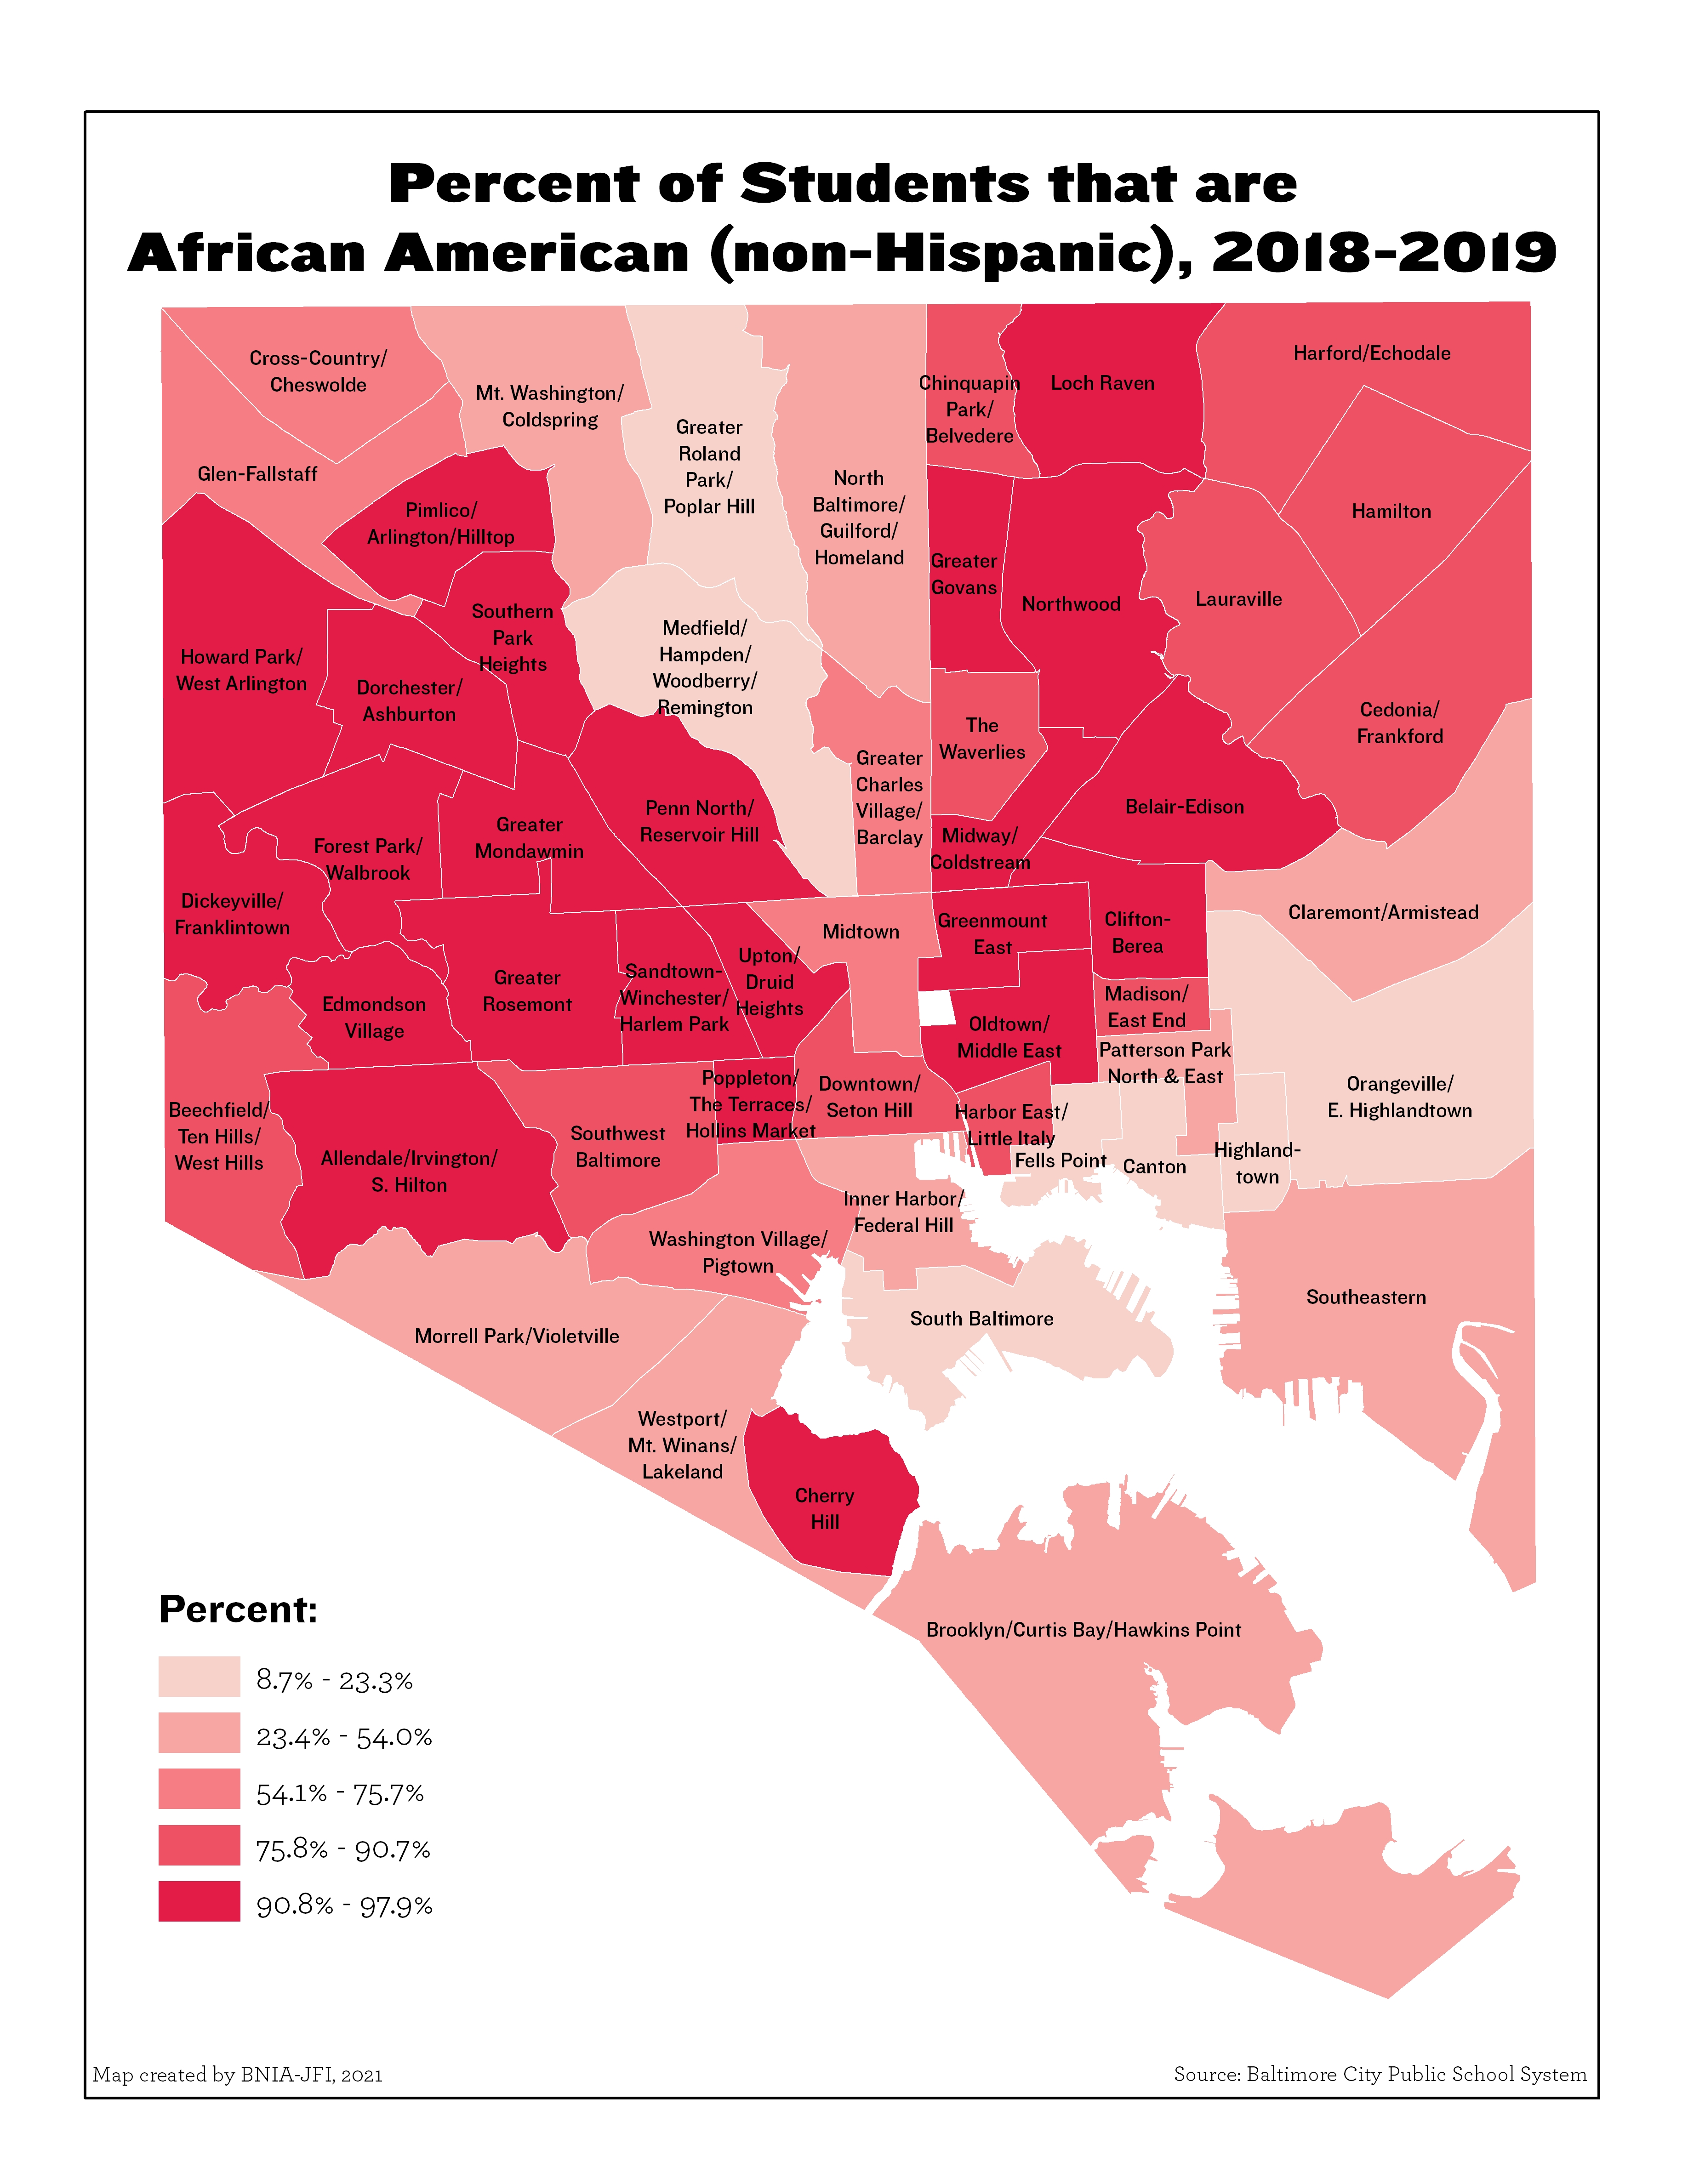
Percent of Students that are African American (Non-Hispanic) (2018-2019)
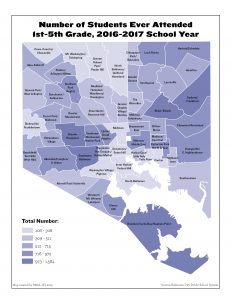
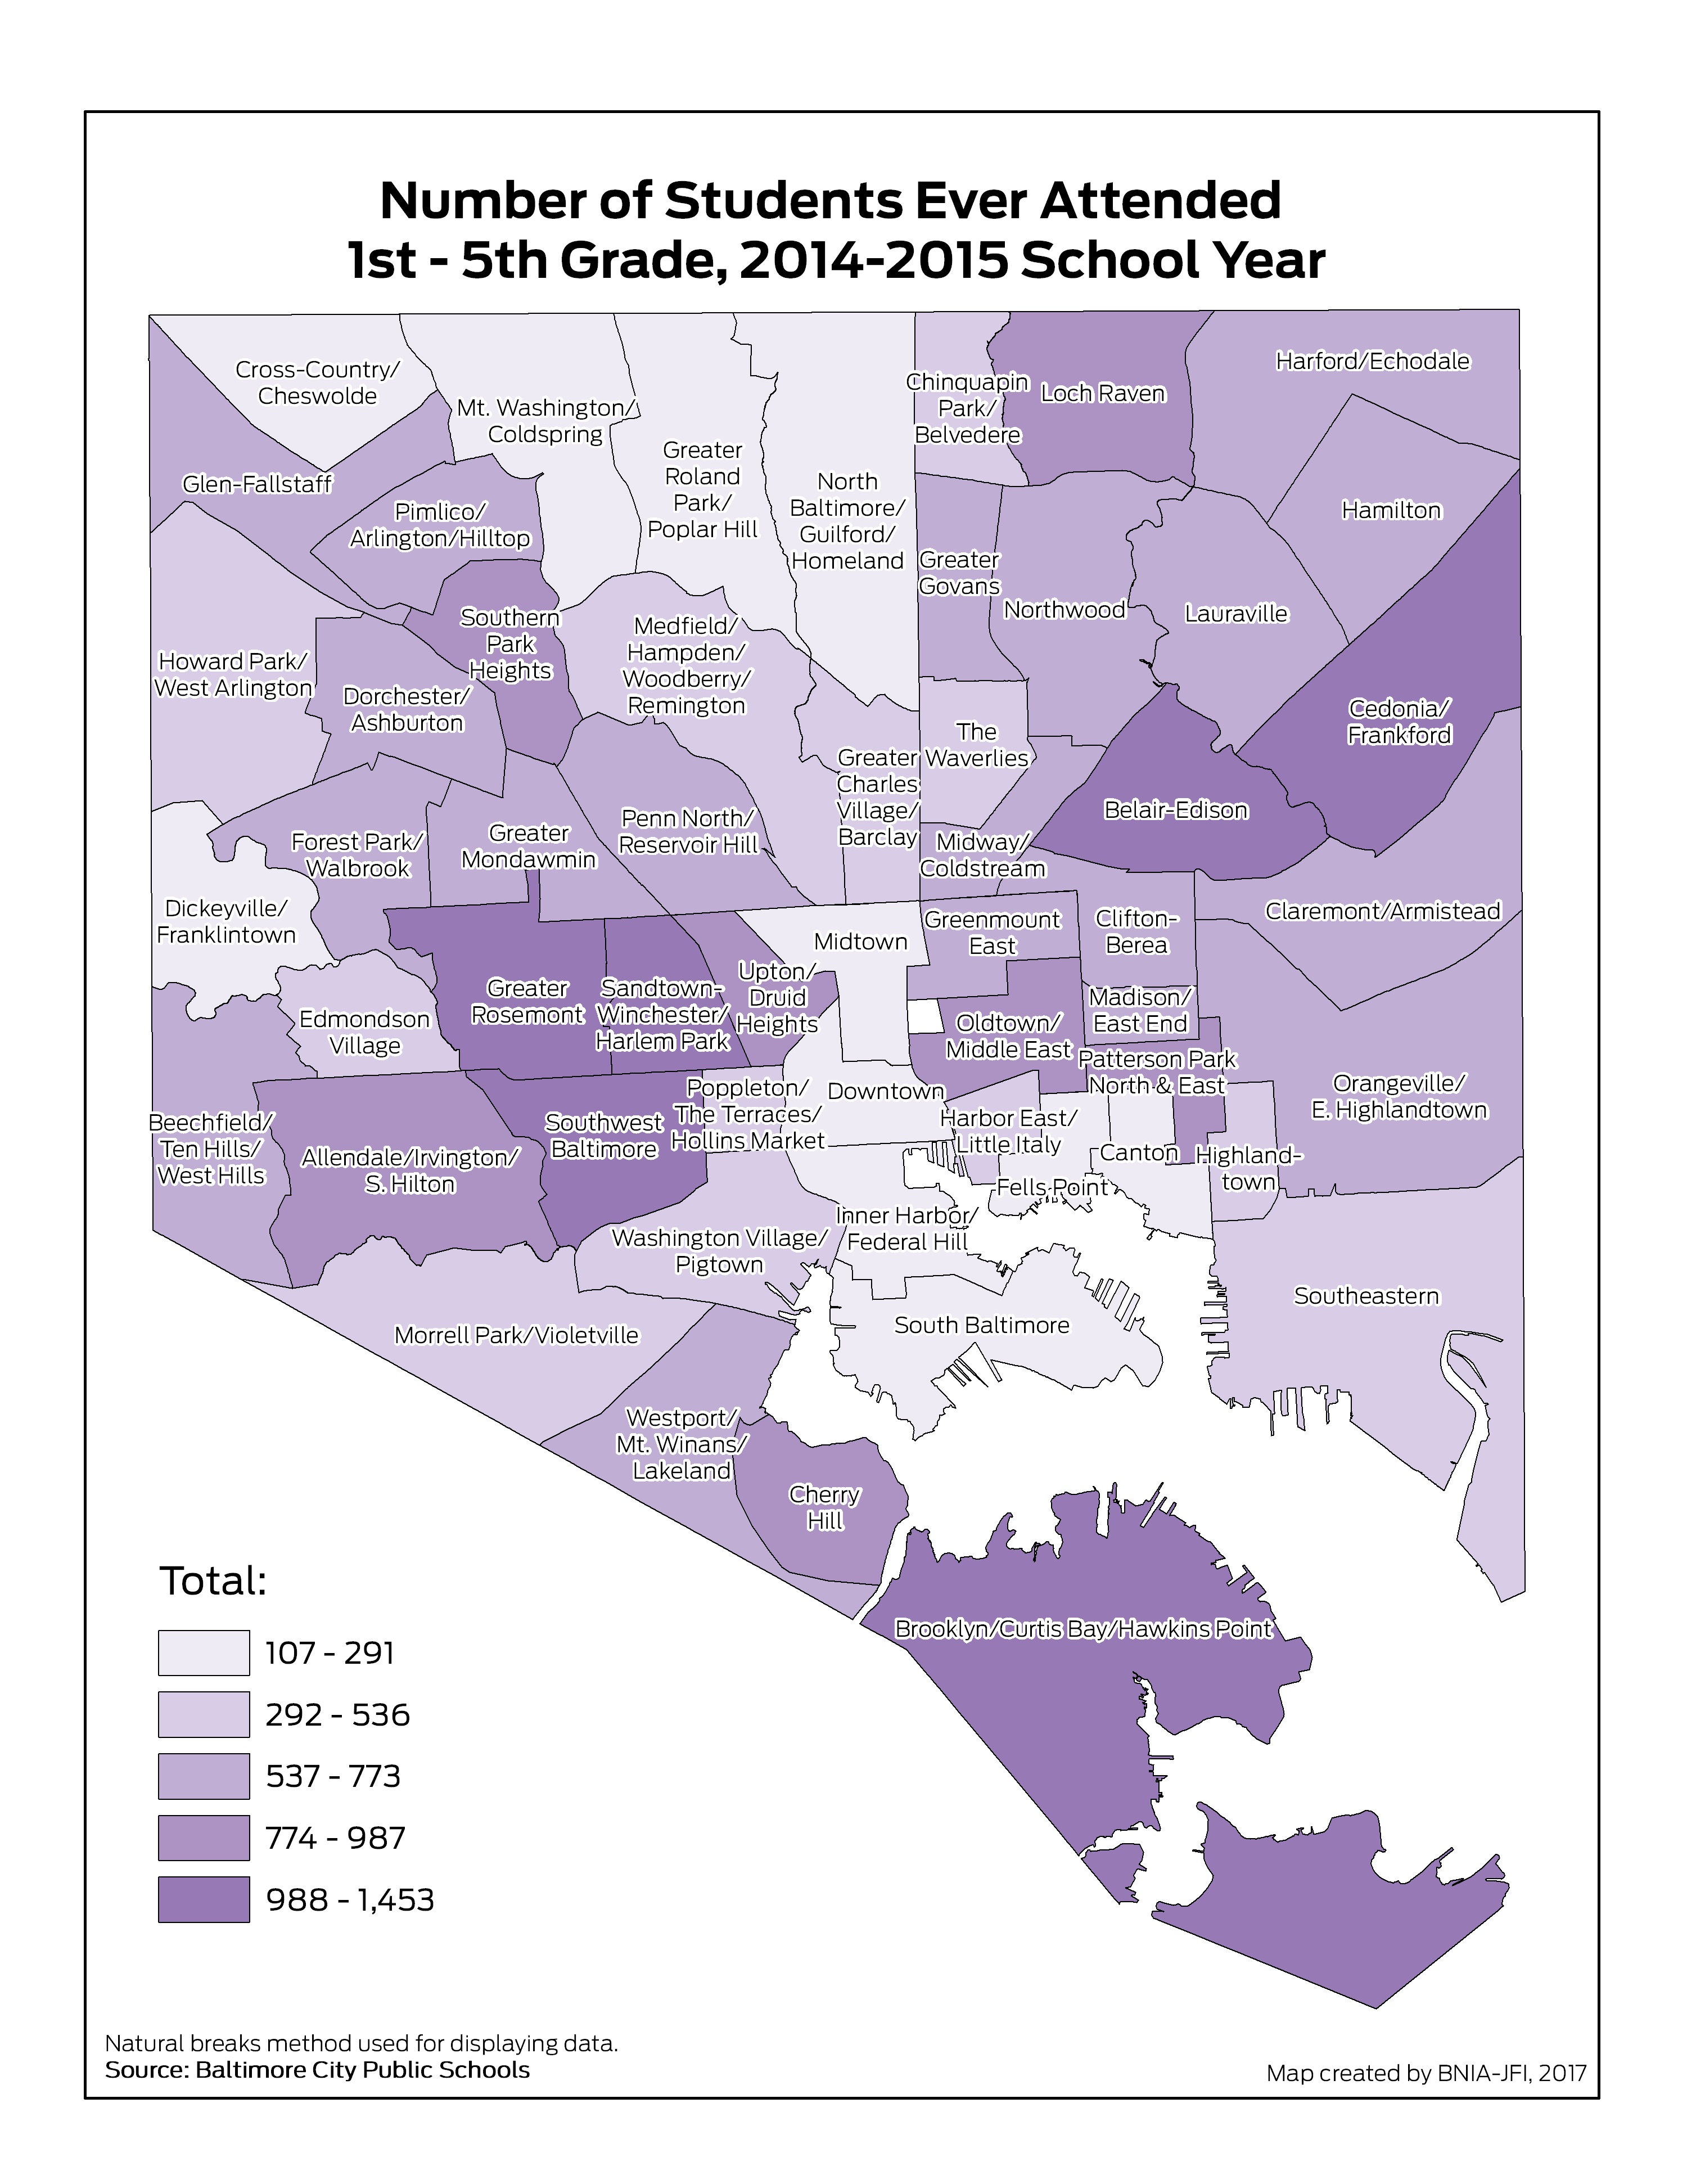
Number of Students Ever Attended 1st – 5th Grade
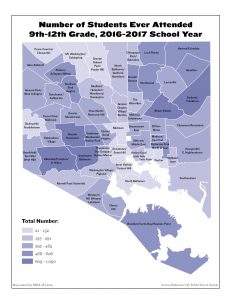
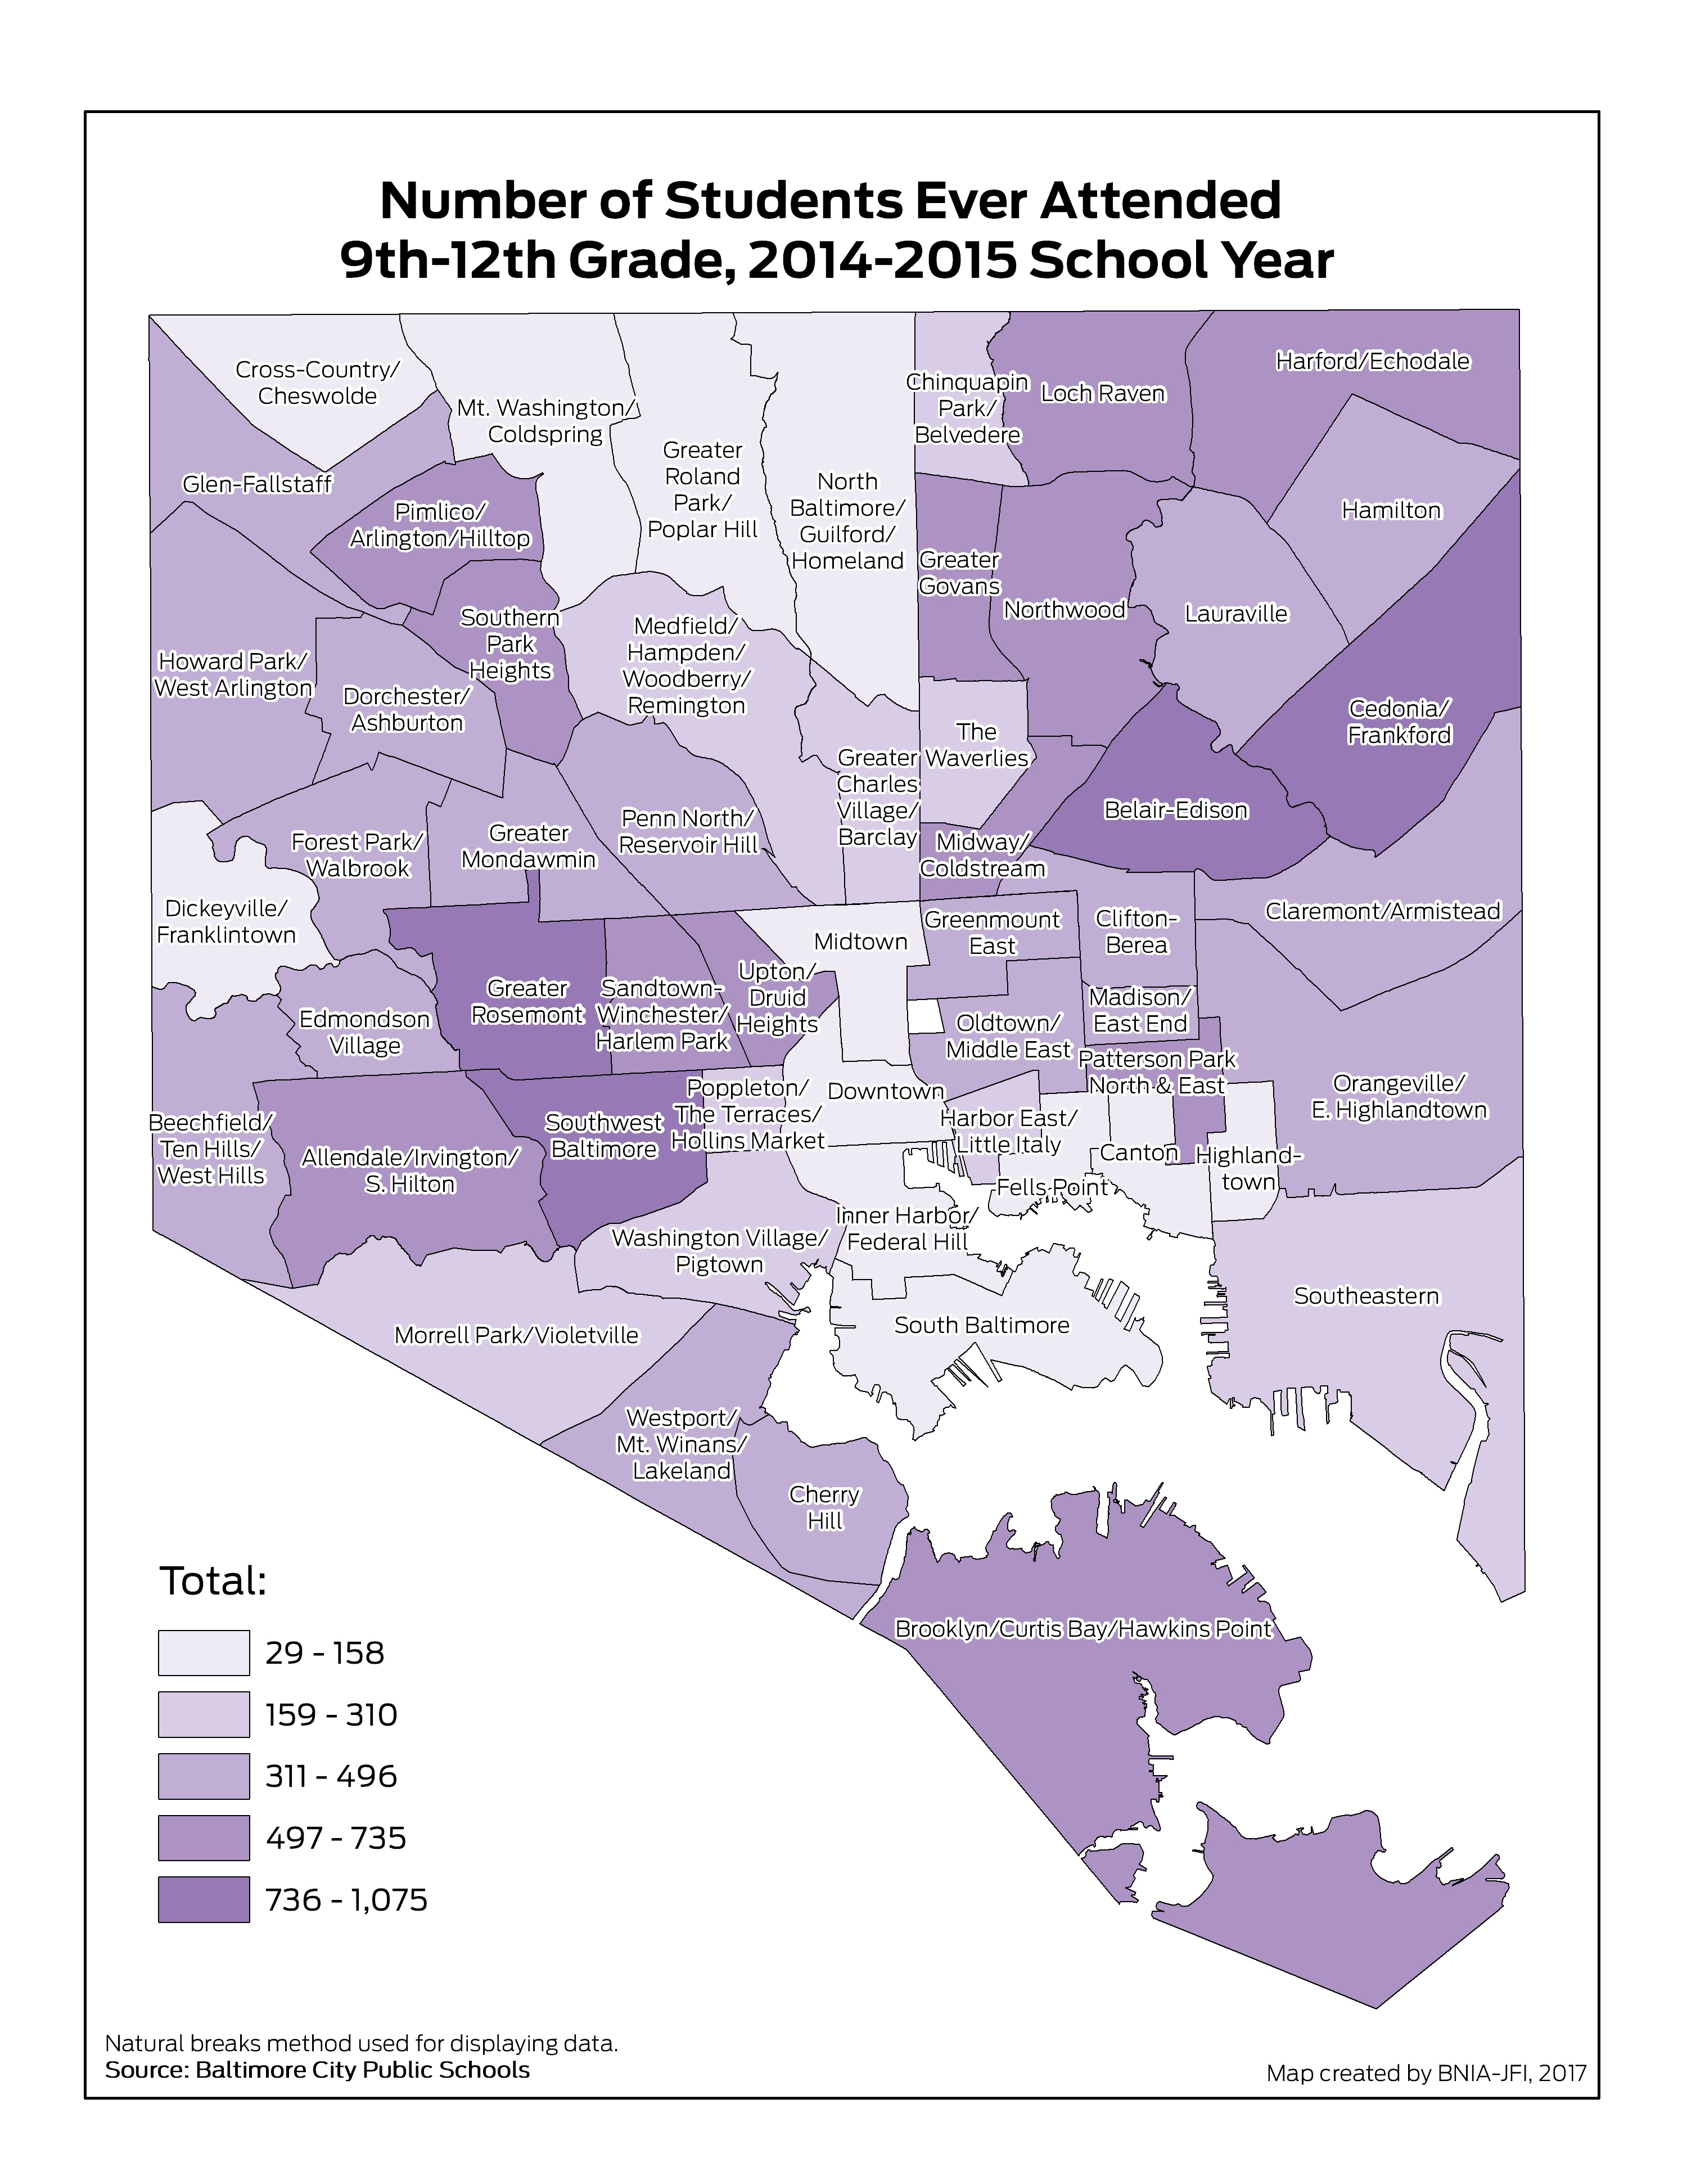
Number of Students Ever Attended 9th – 12th Grade
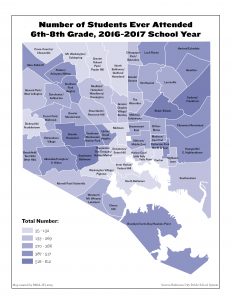
Number of Students Ever Attended 6th – 8th Grade
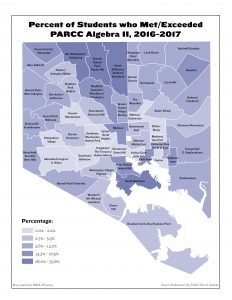
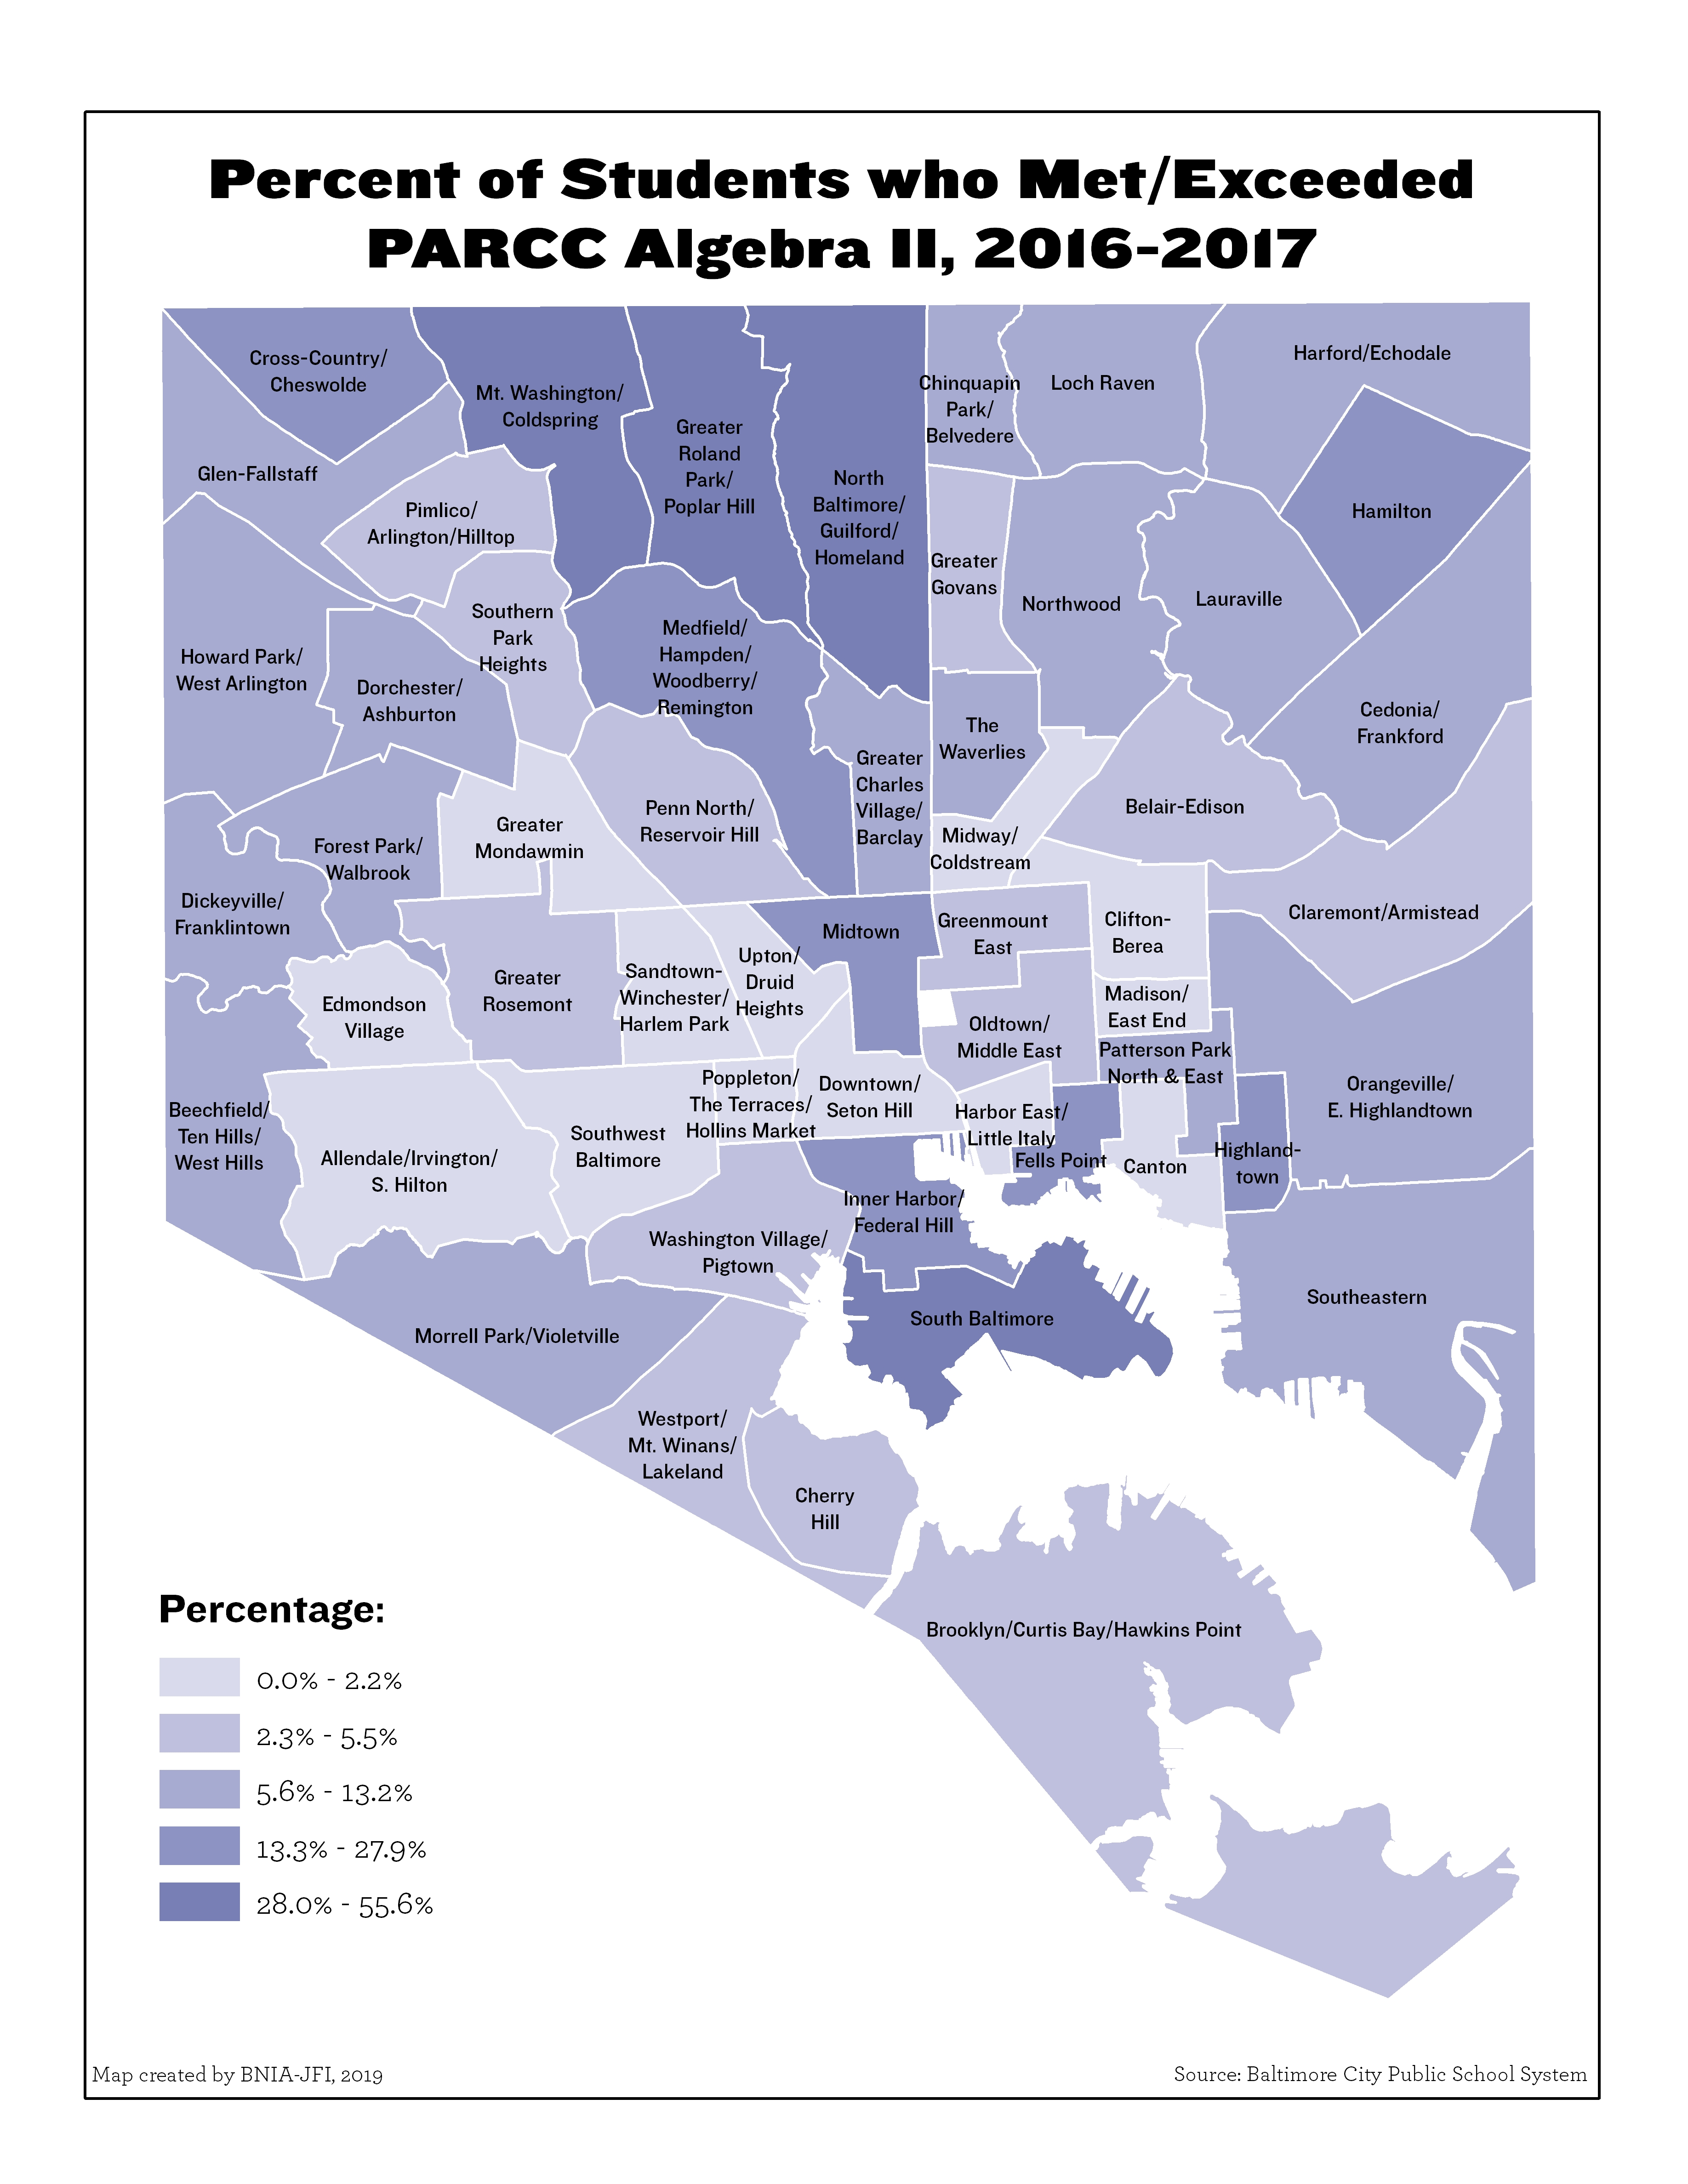
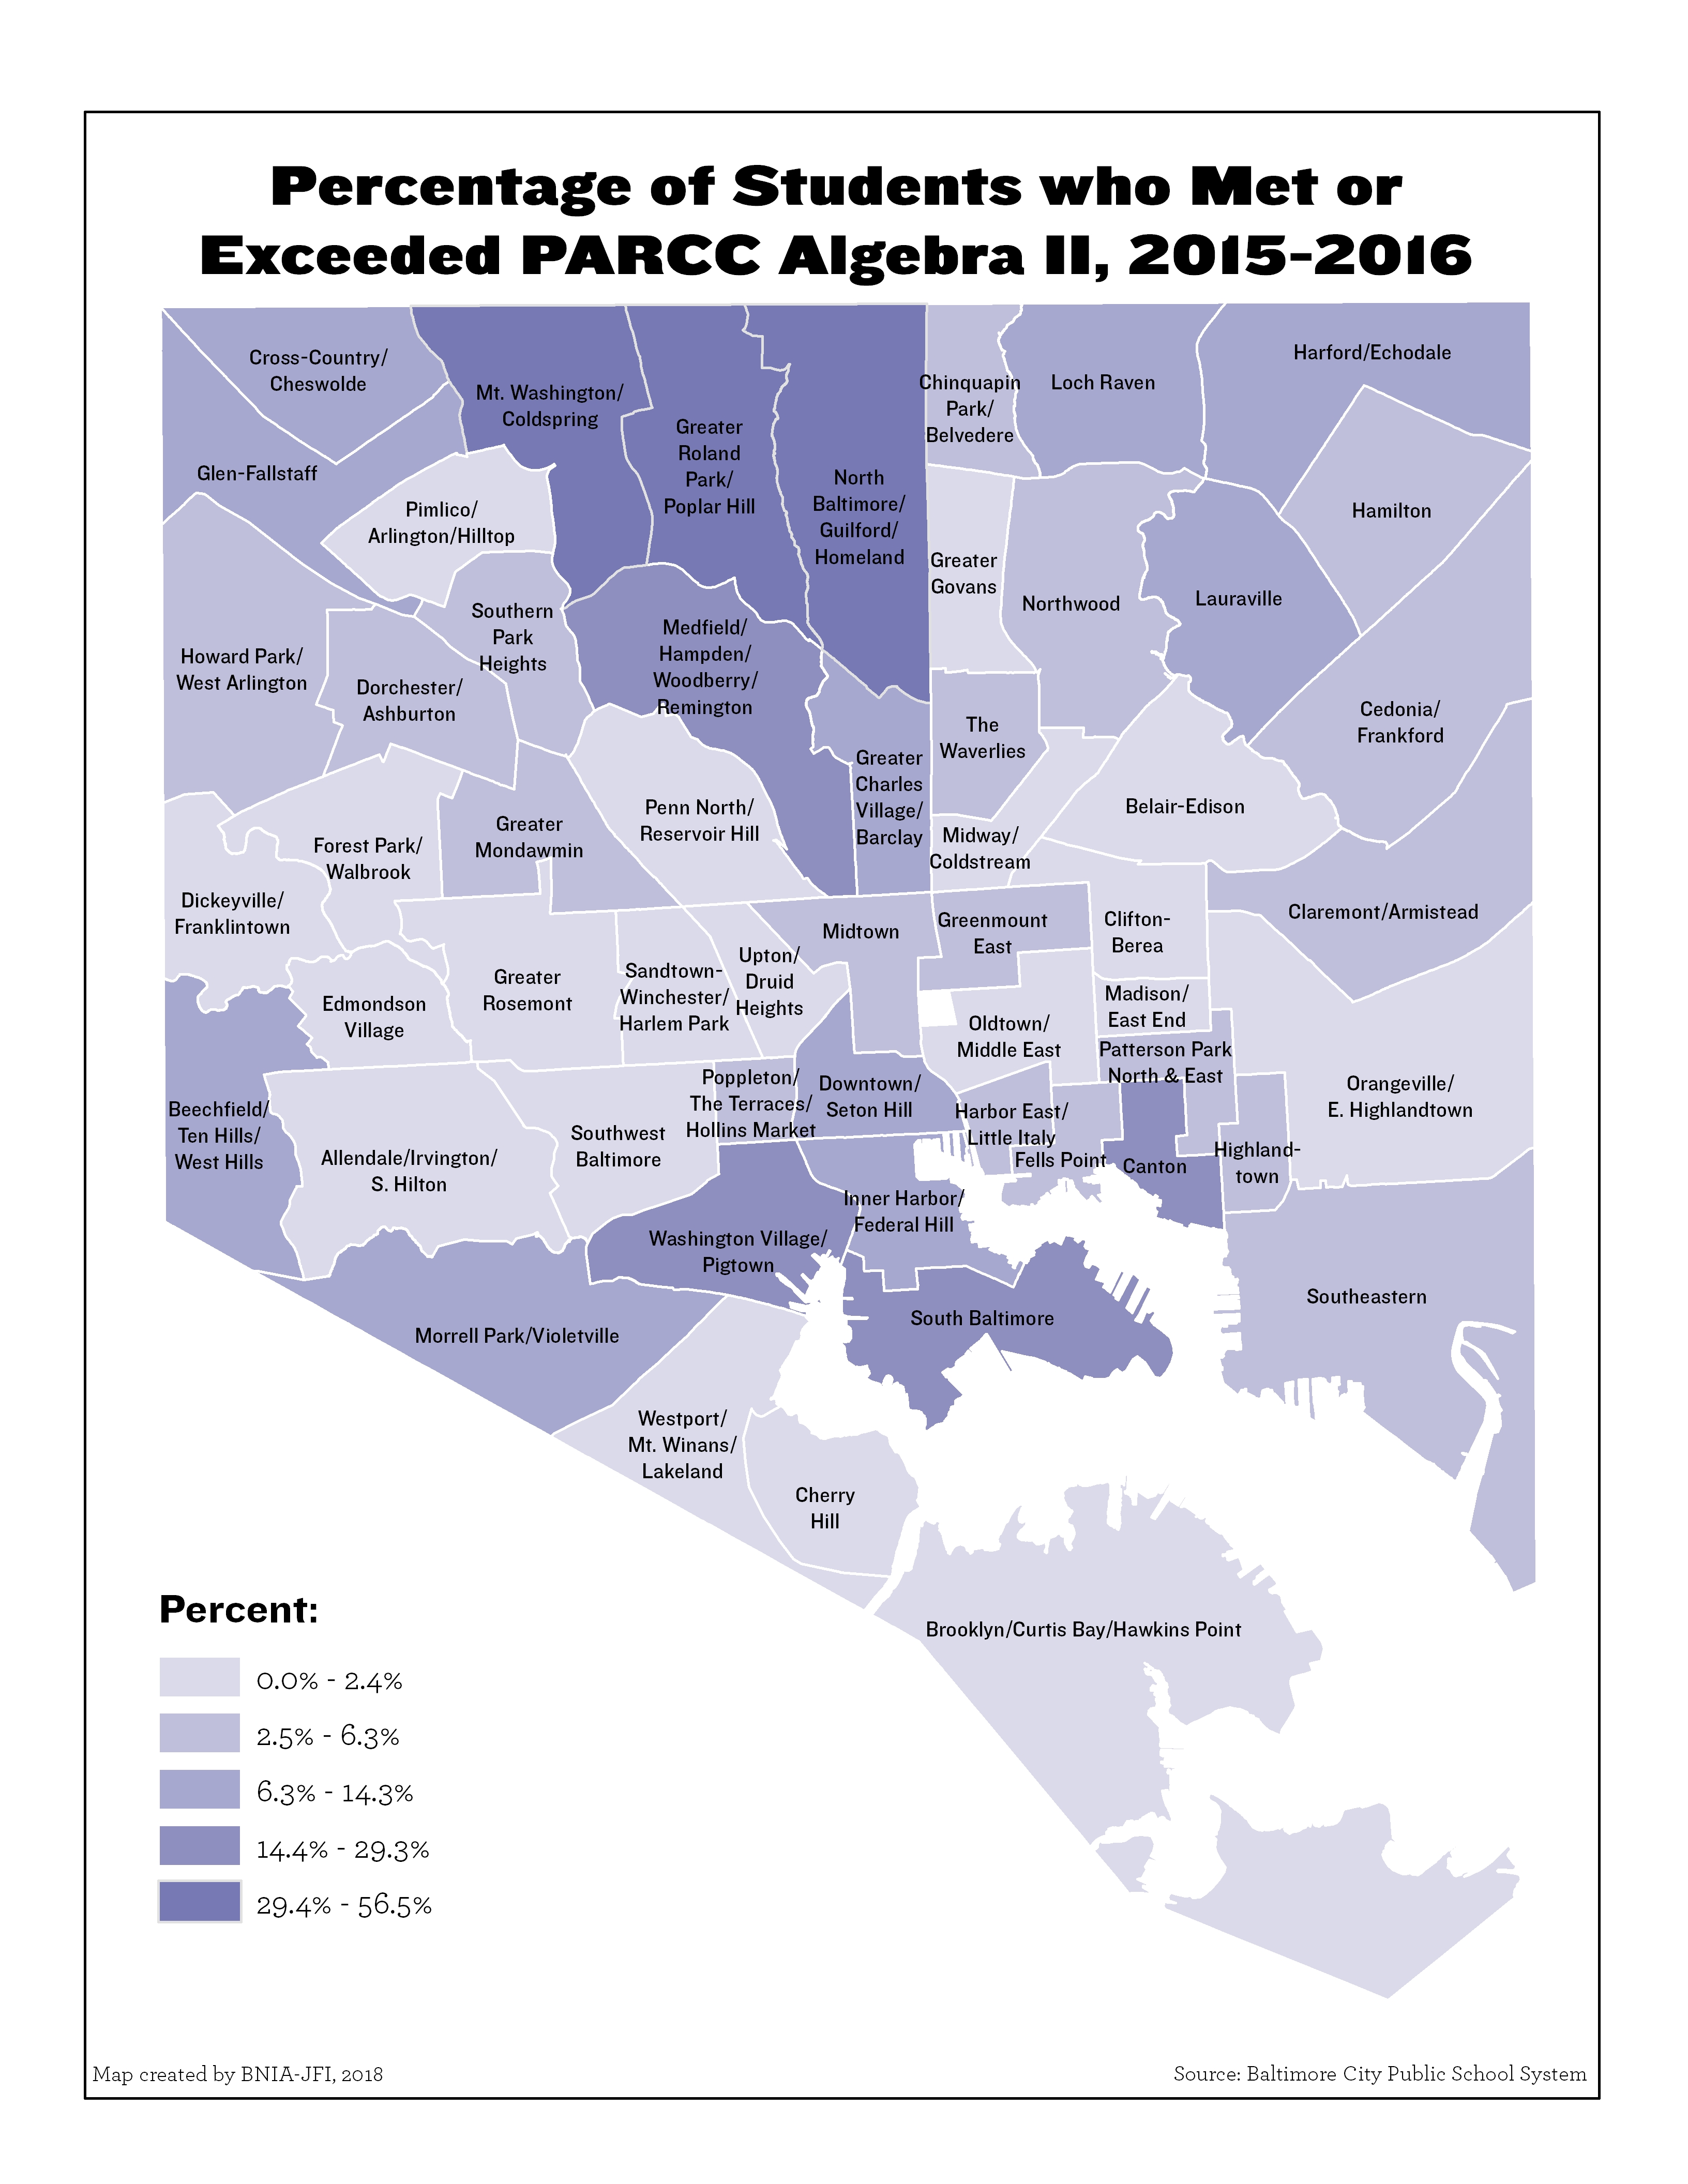
Percentage of Students who met or exceeded PARCC Algebra II
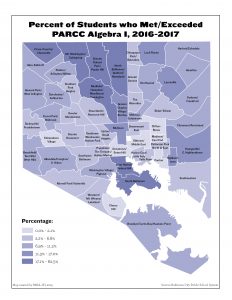
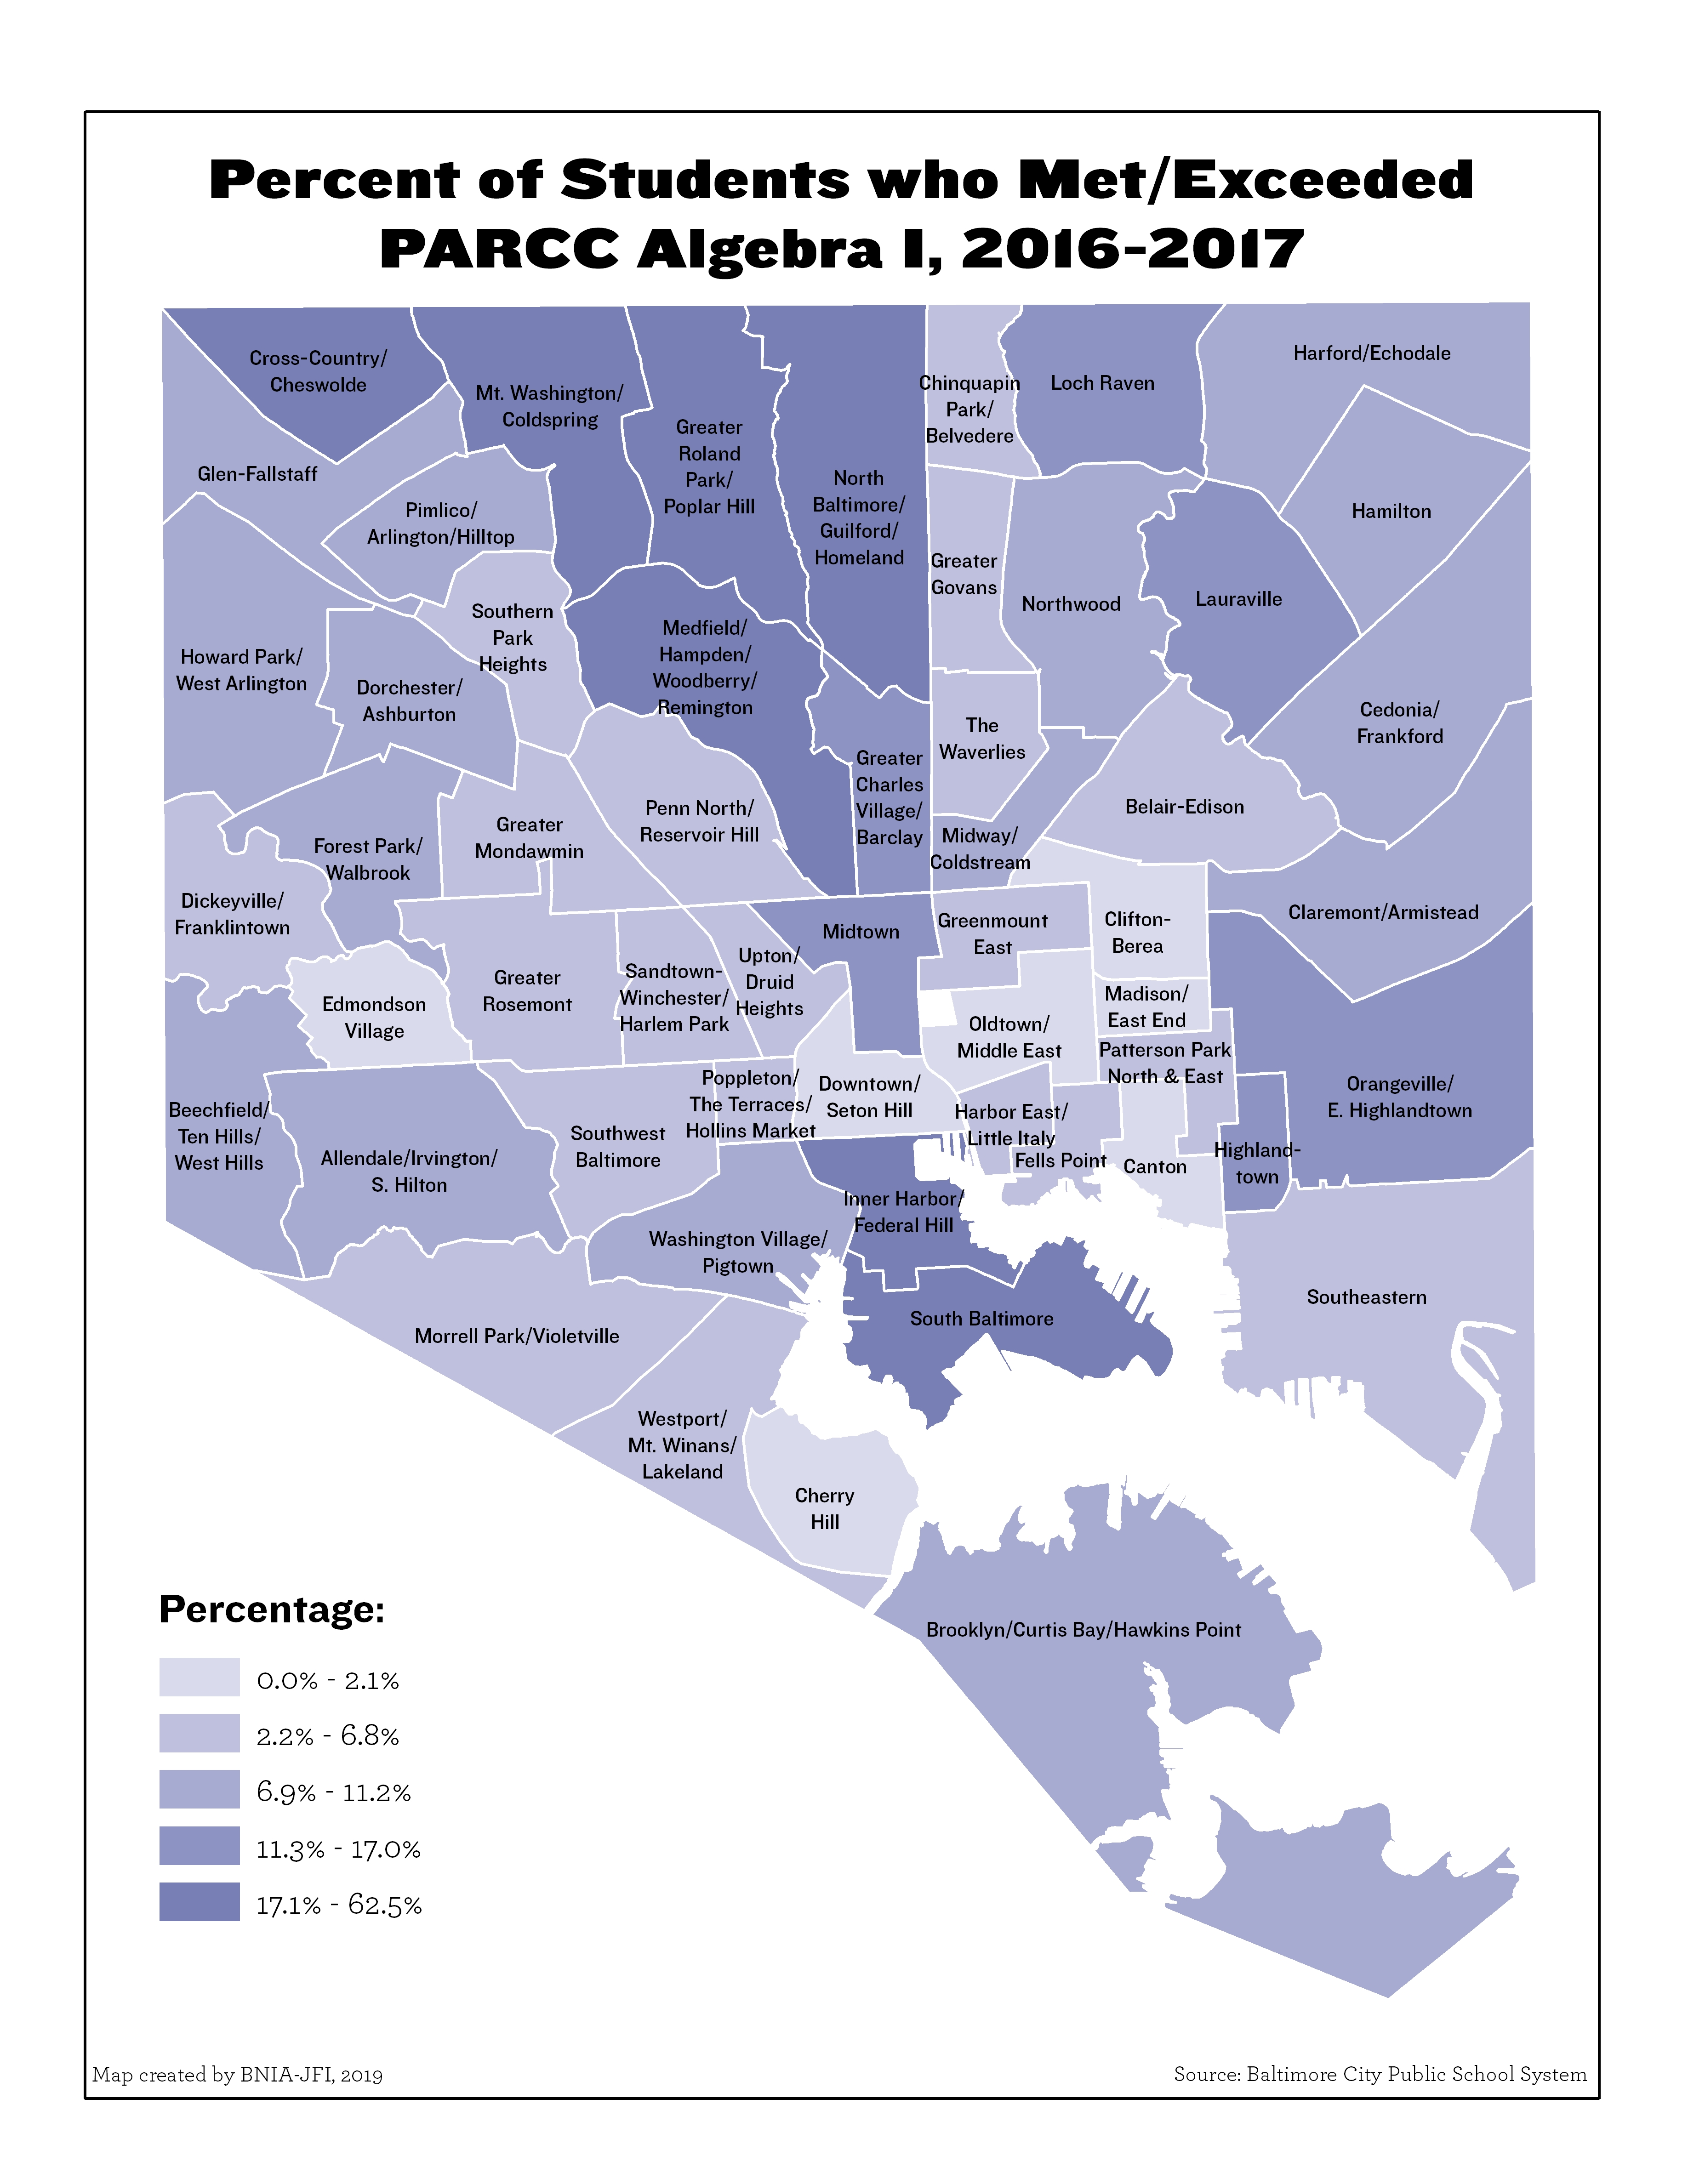
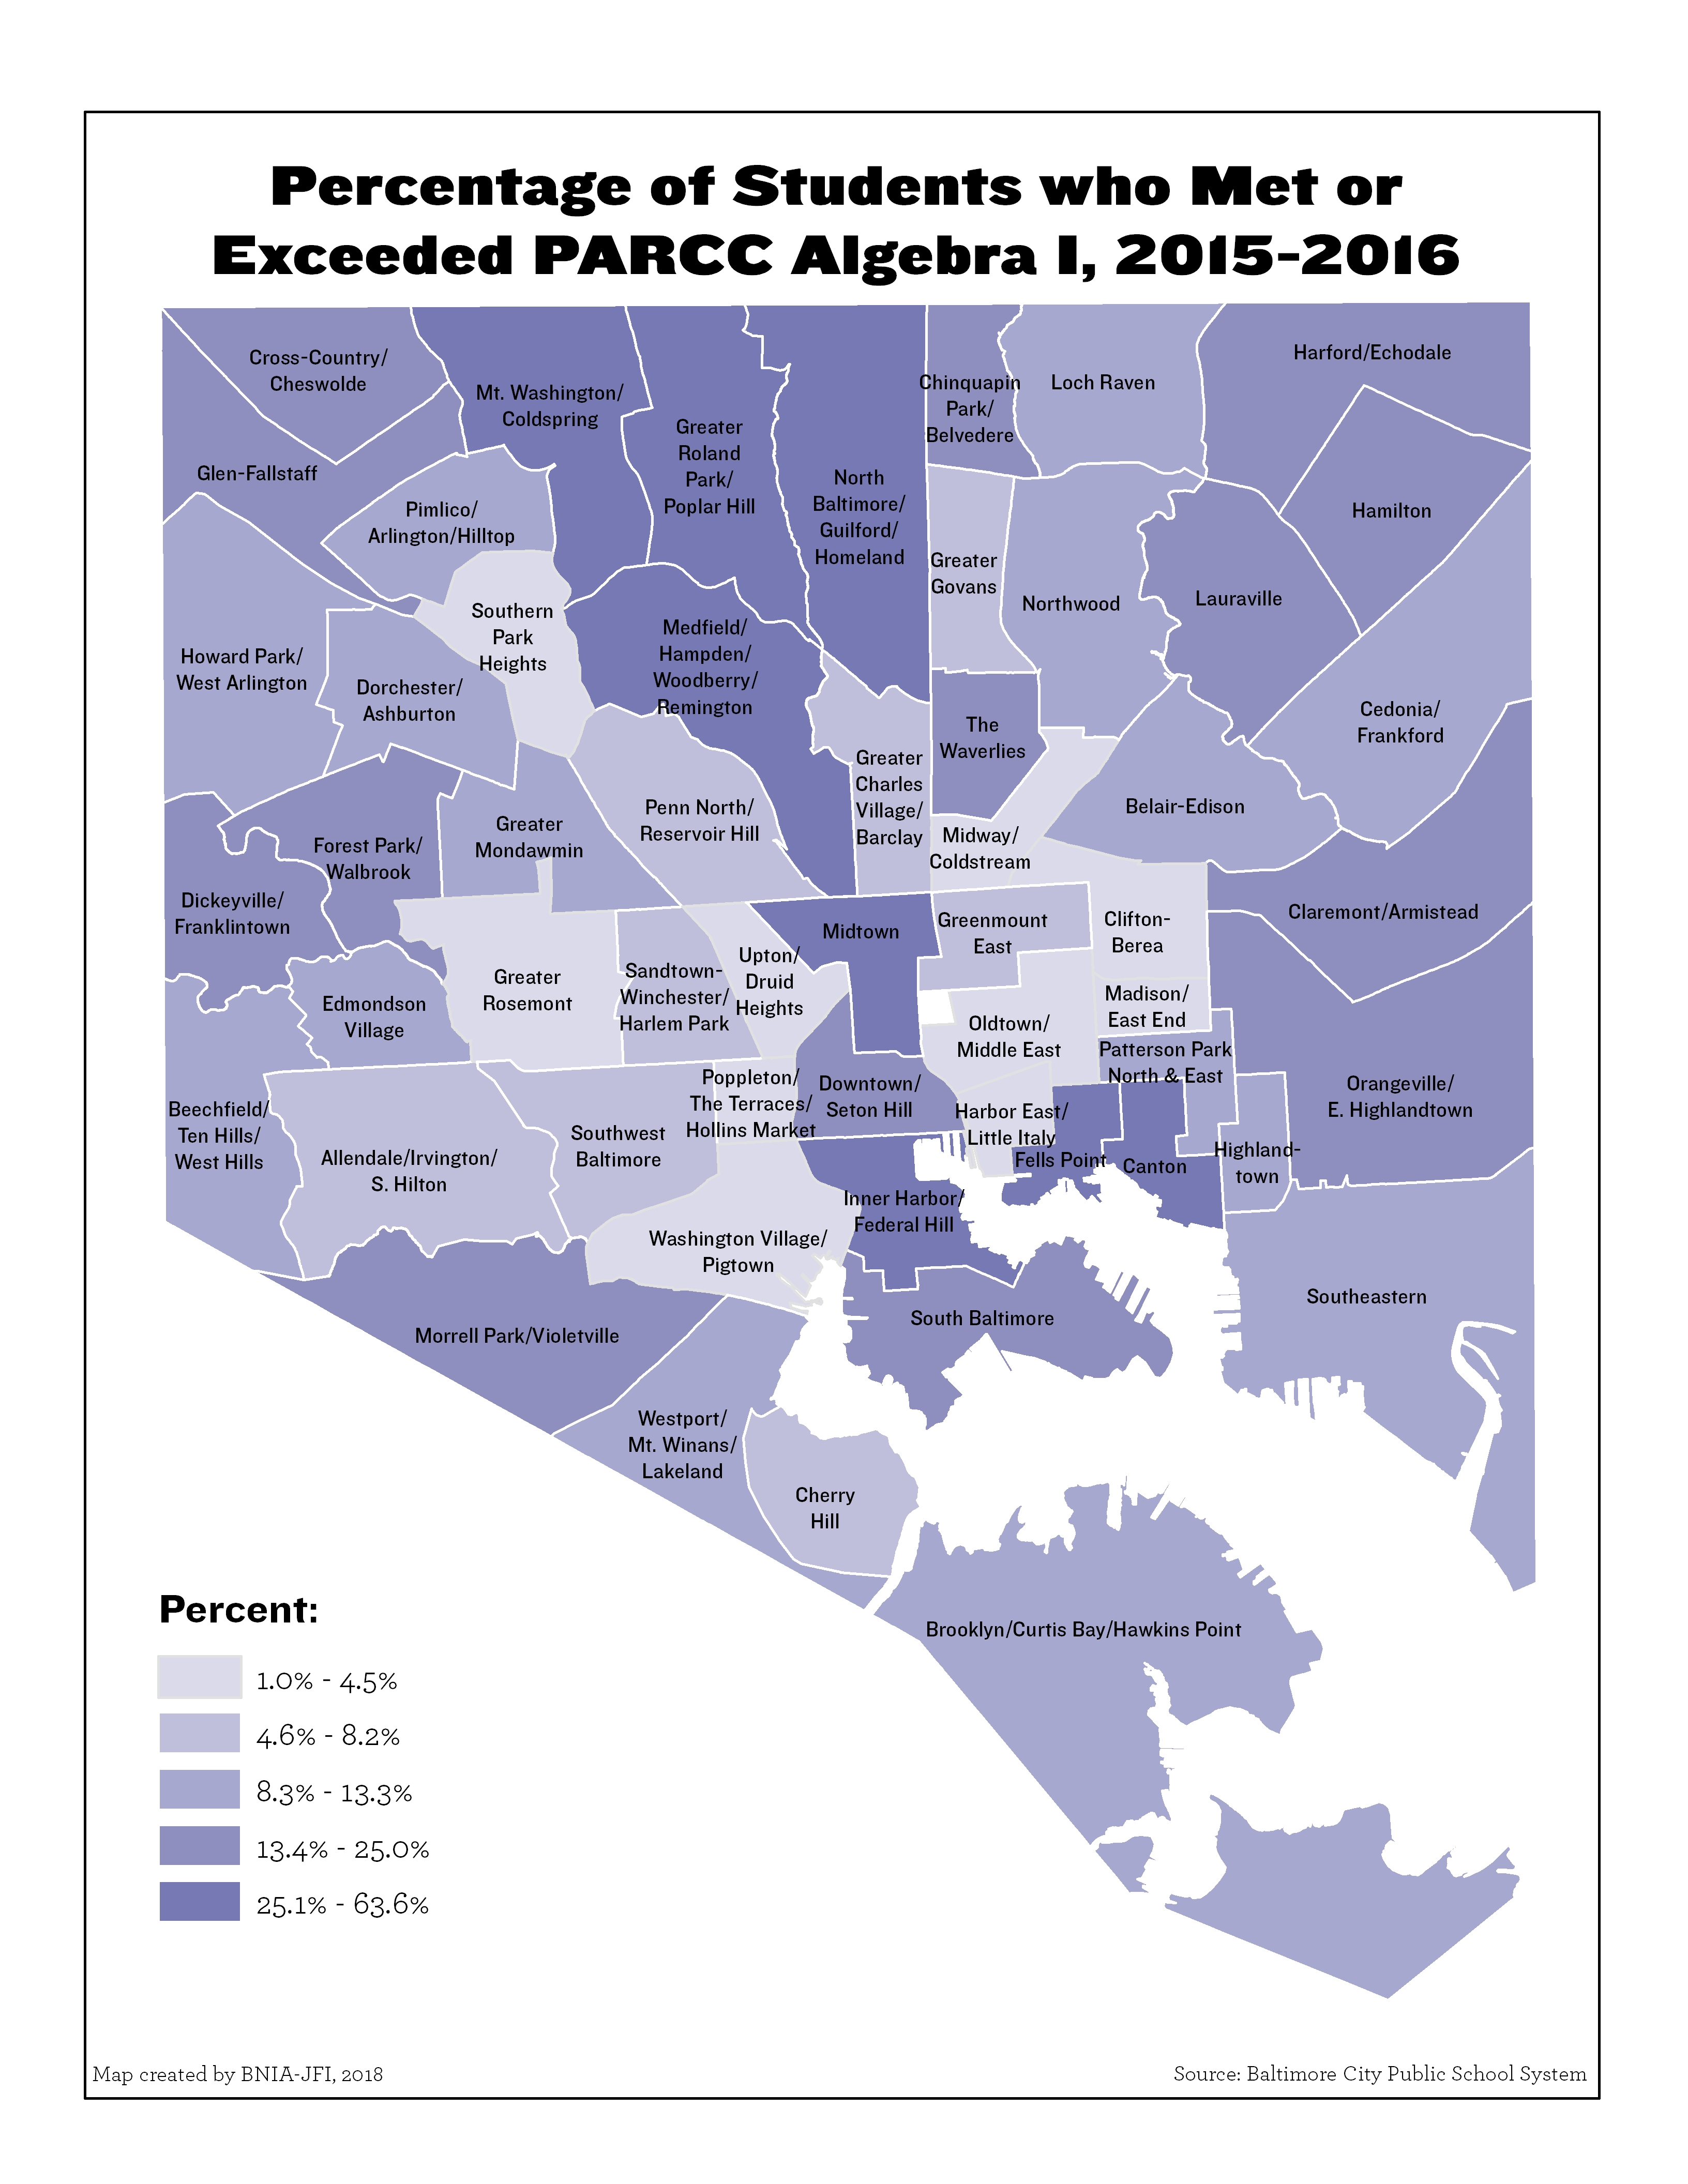
Percentage of Students who met or exceeded PARCC Algebra I

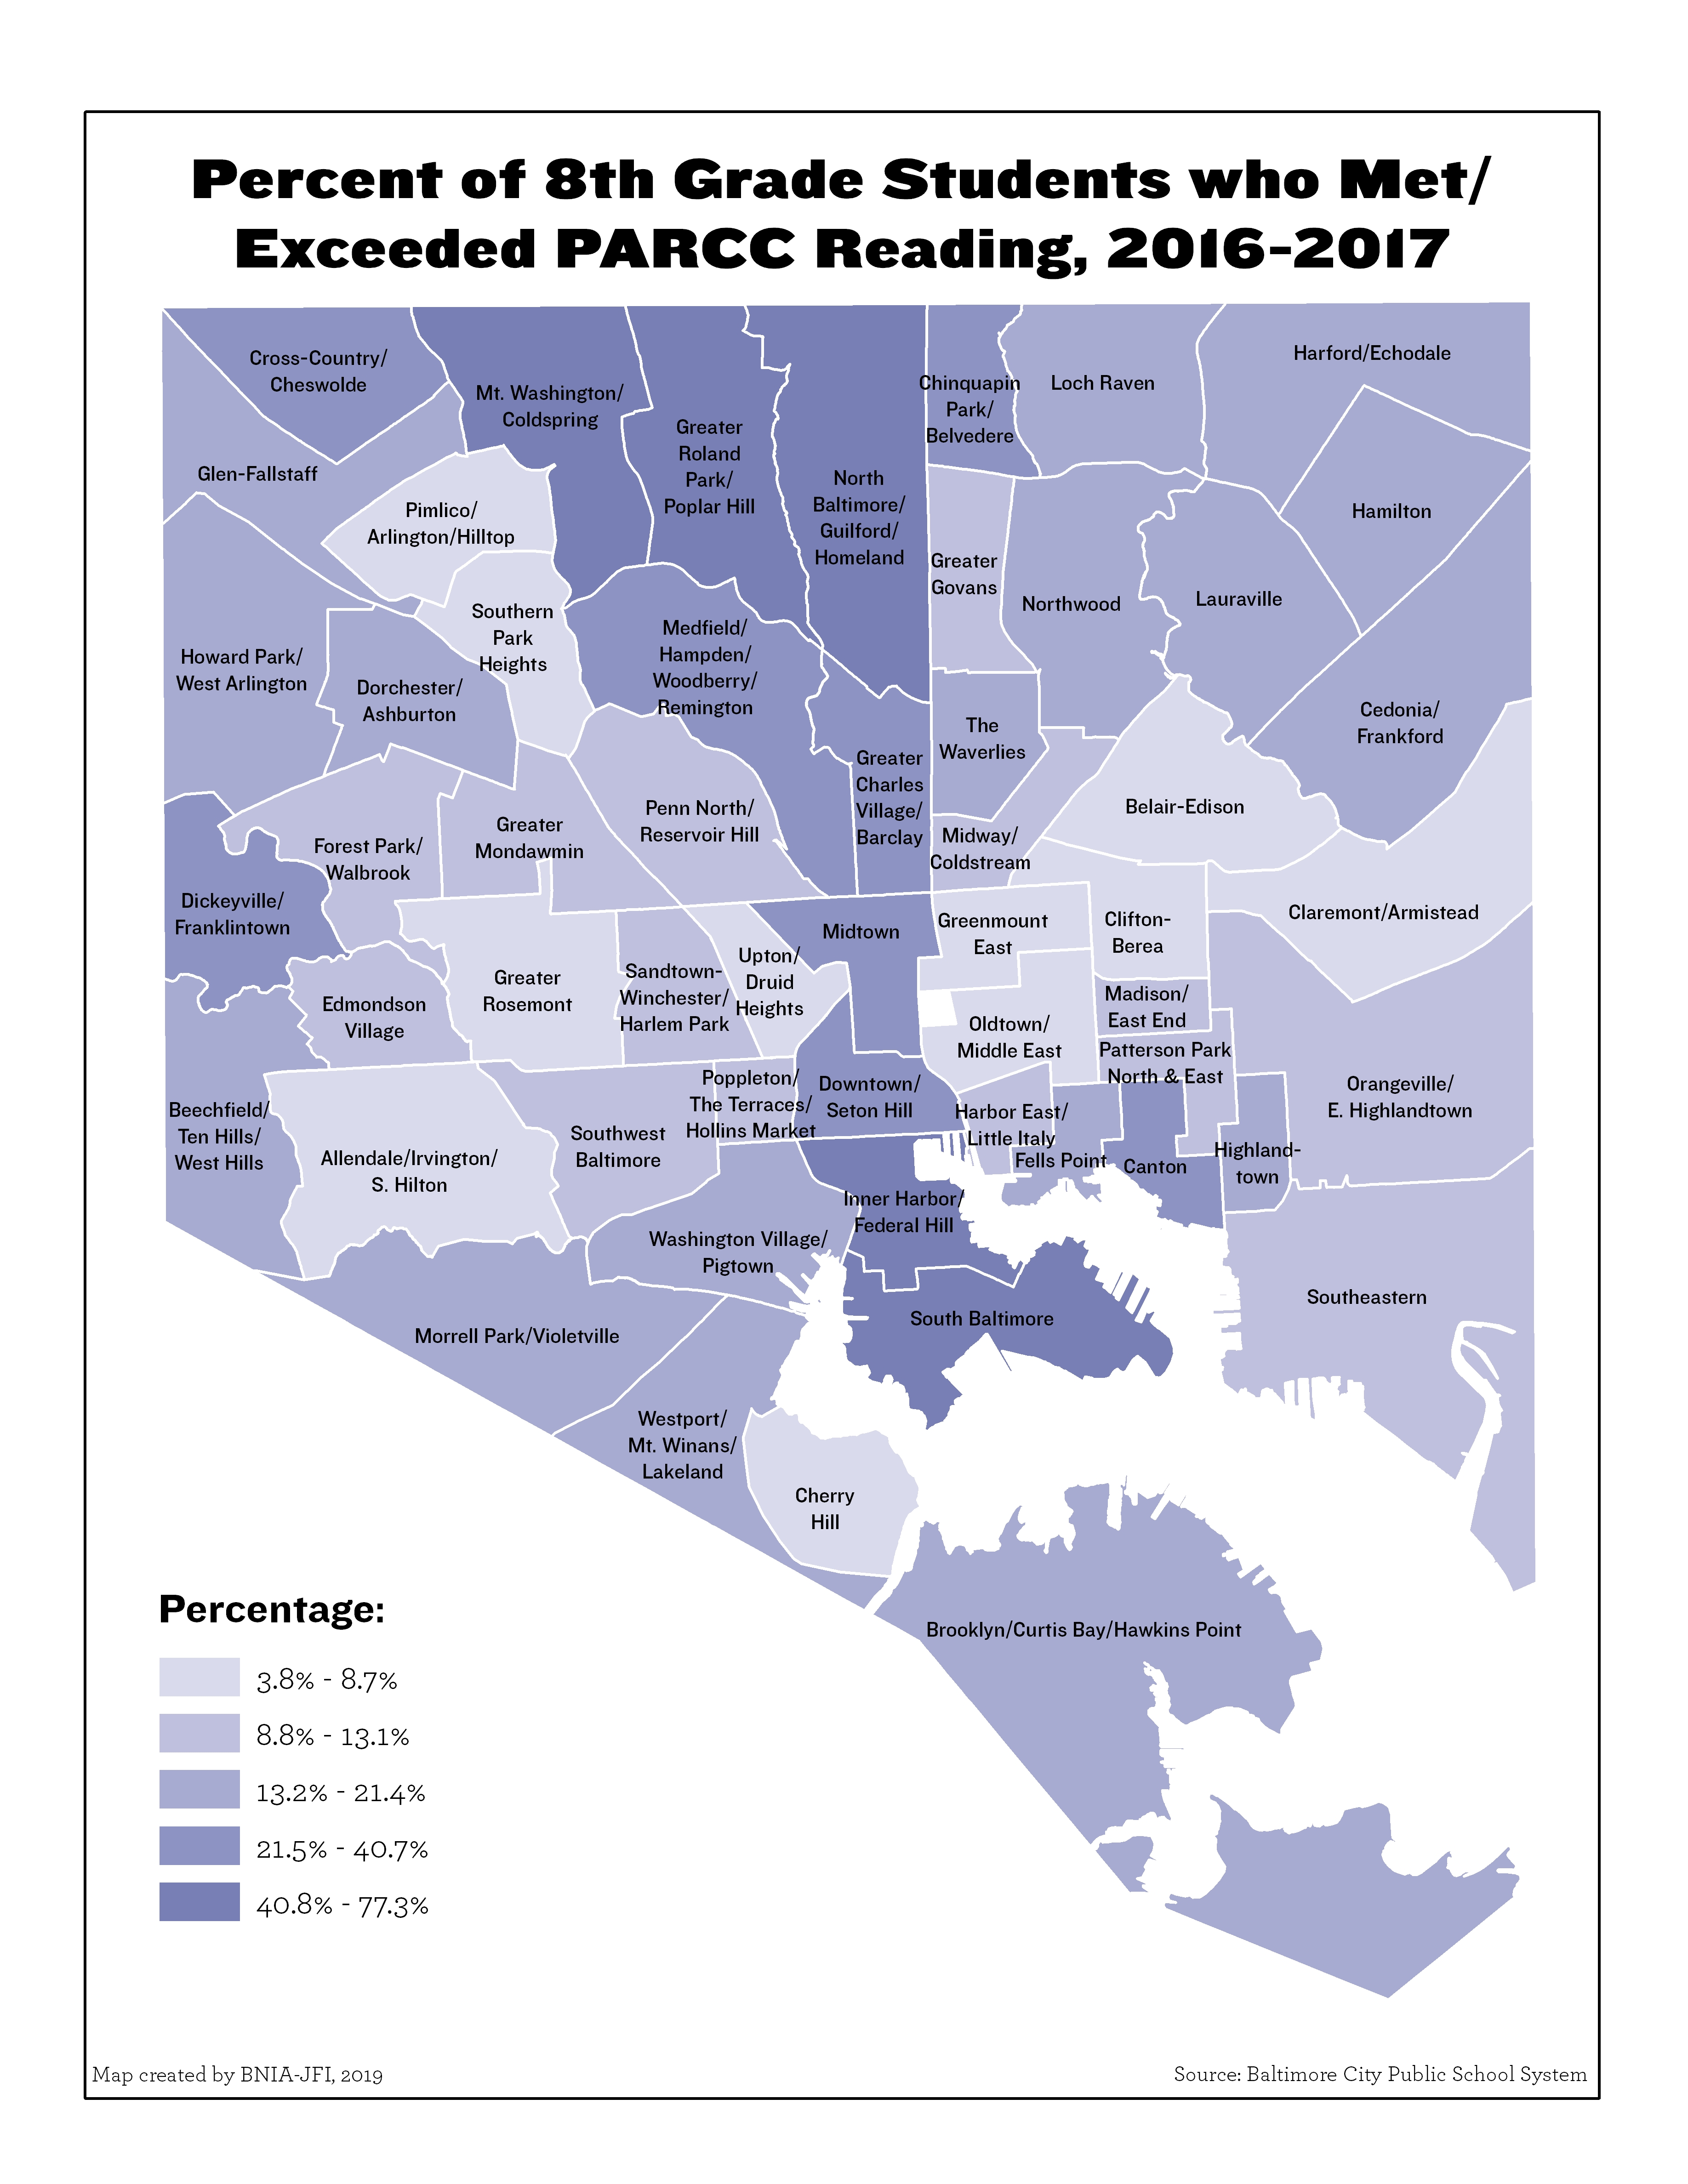
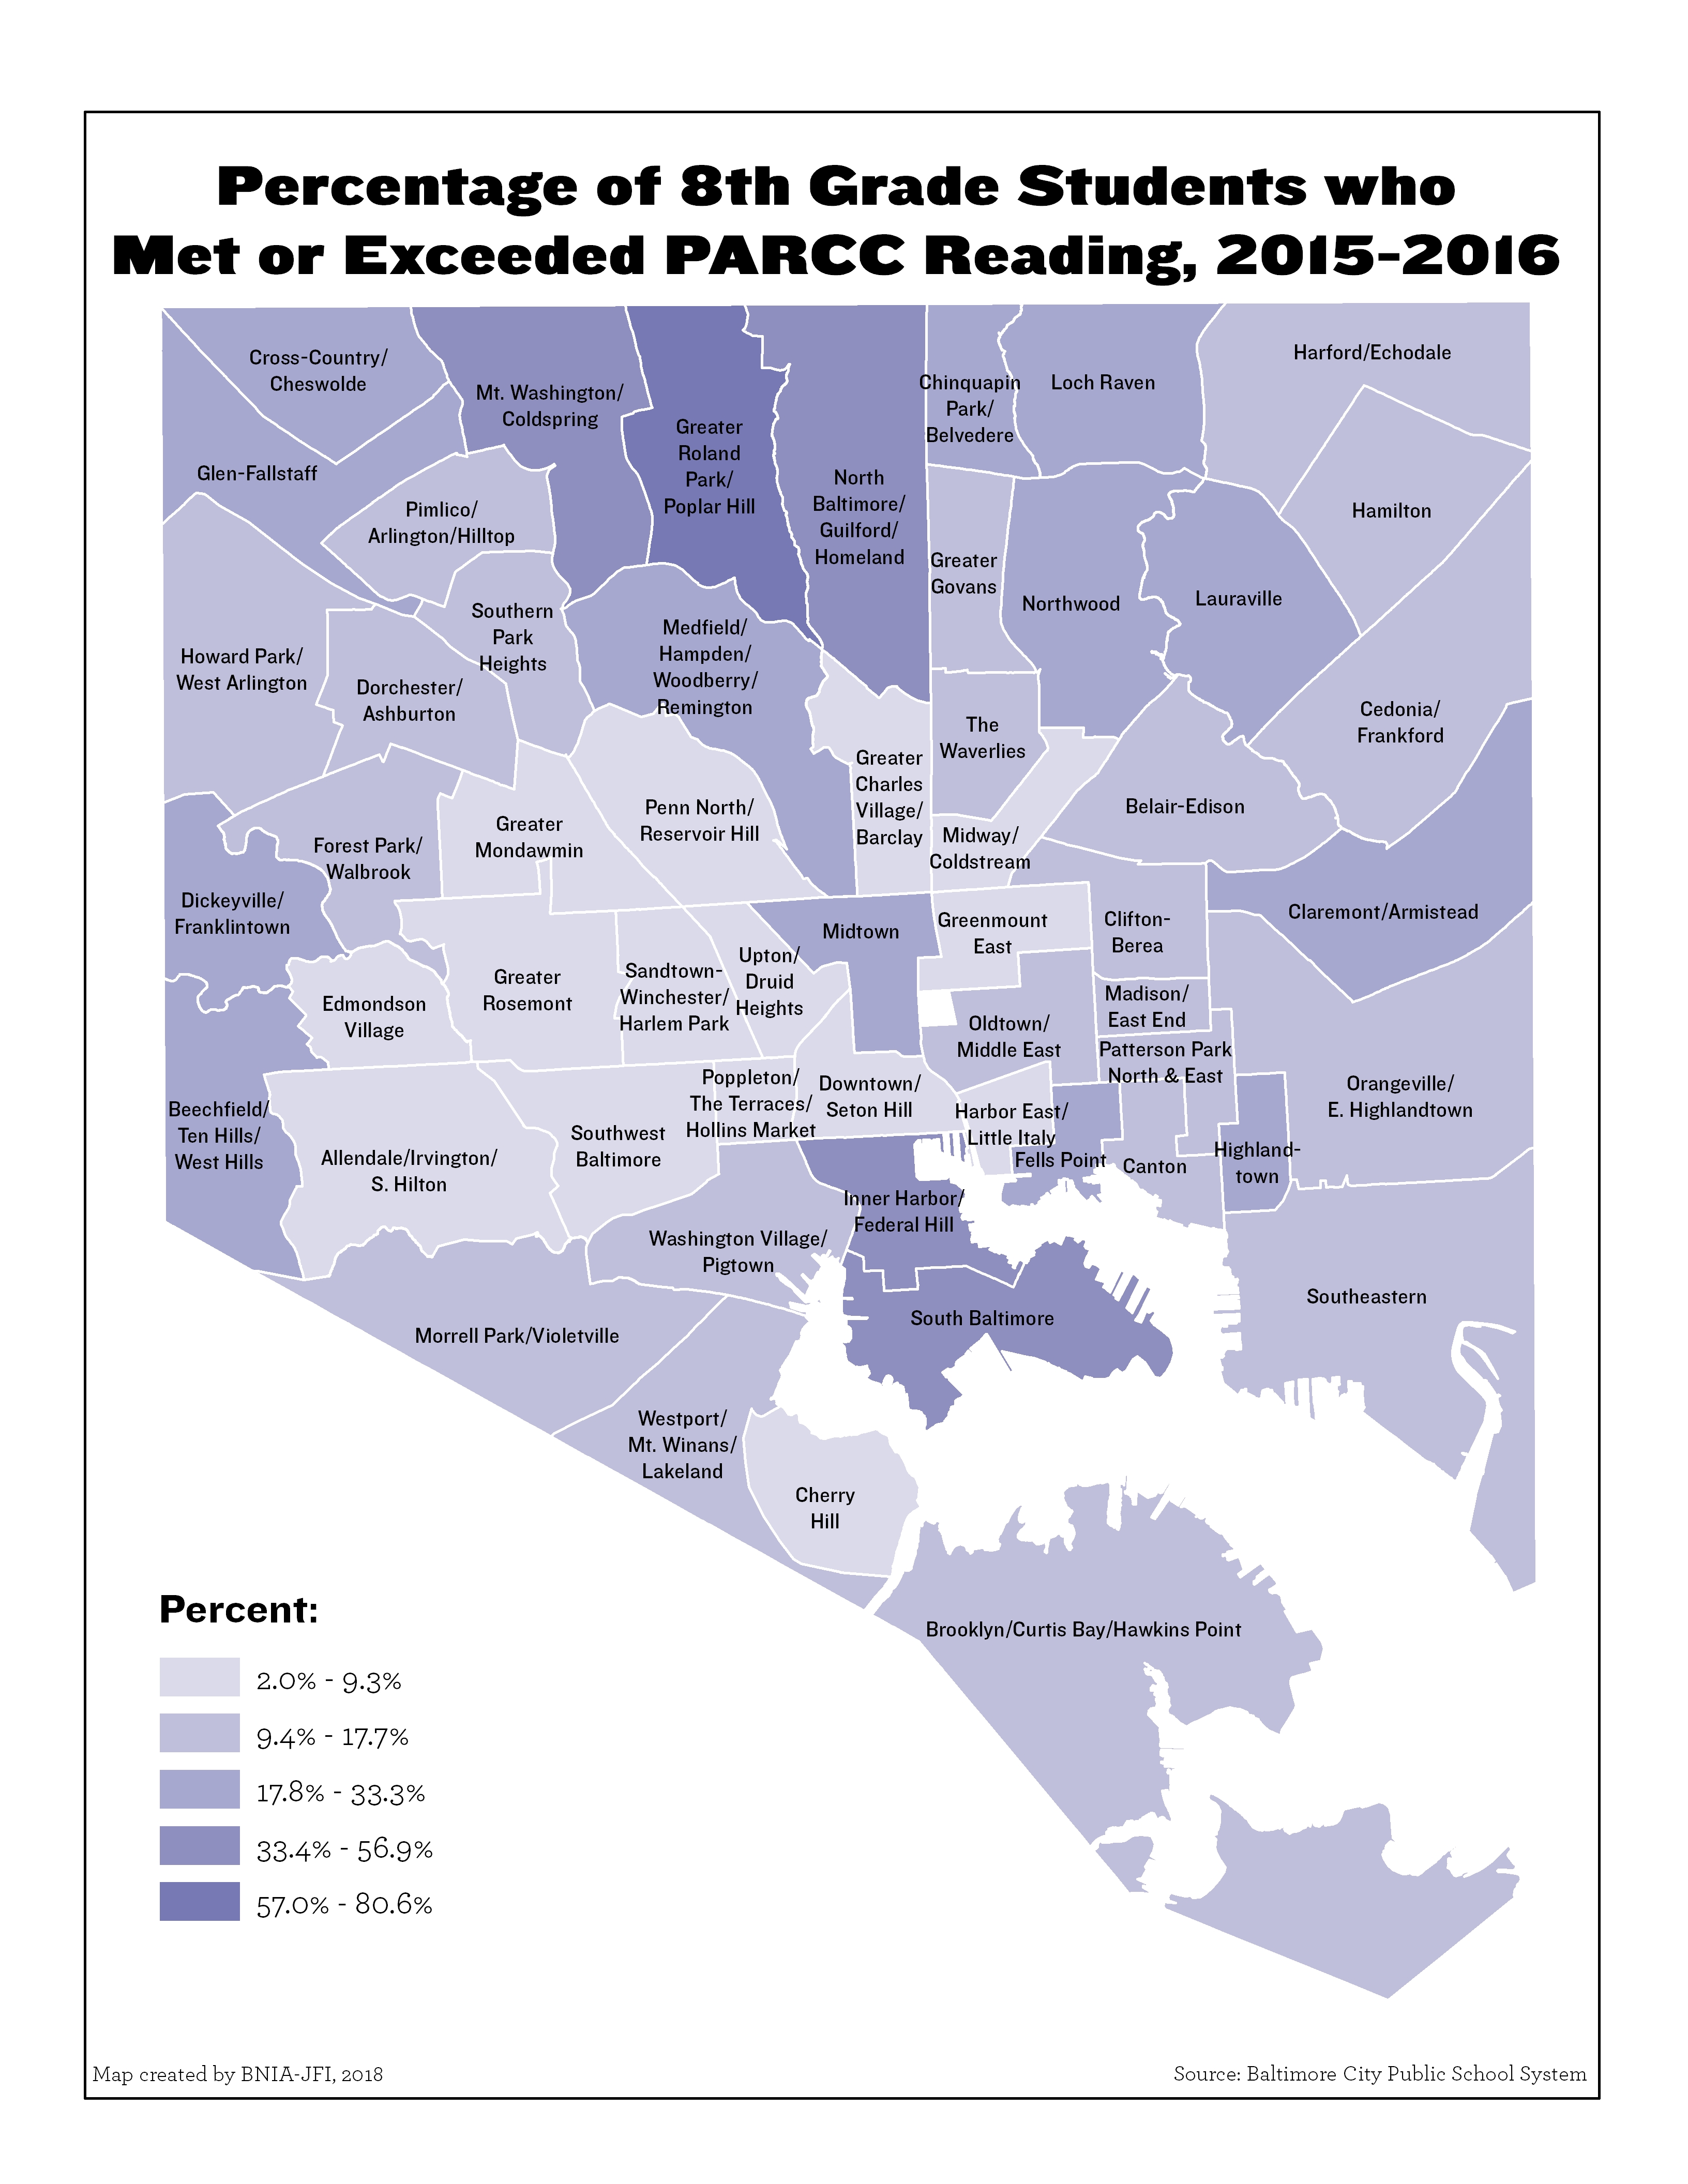
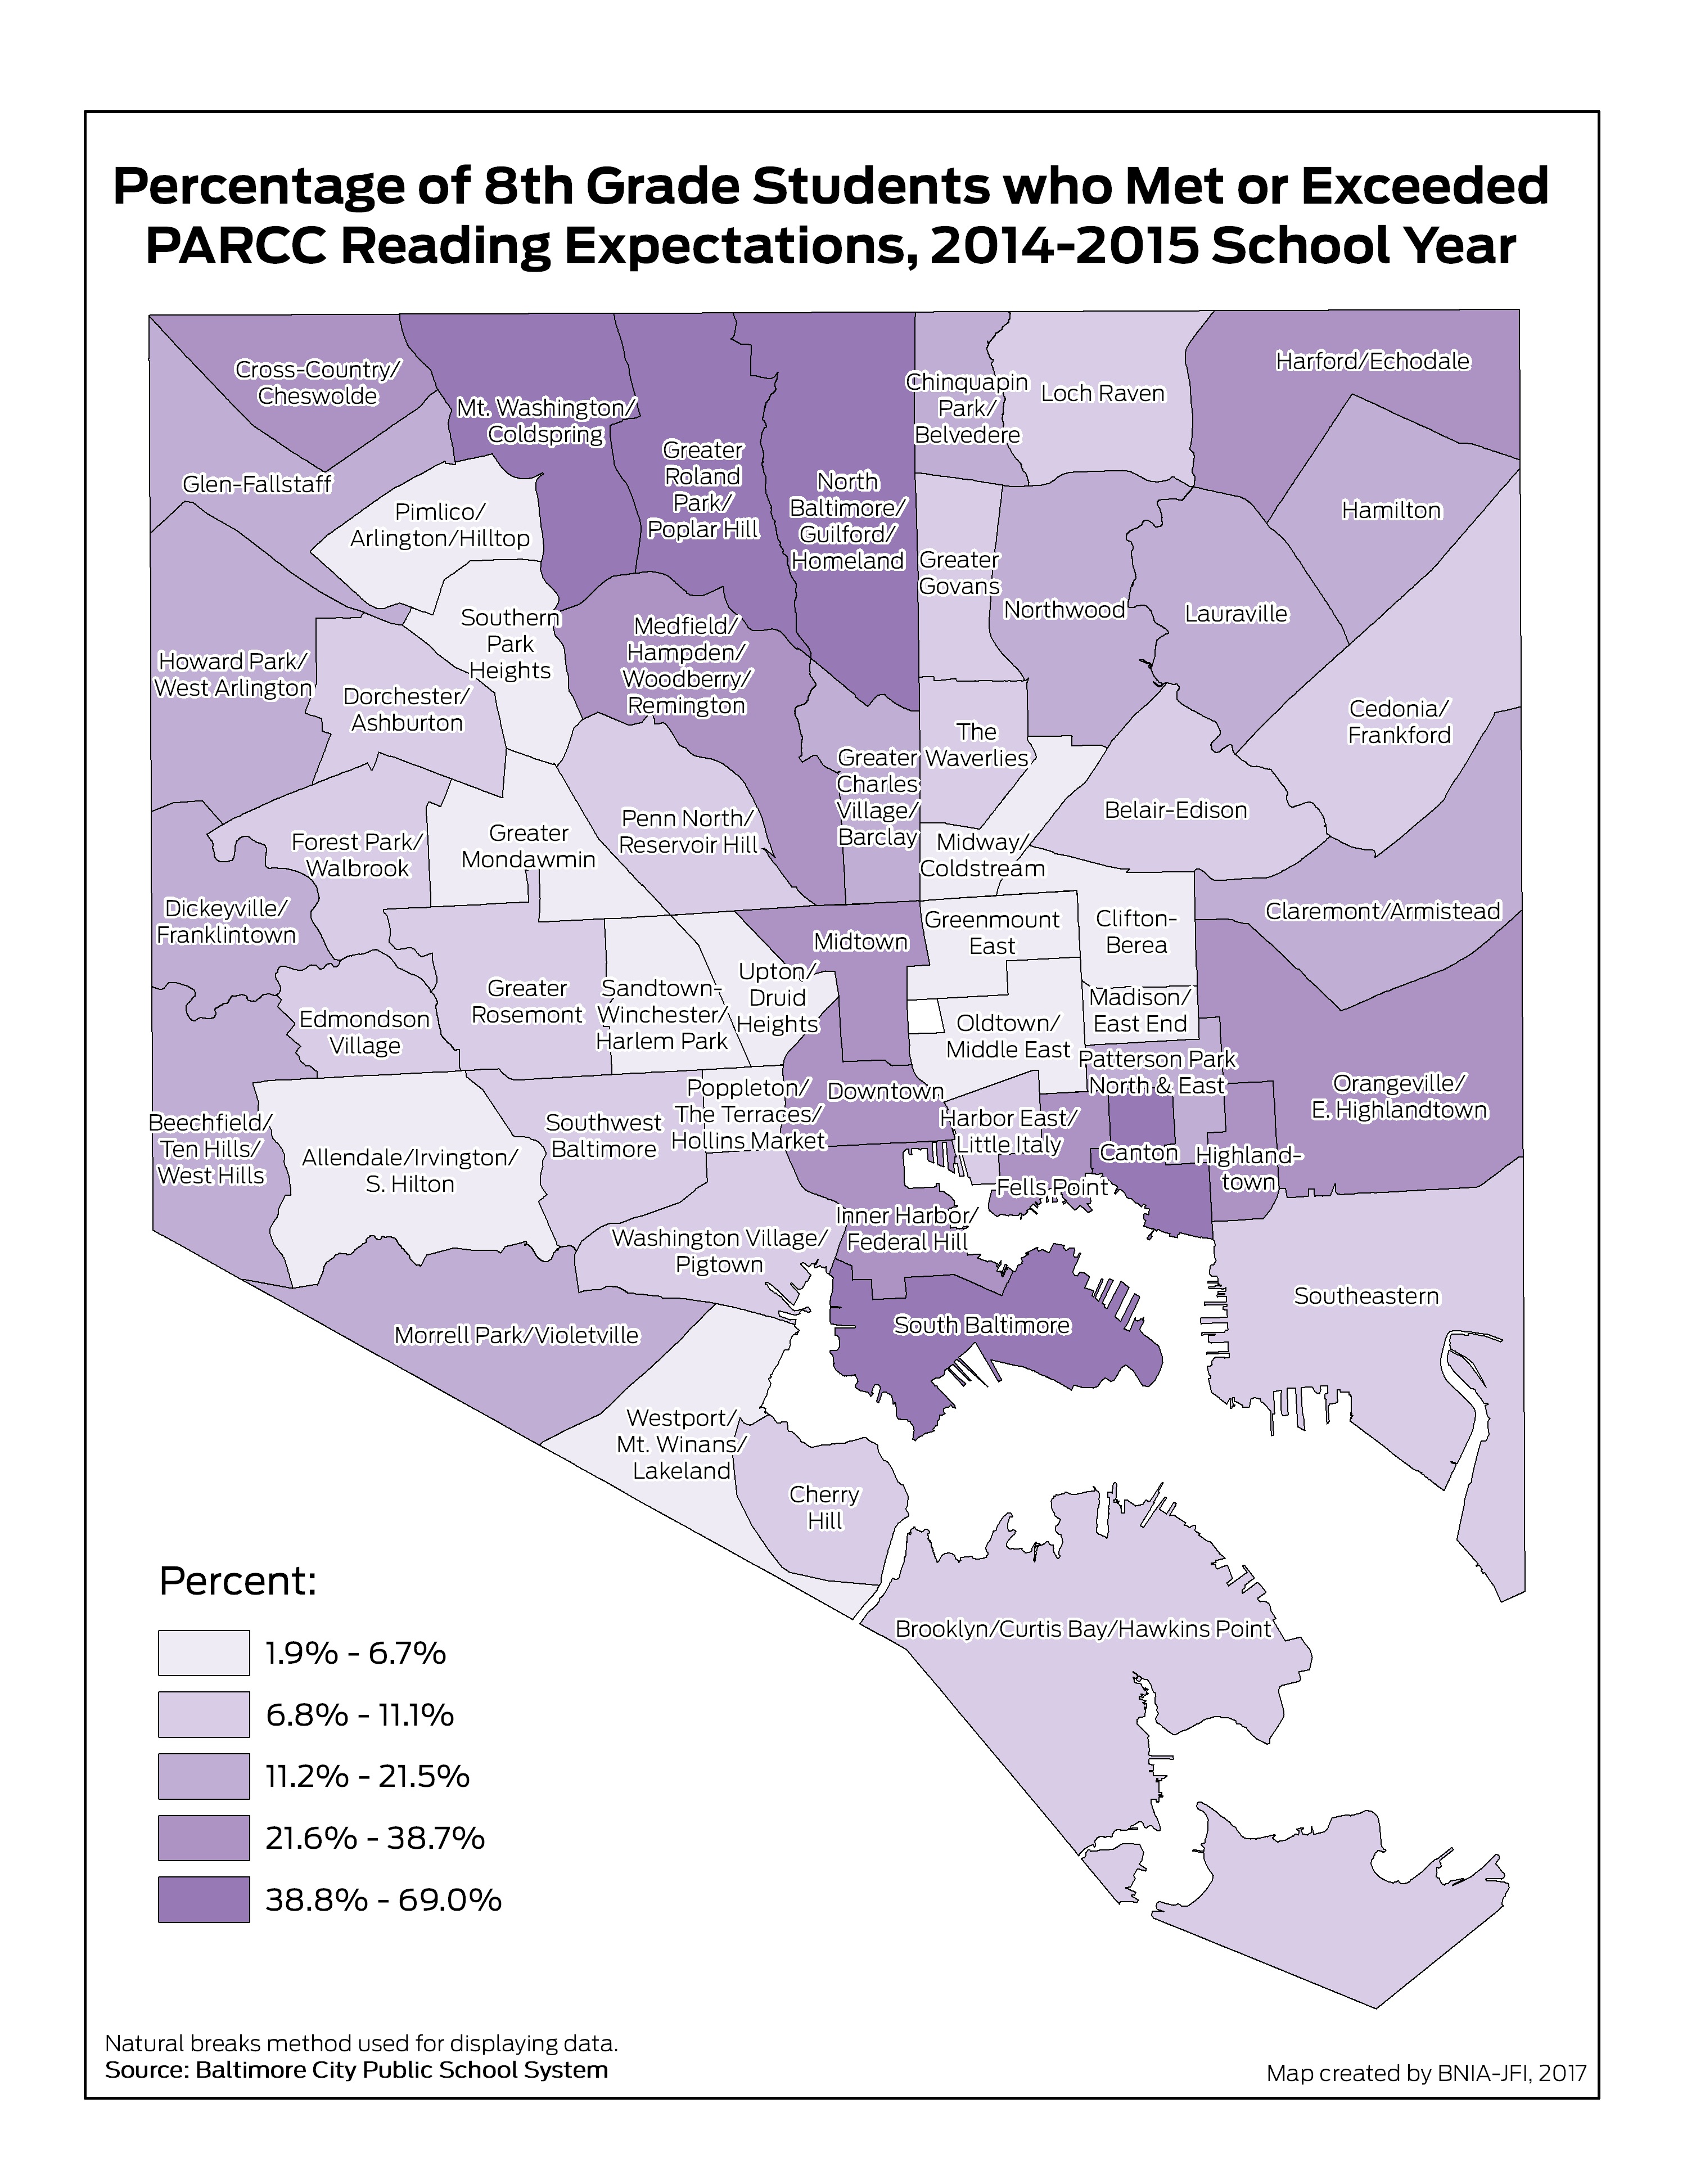
Percentage of 8th Grade Students Passing PARCC Reading
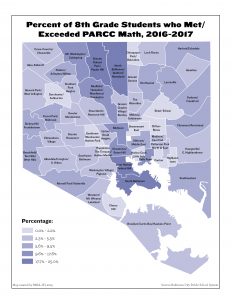
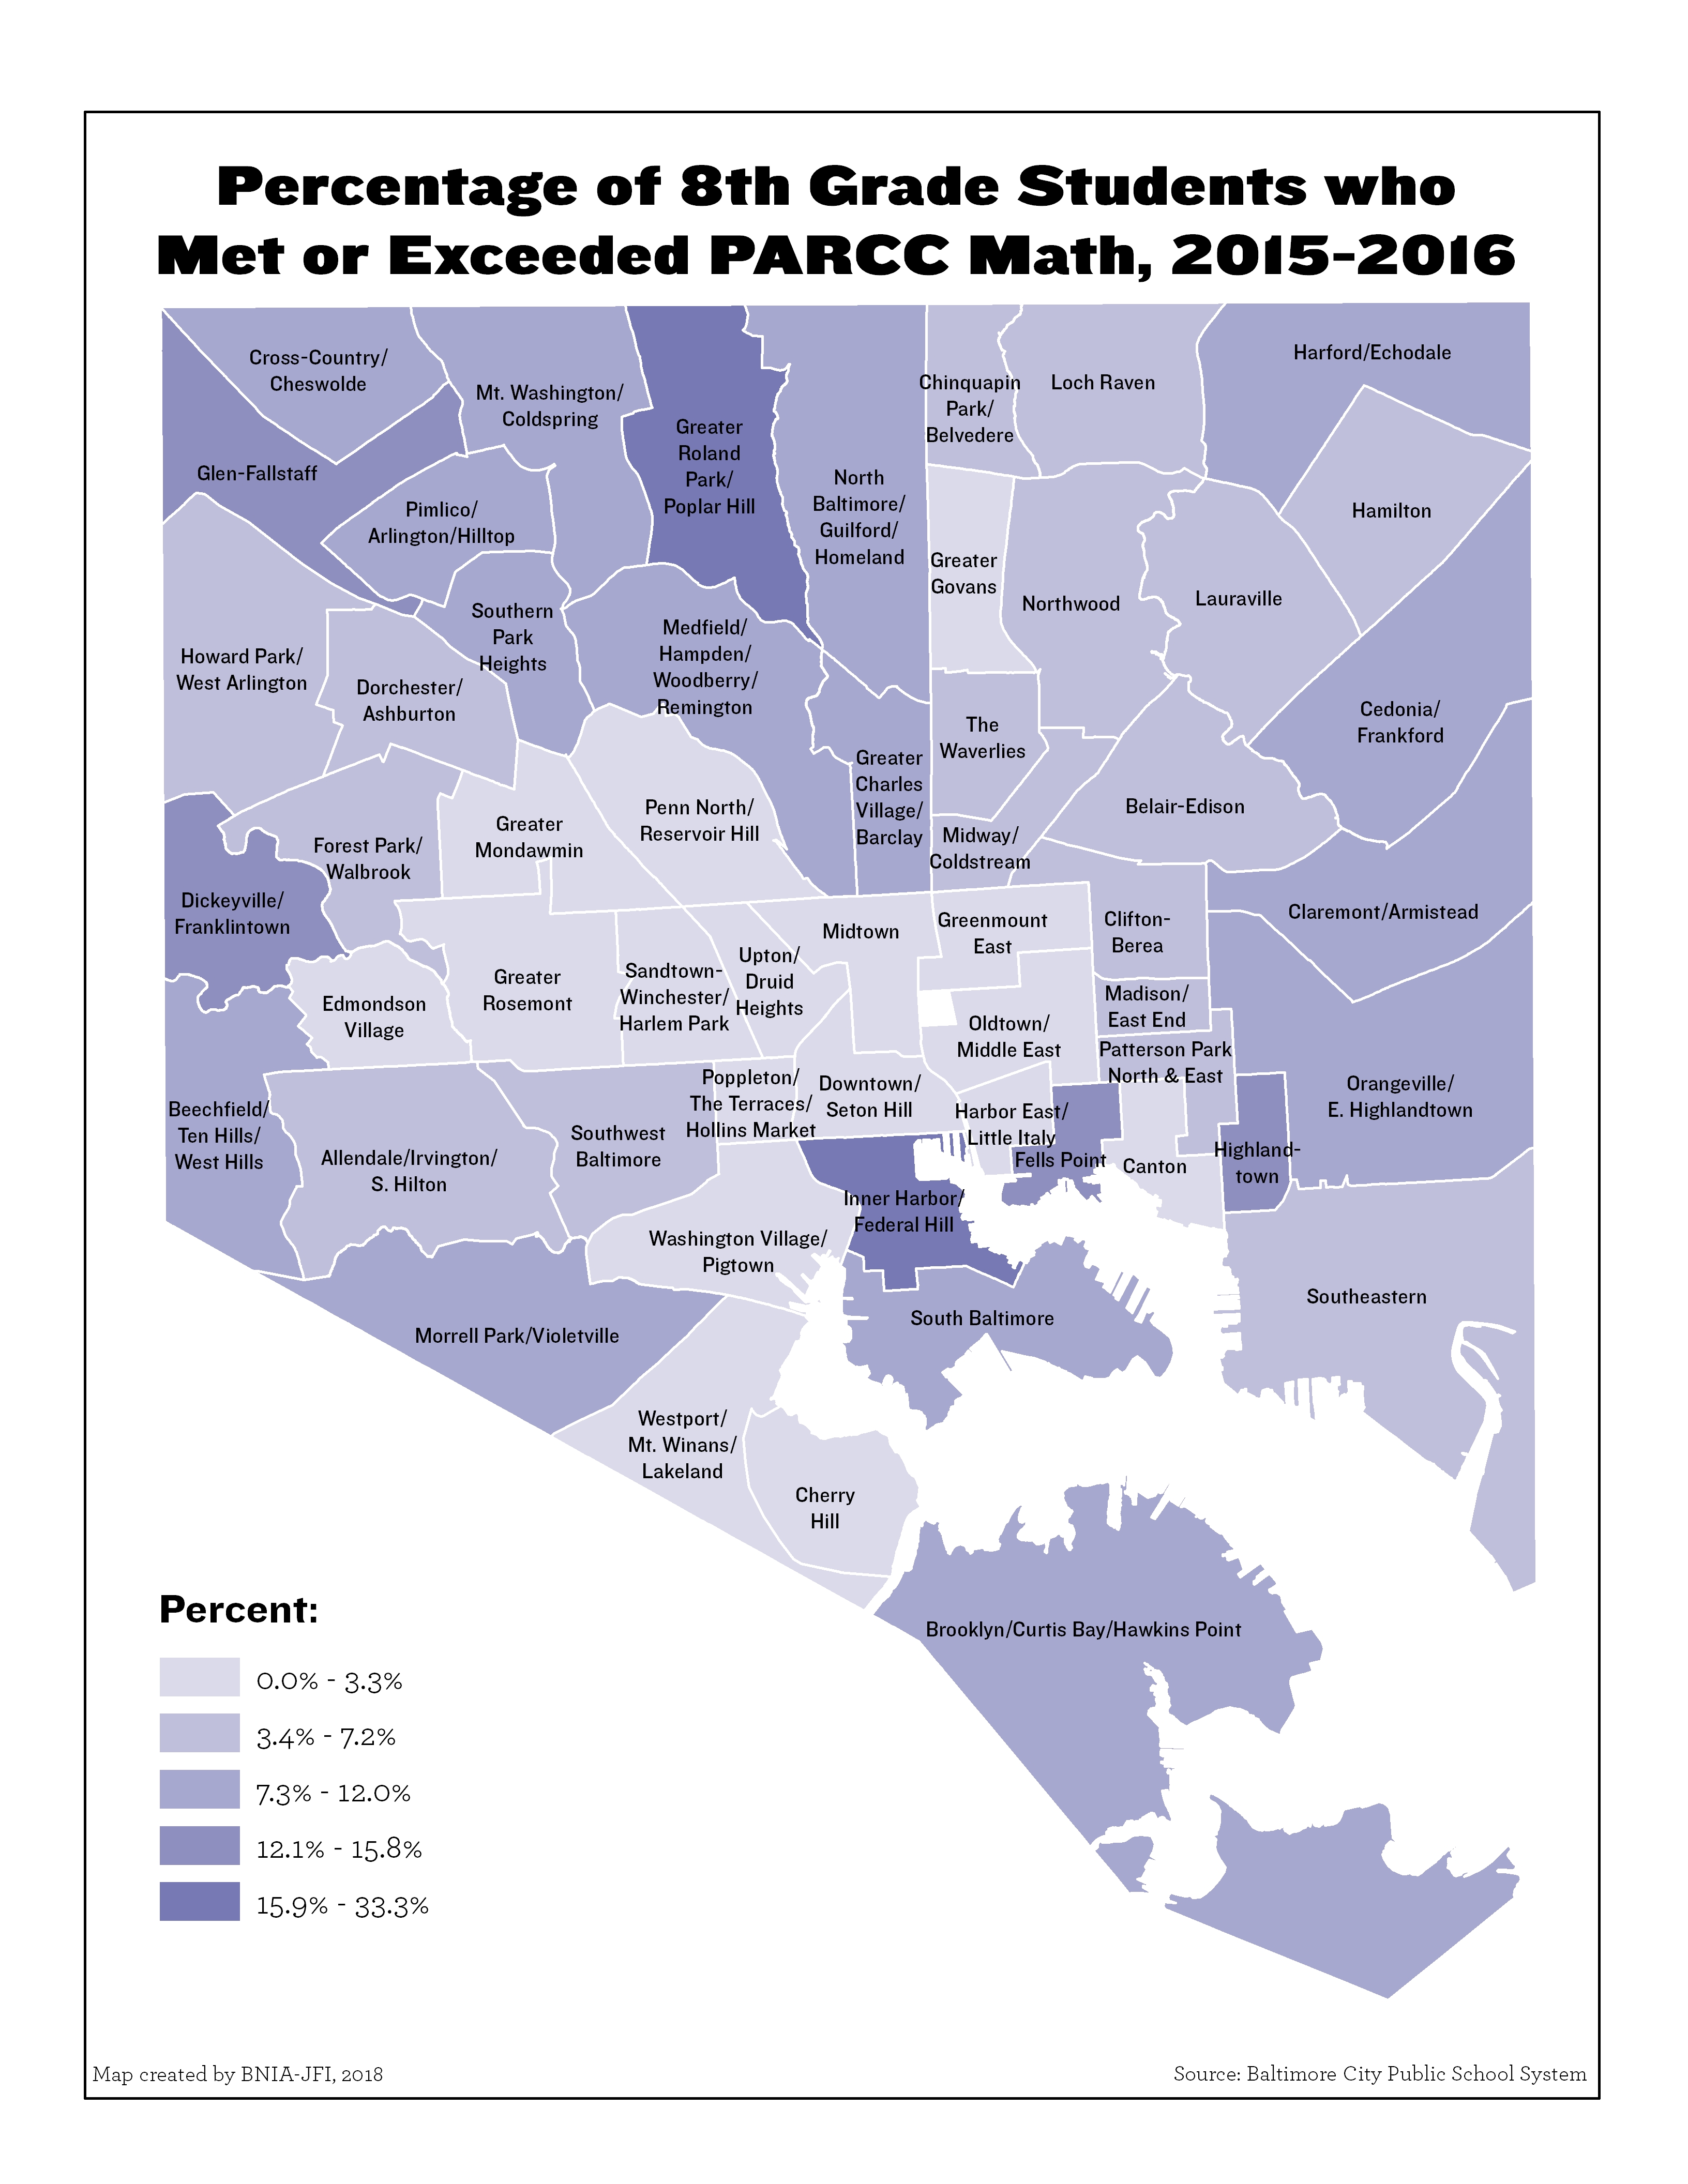
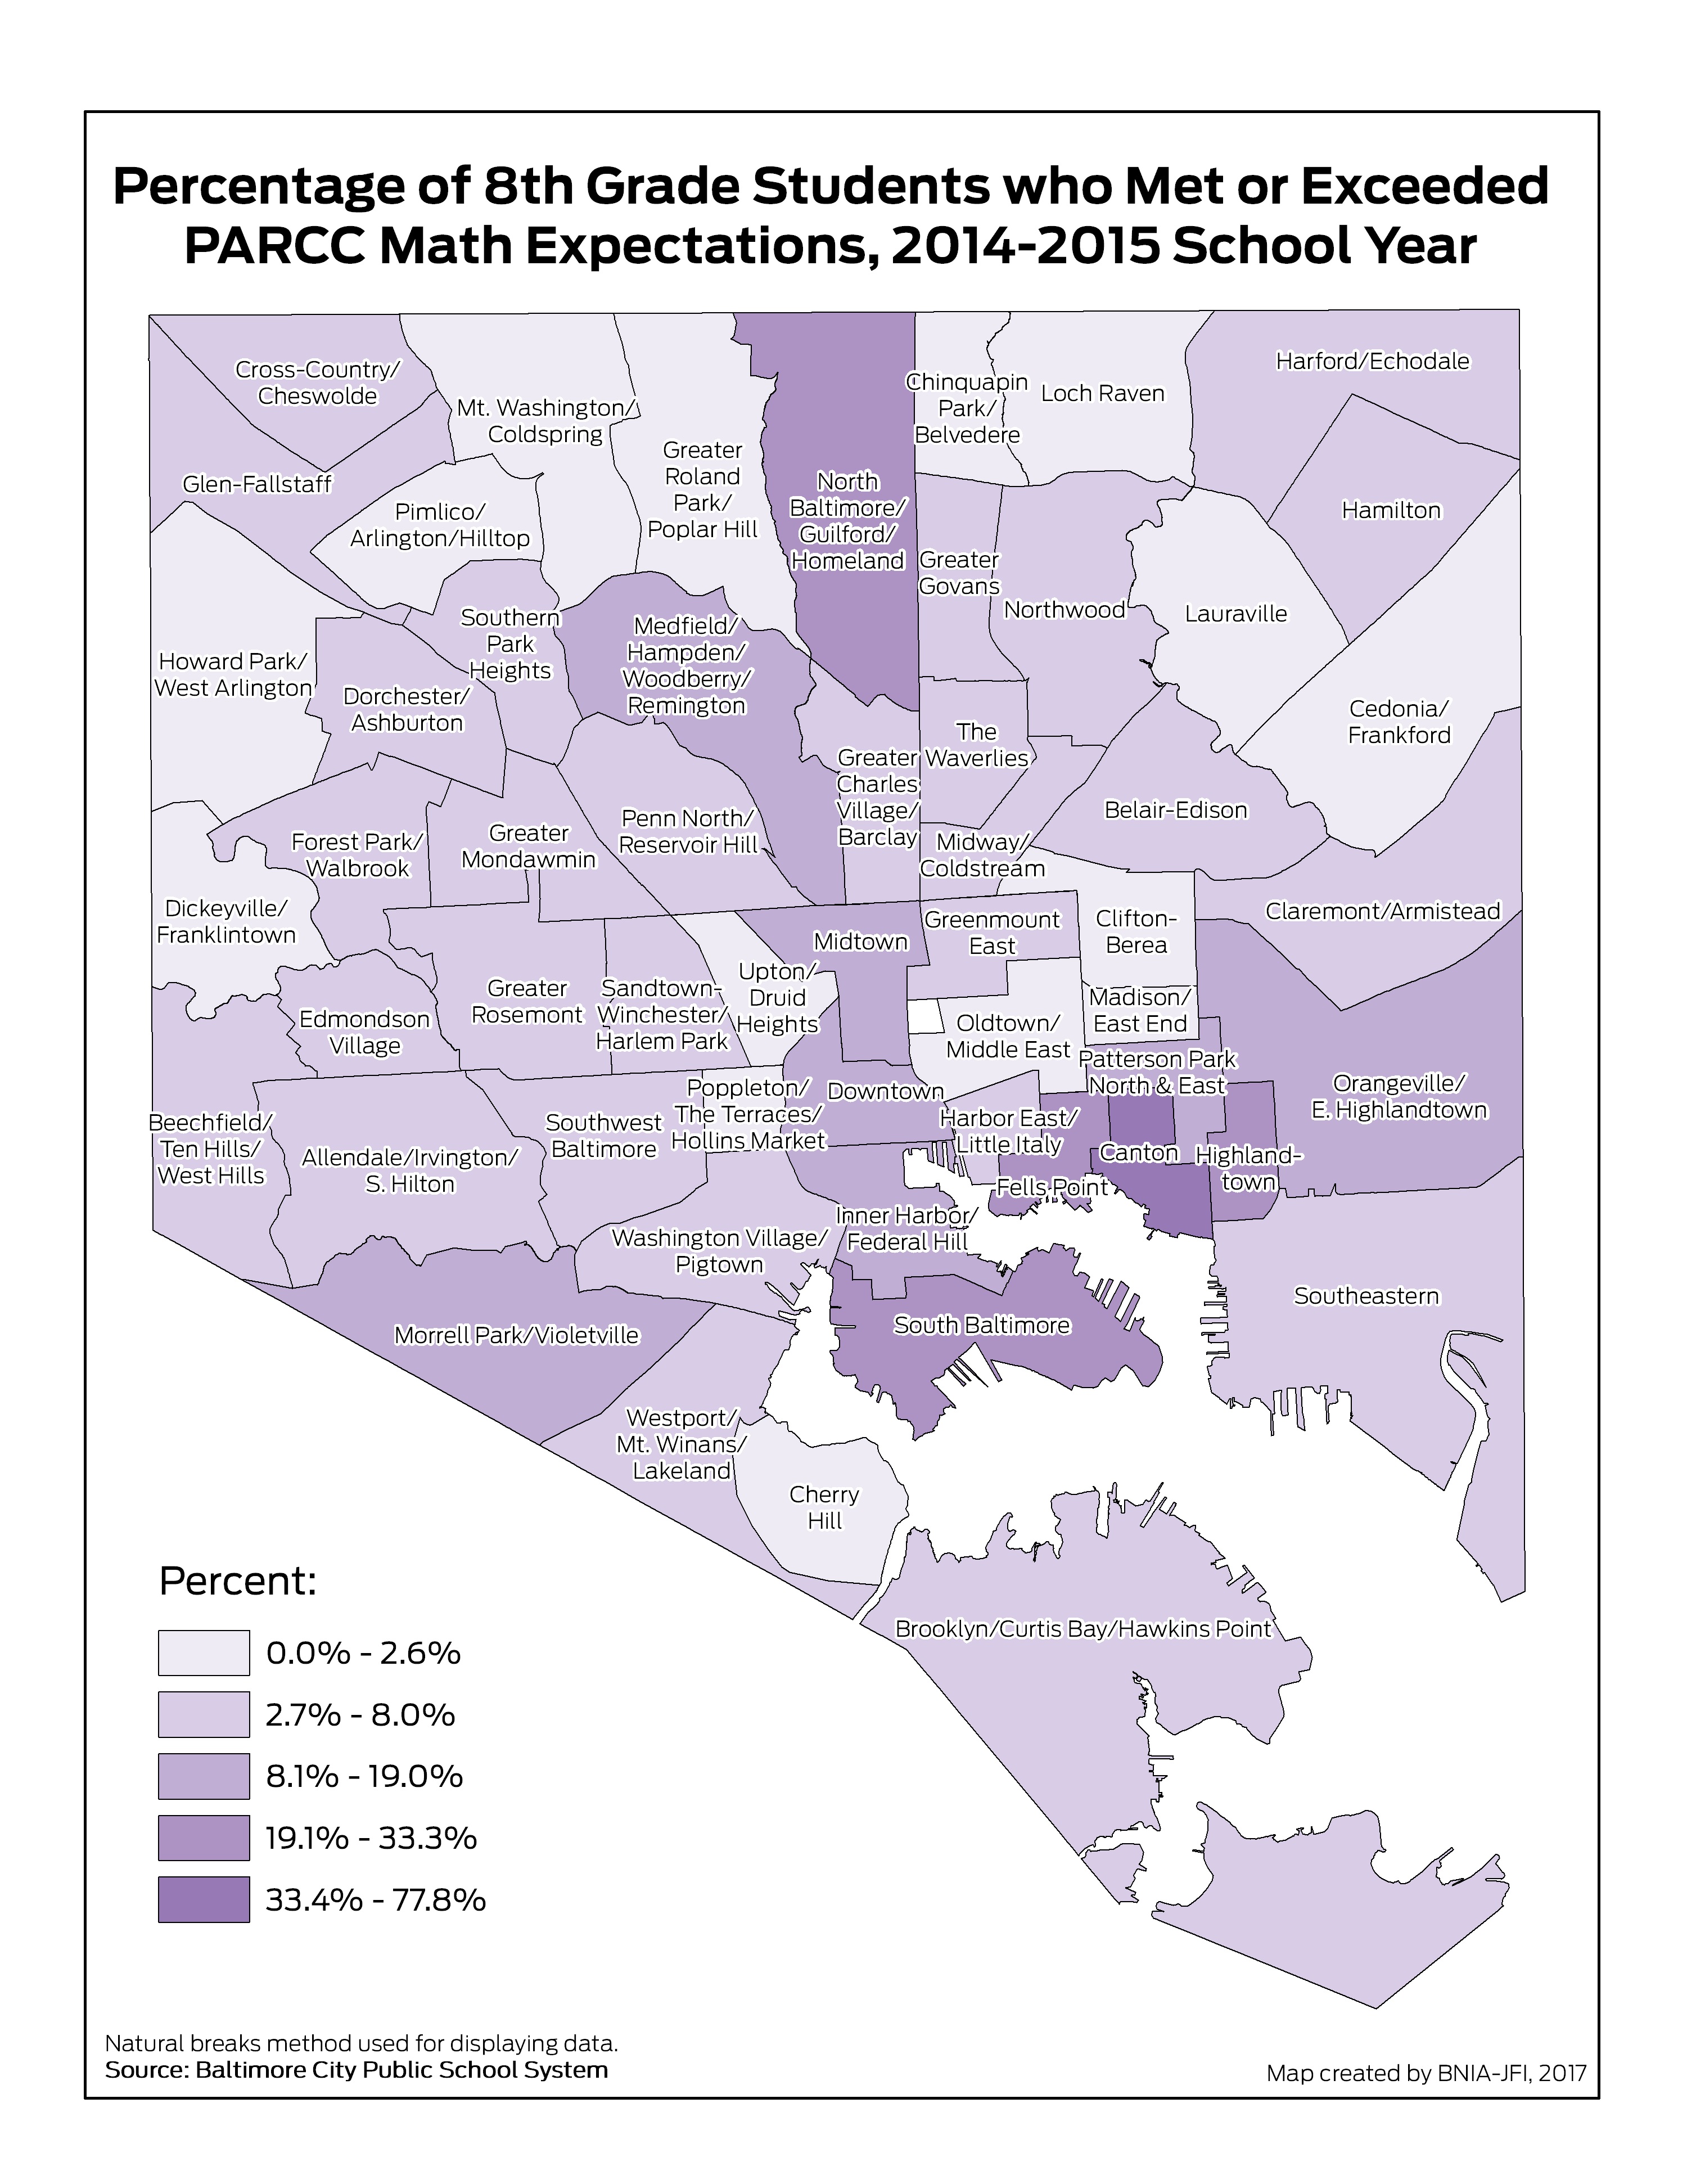
Percentage of 8th Grade Students Passing PARCC Math
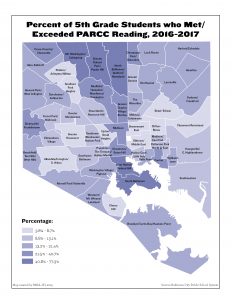
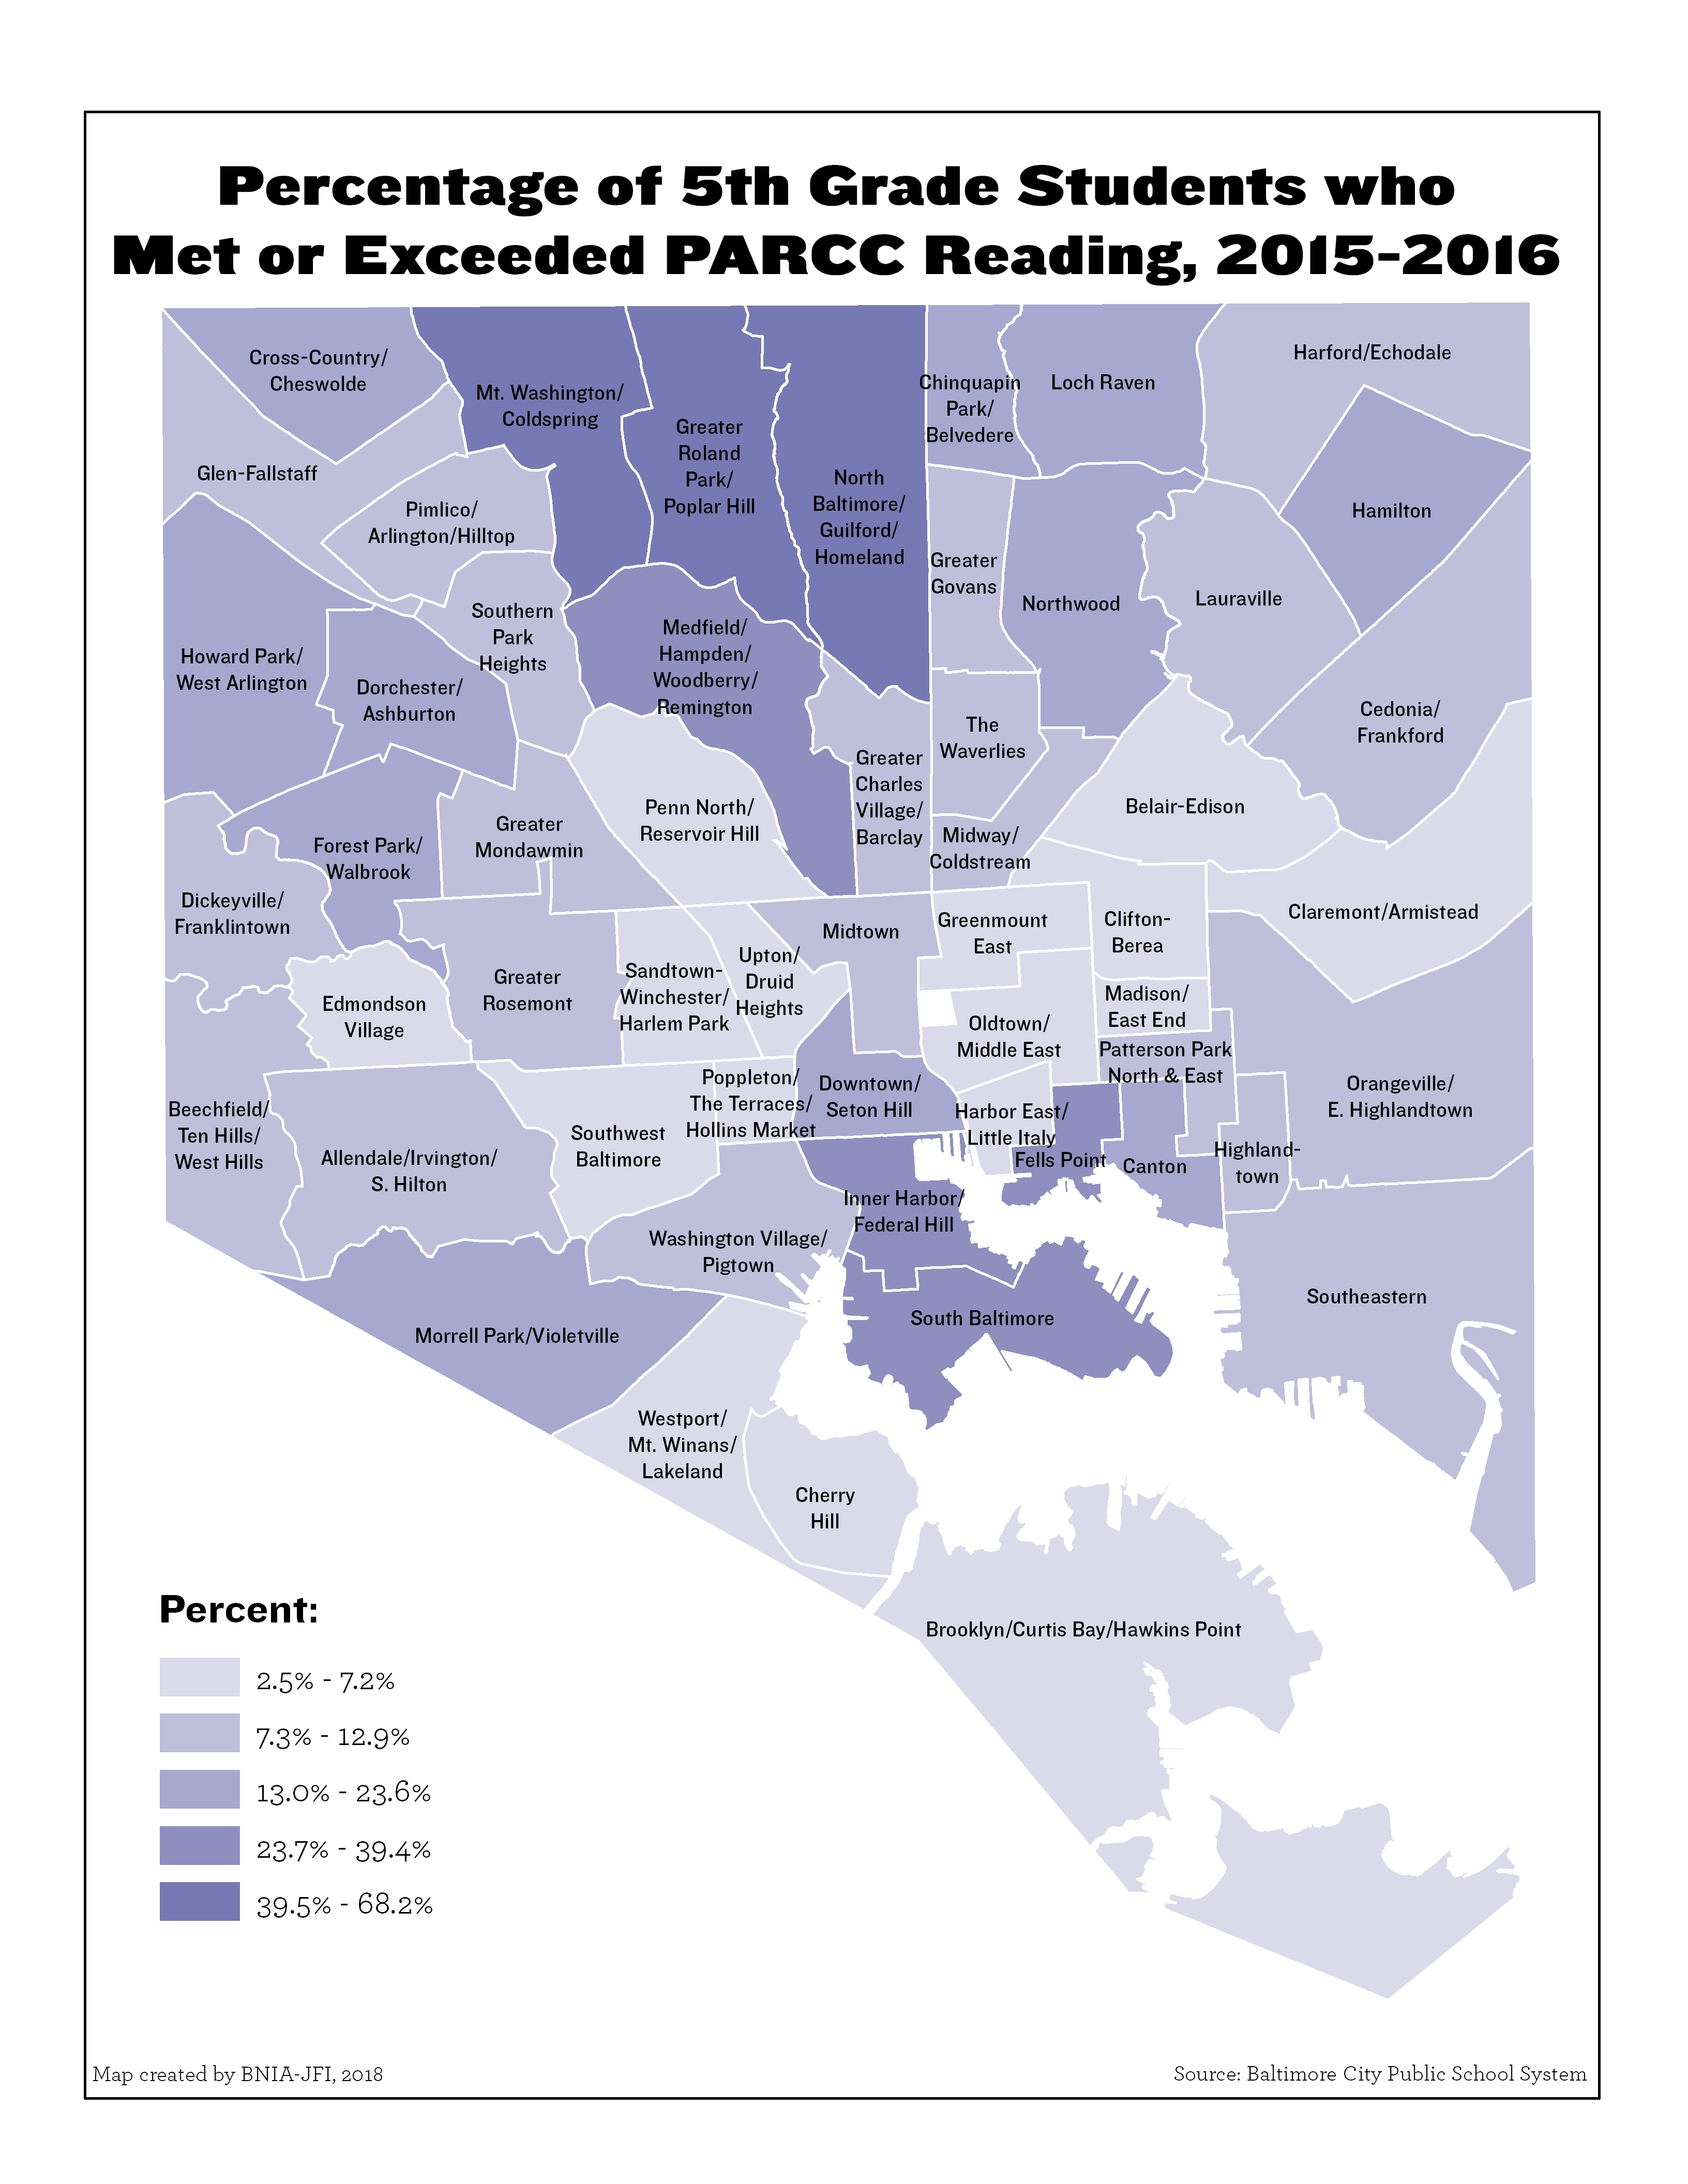
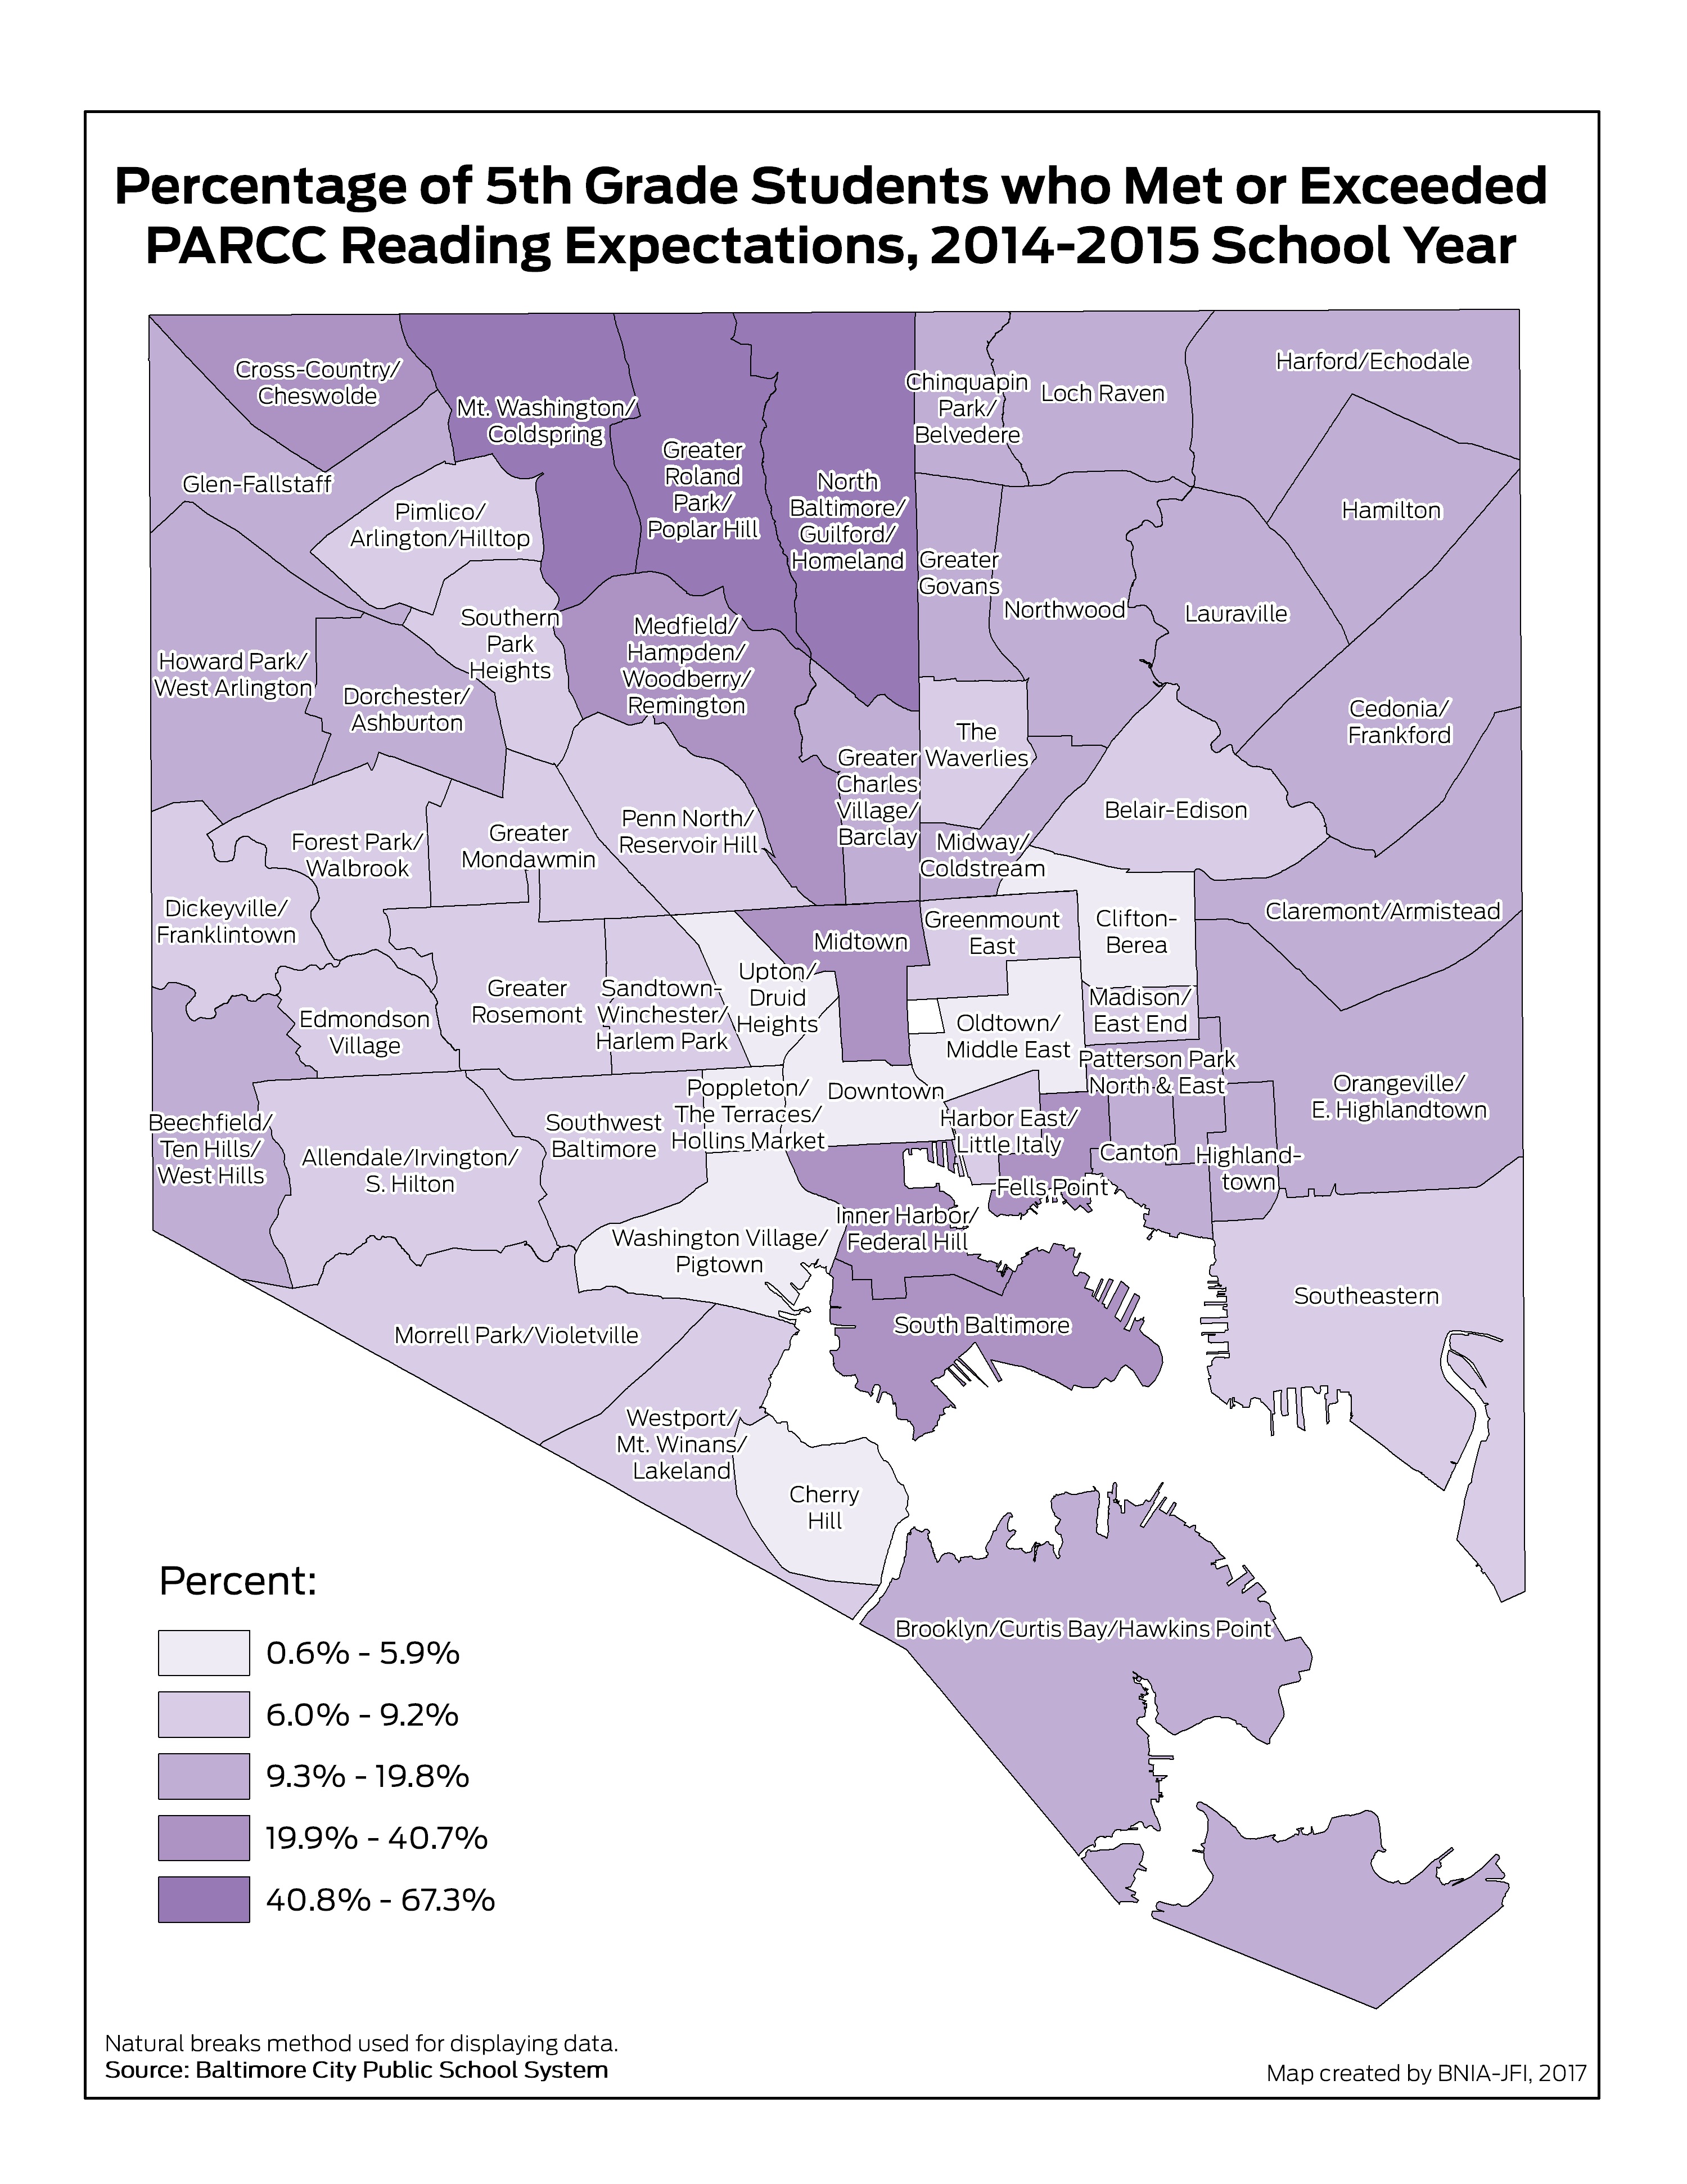
Percentage of 5th Grade Students Passing PARCC Reading
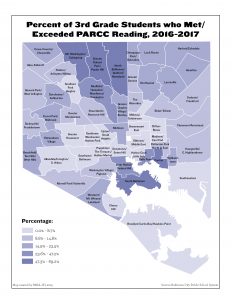
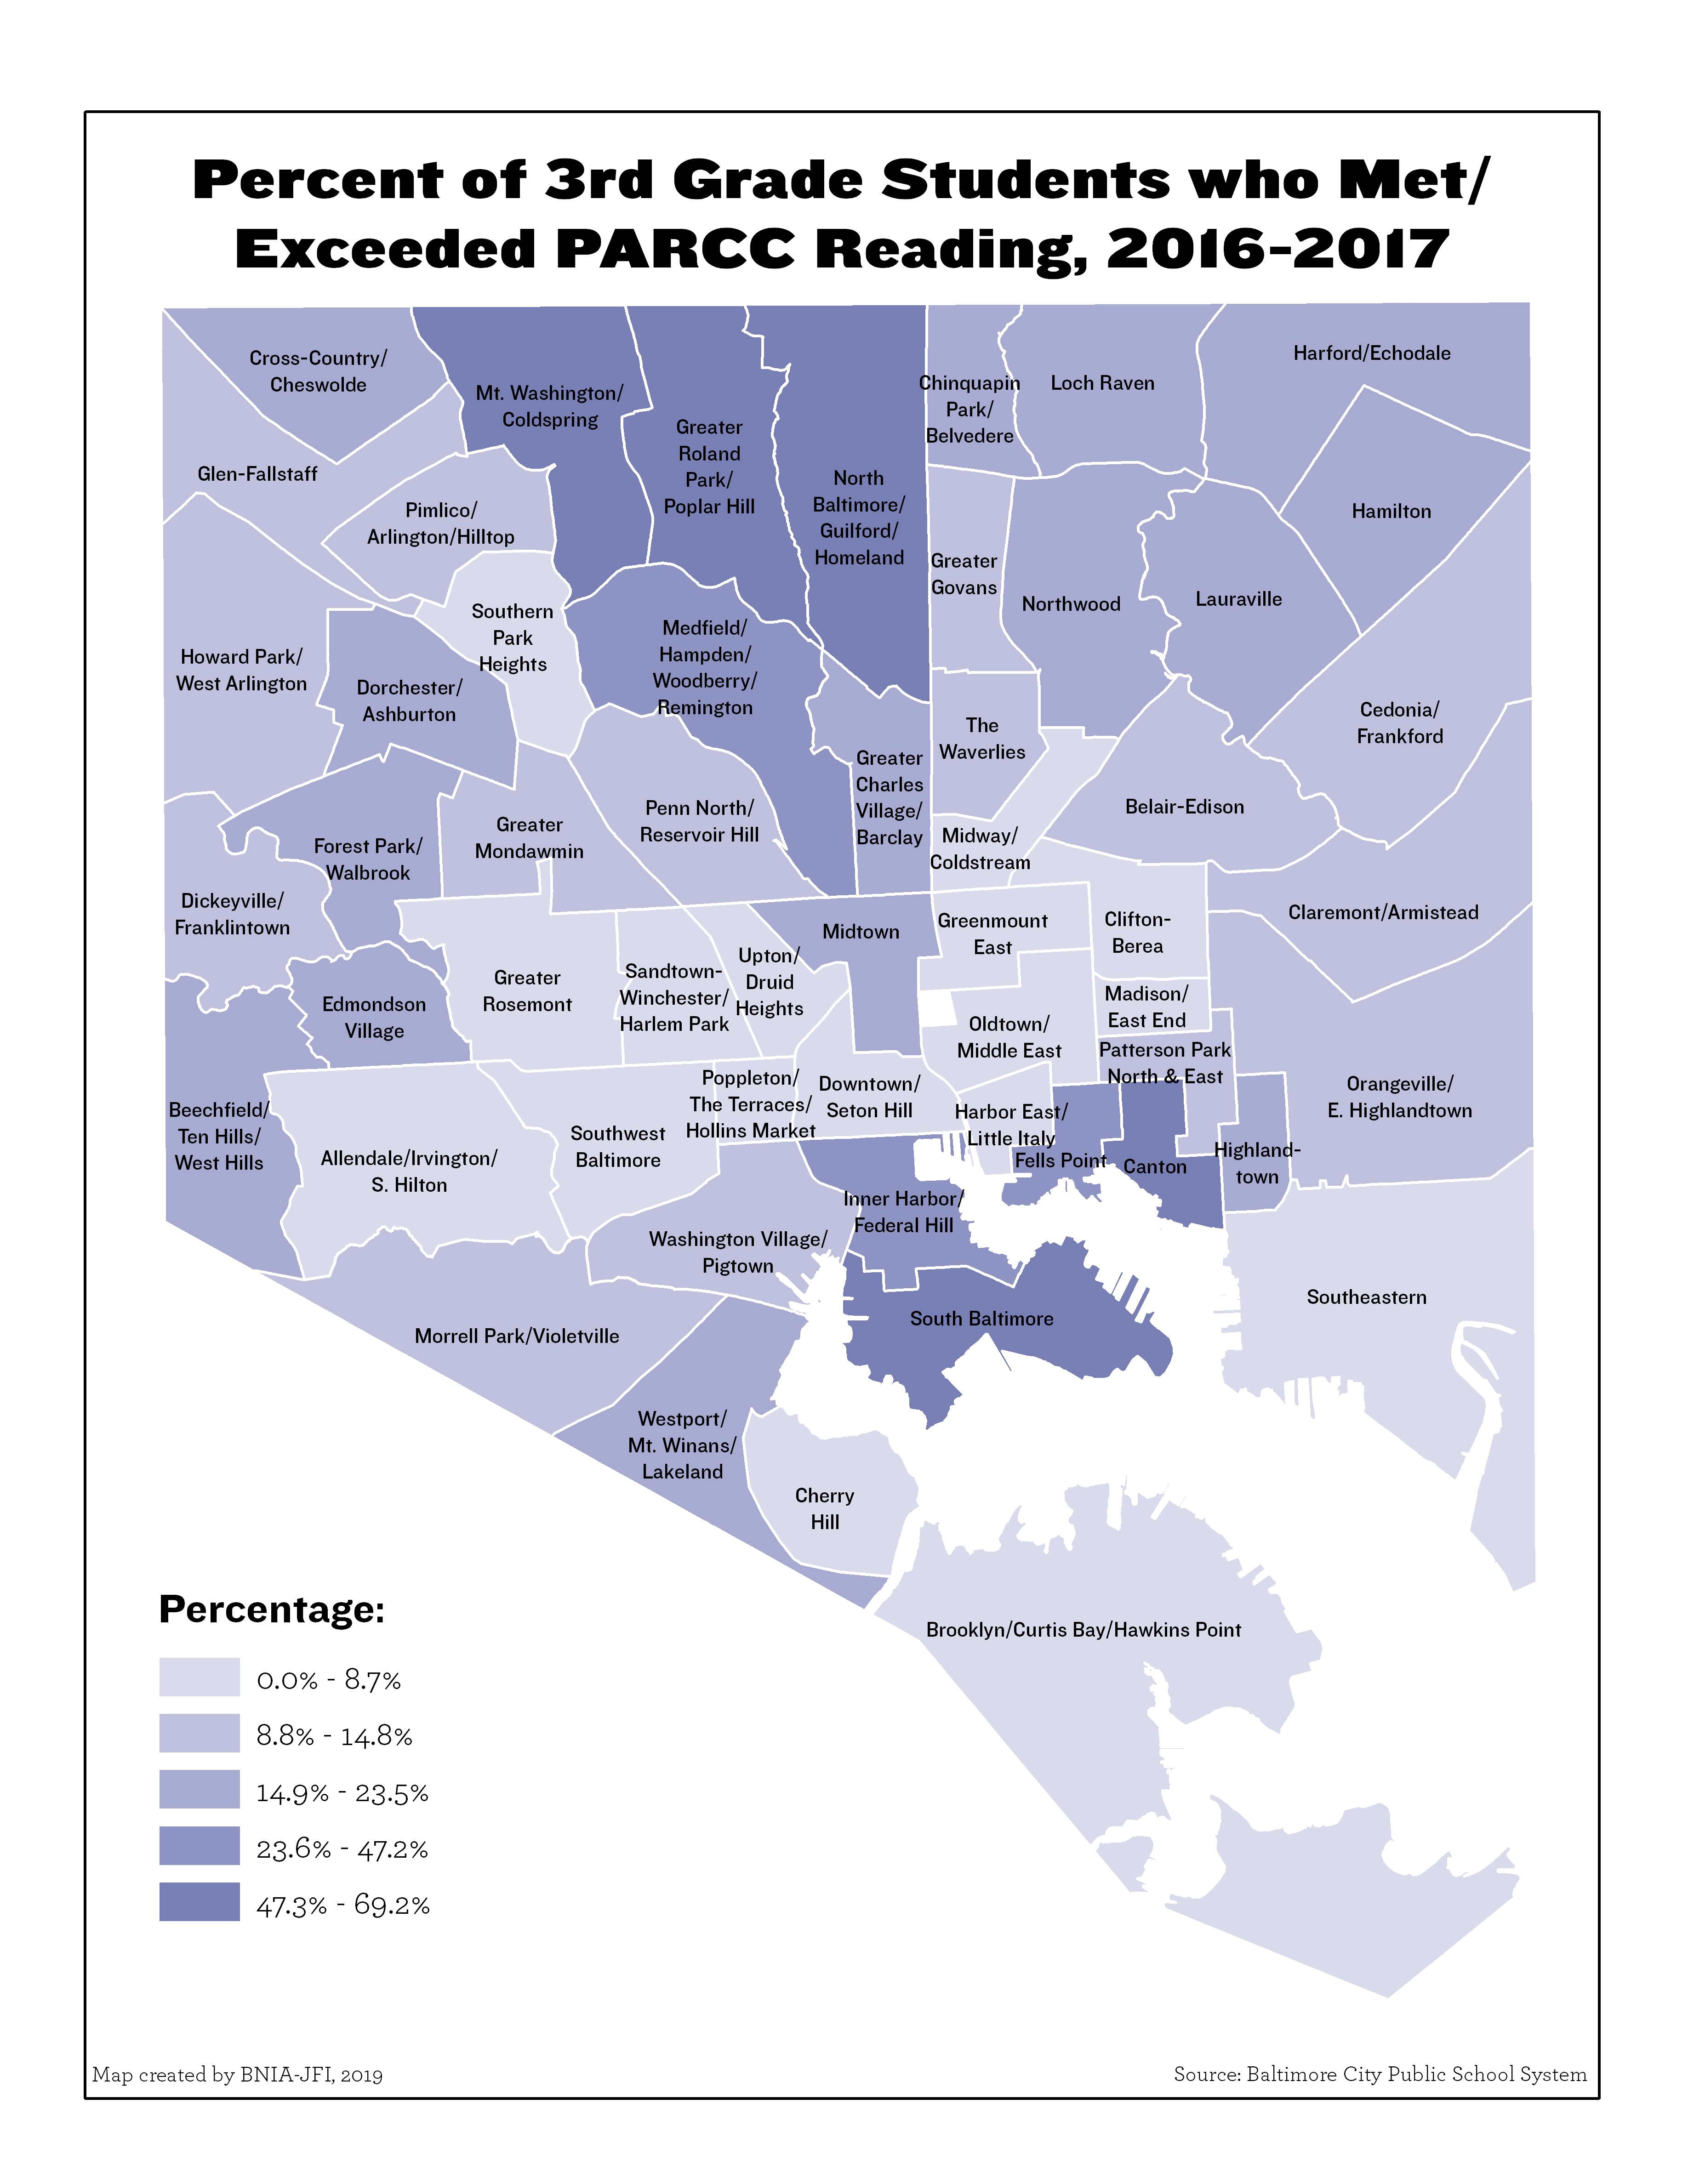
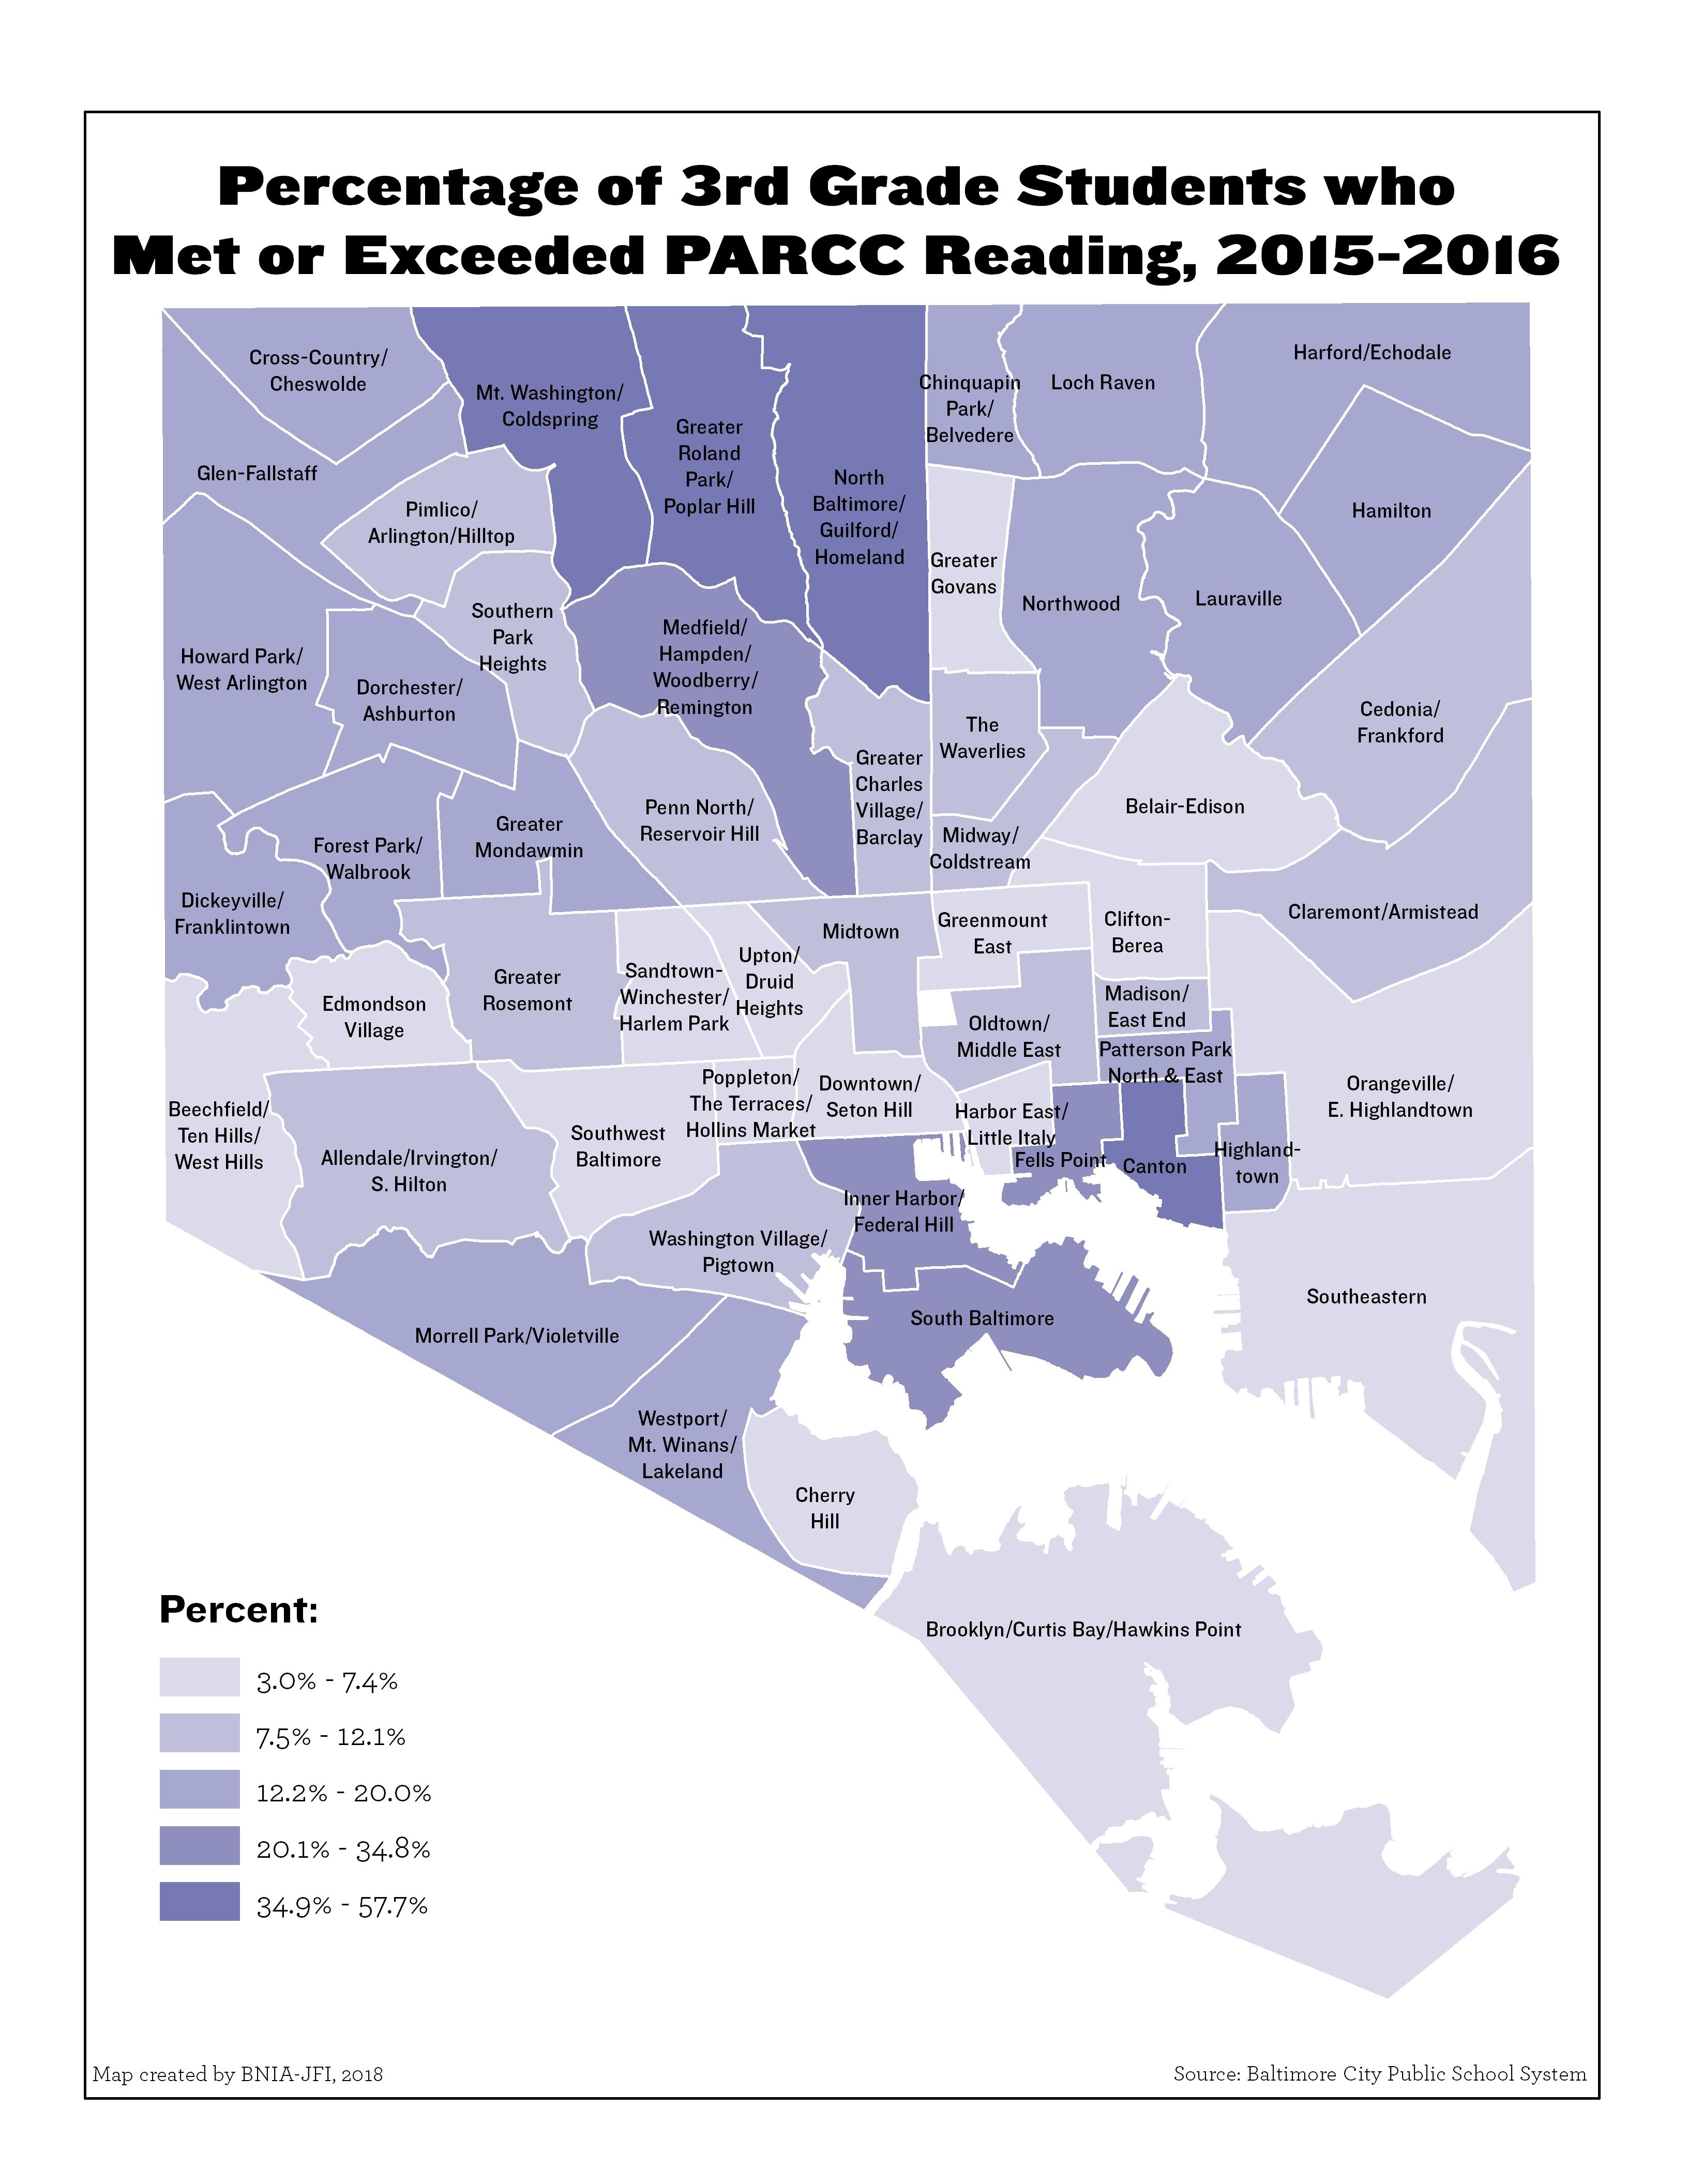
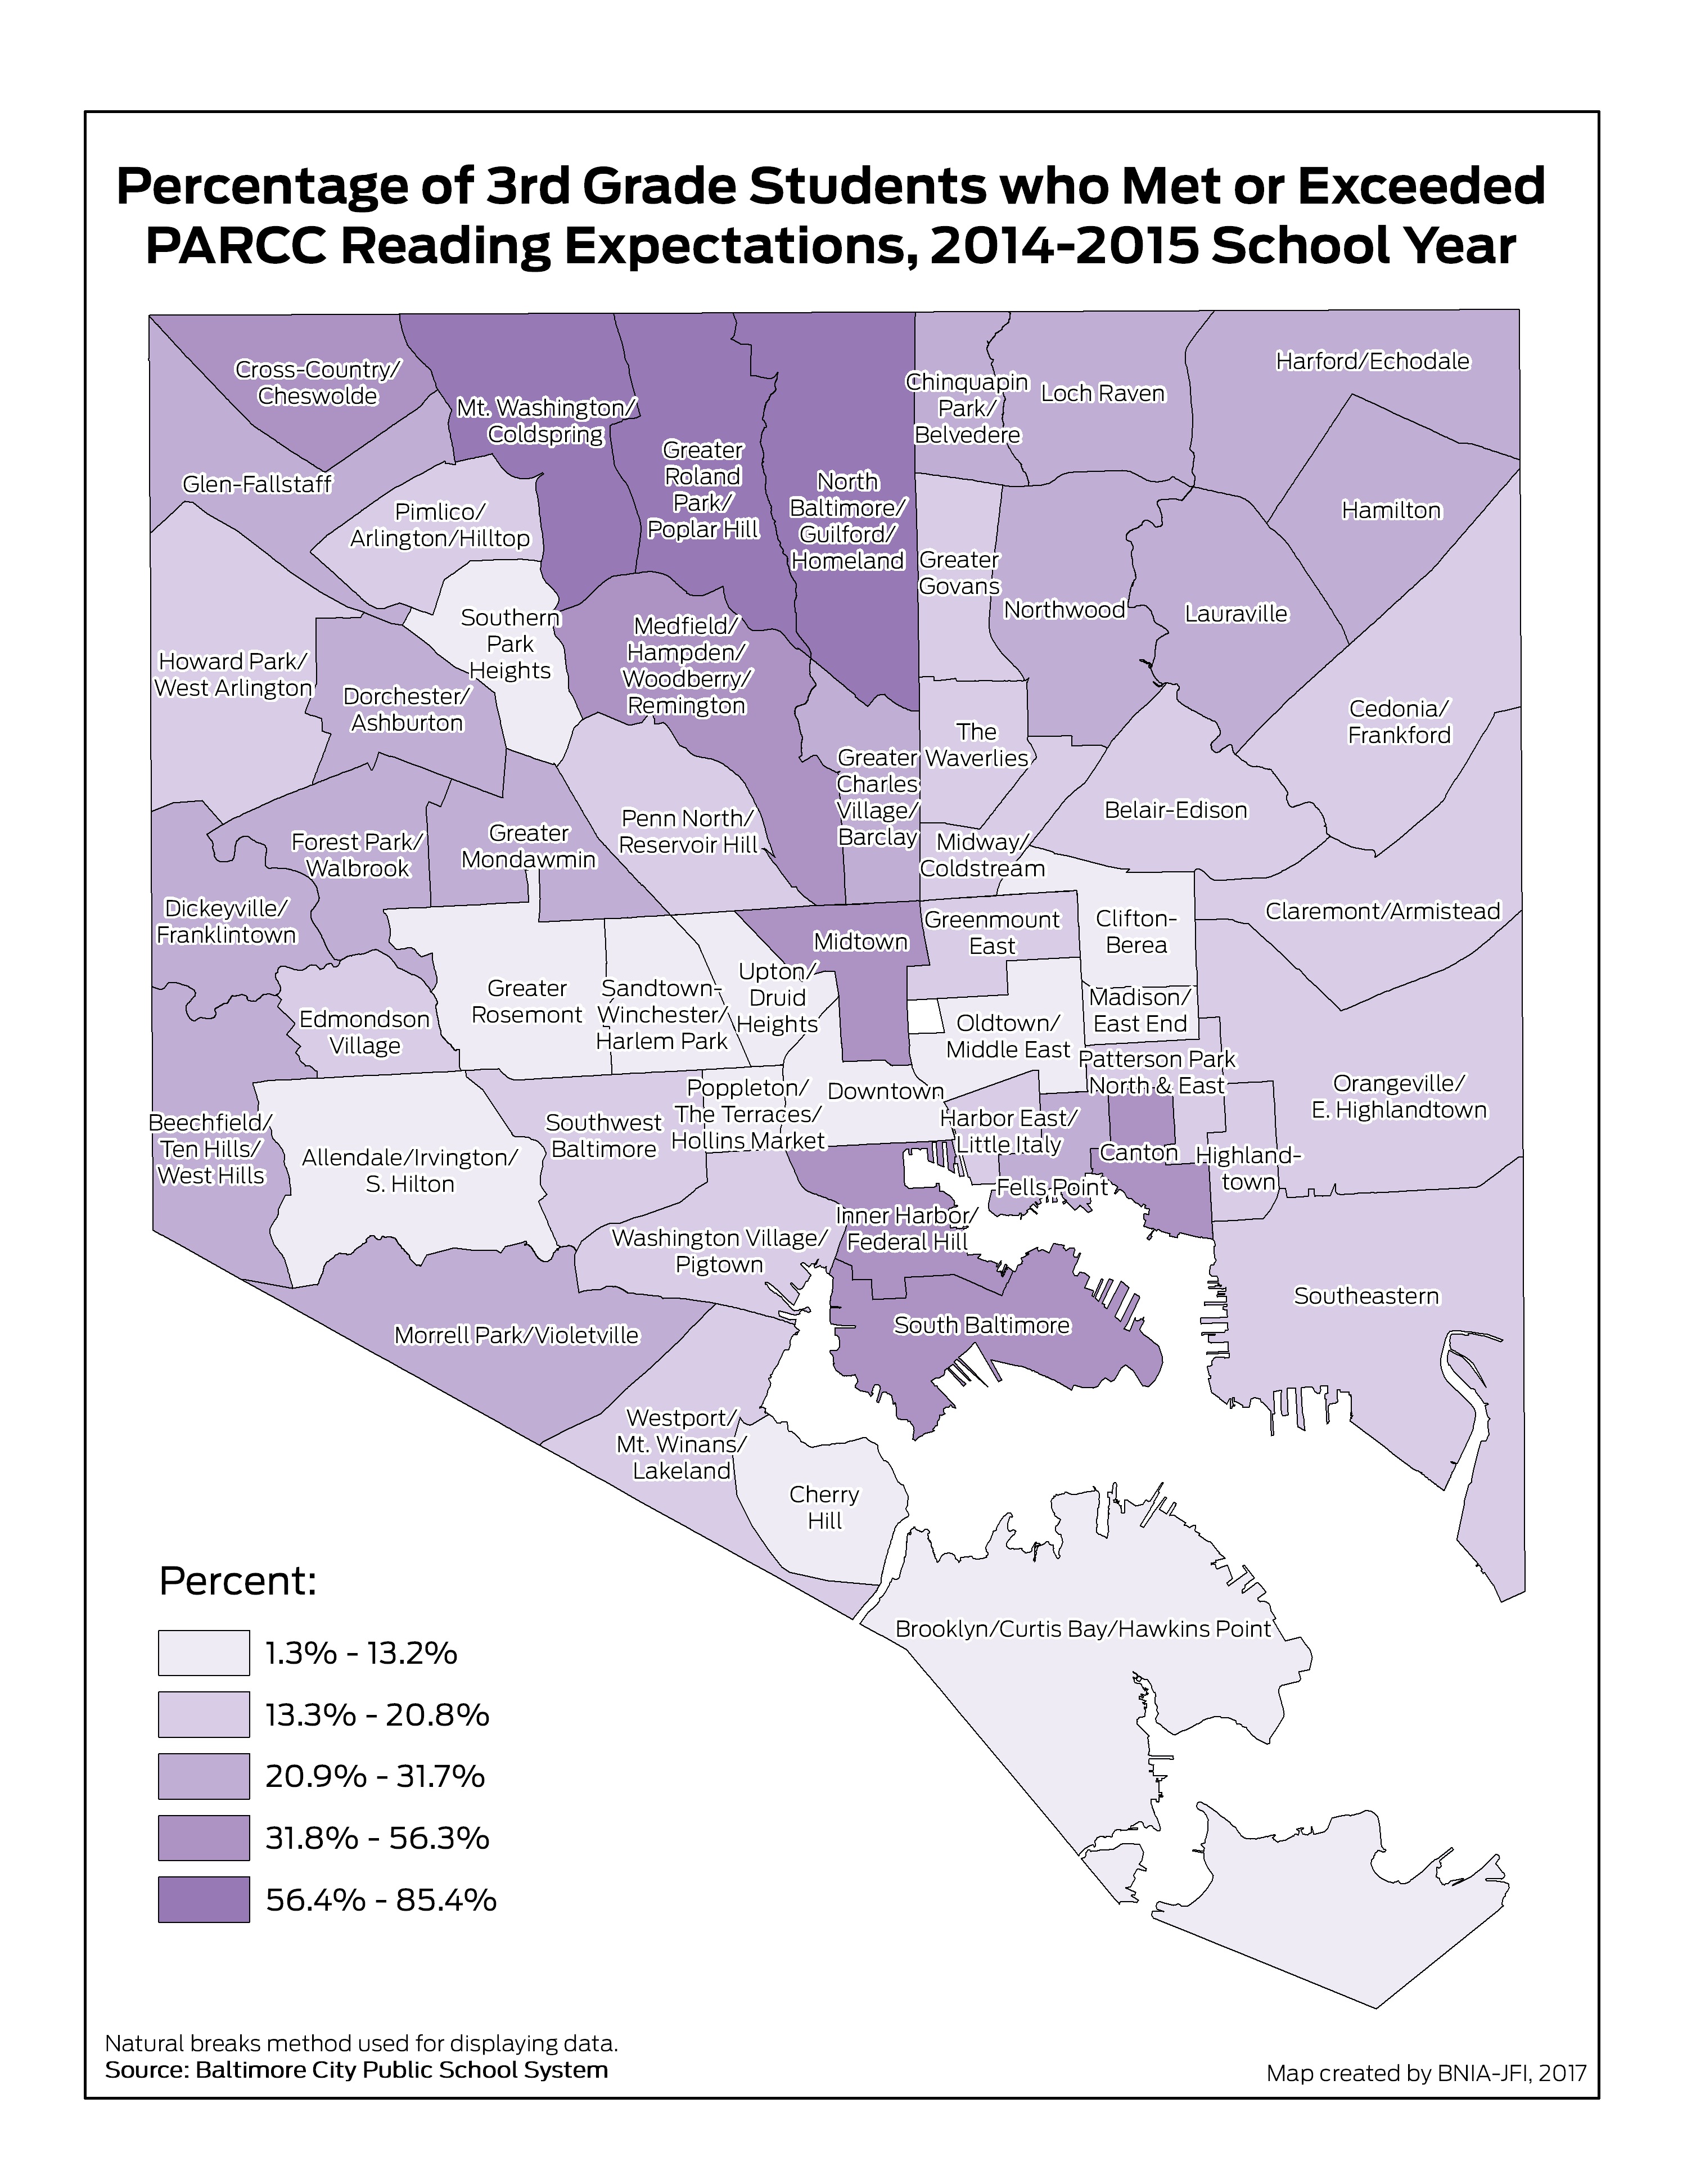
Percentage of 3rd Grade Students Passing PARCC Reading
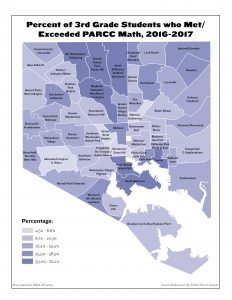
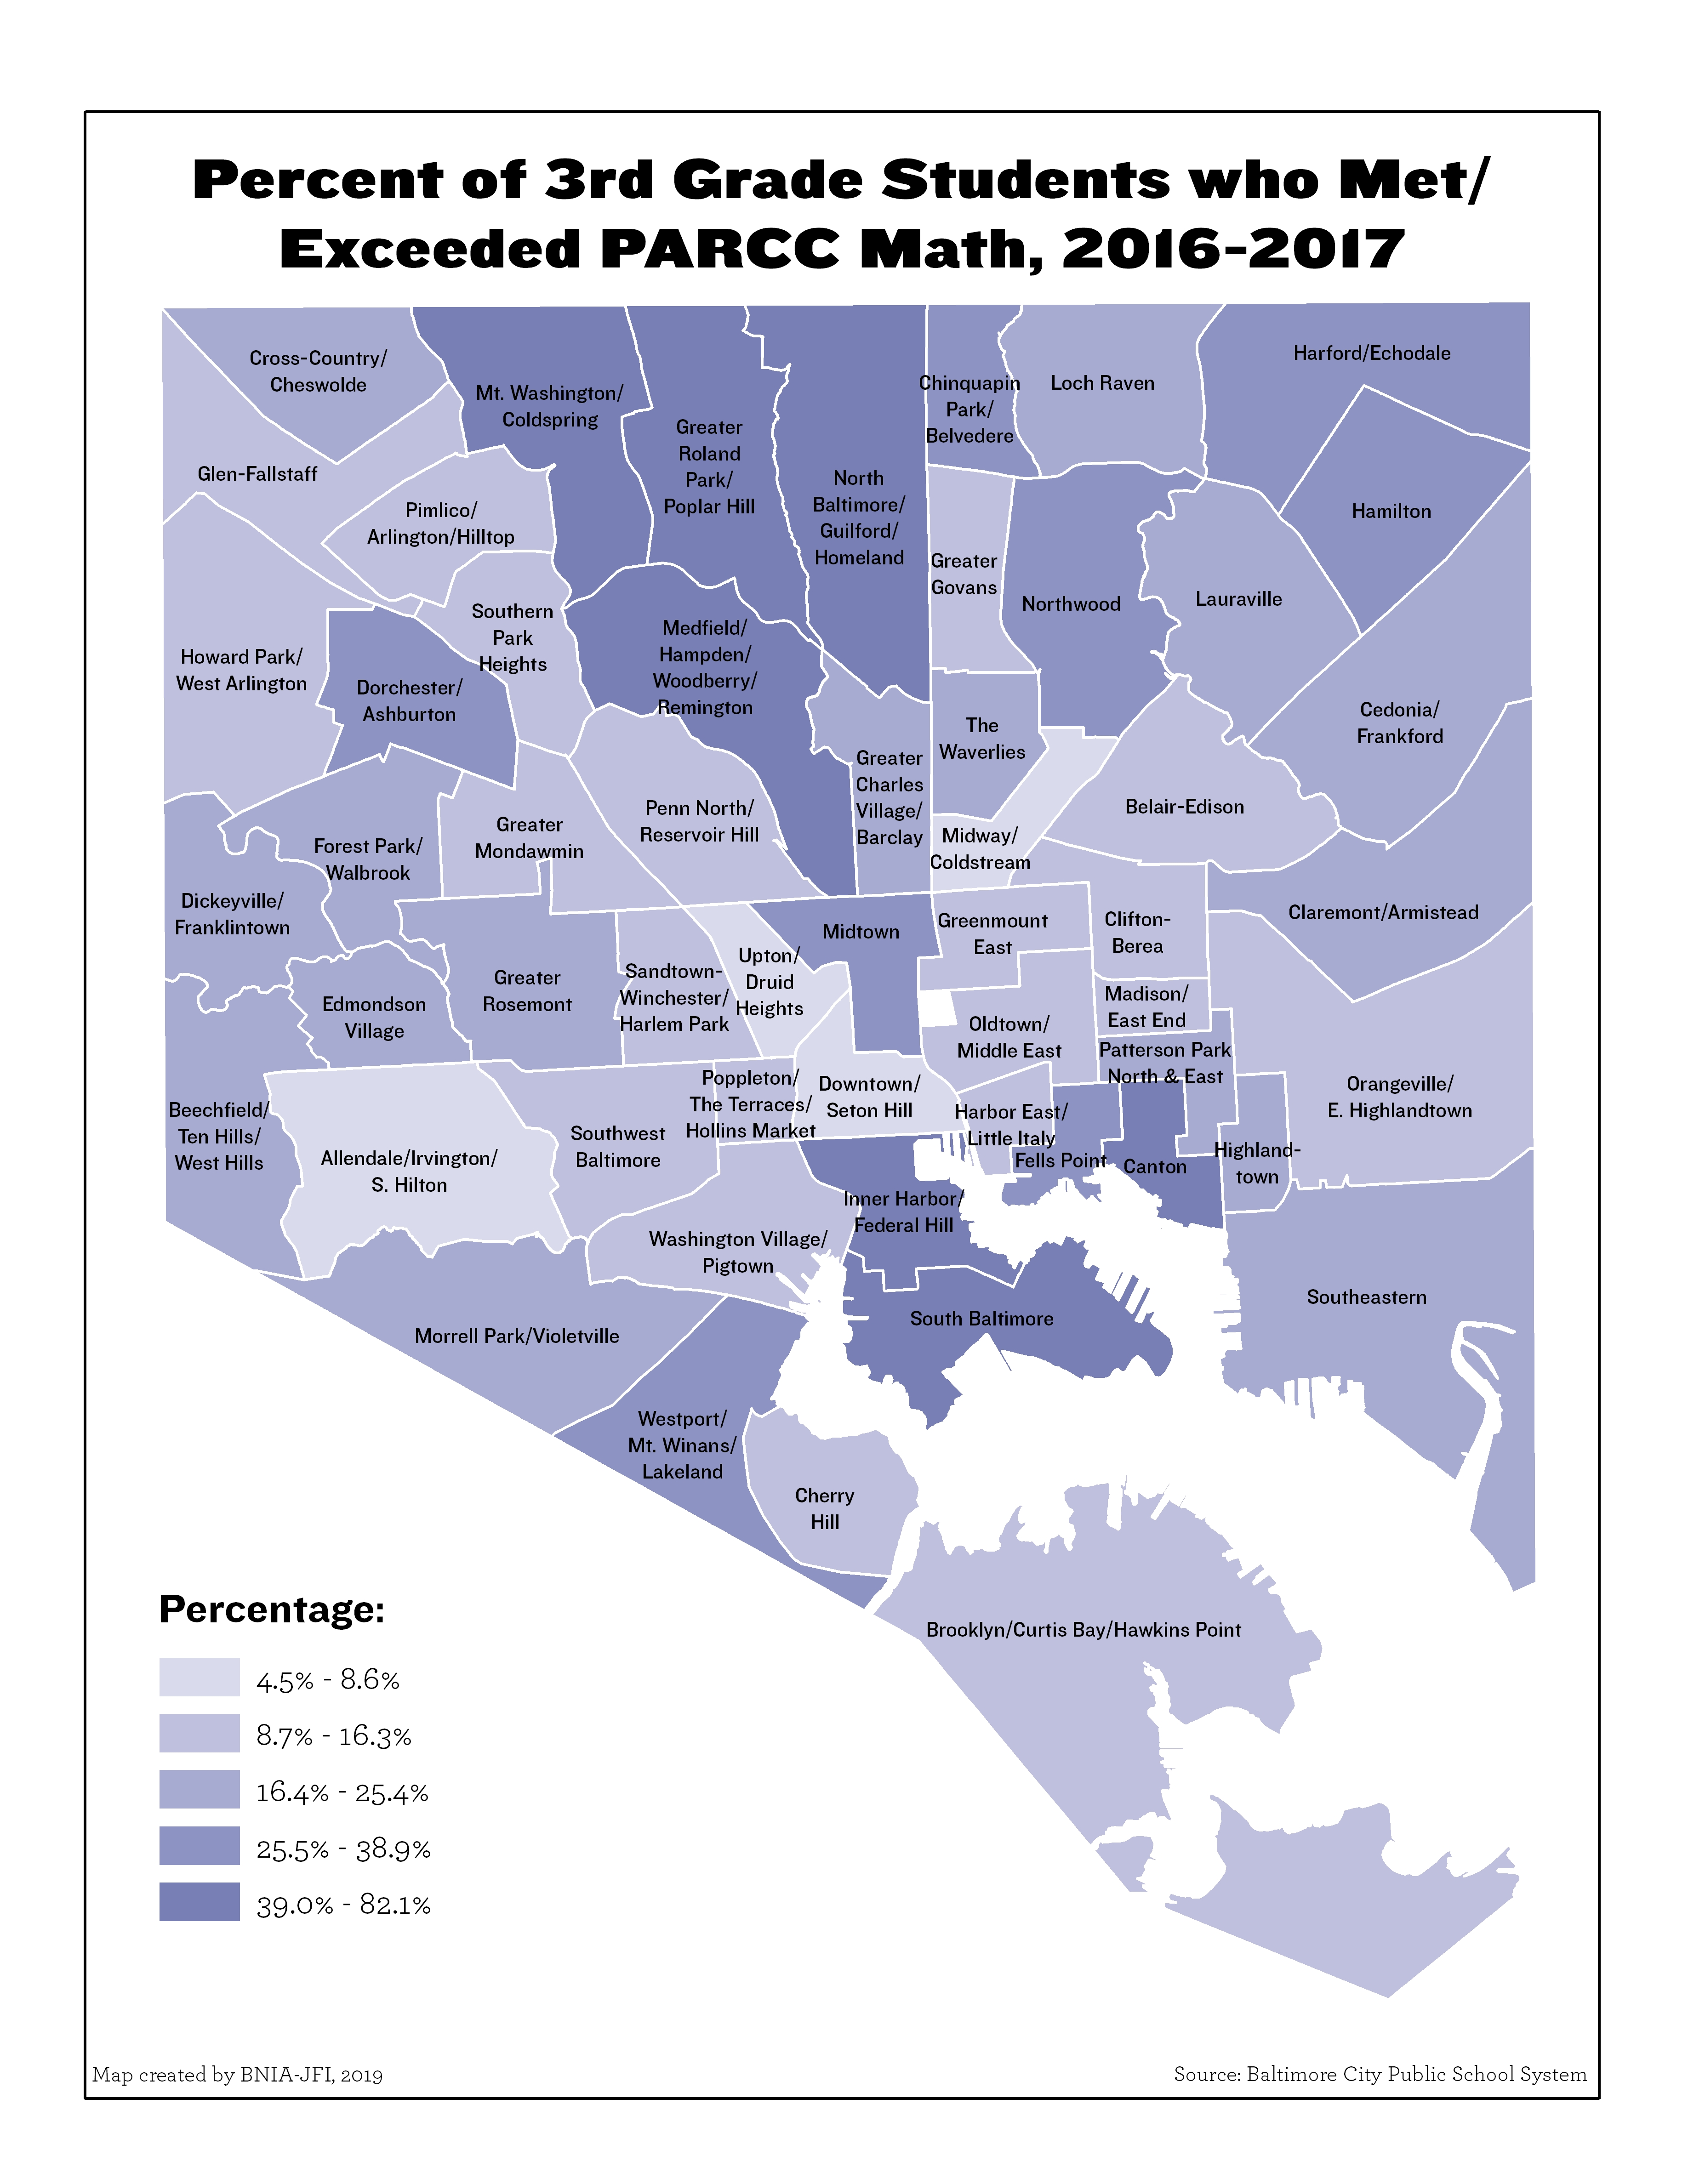
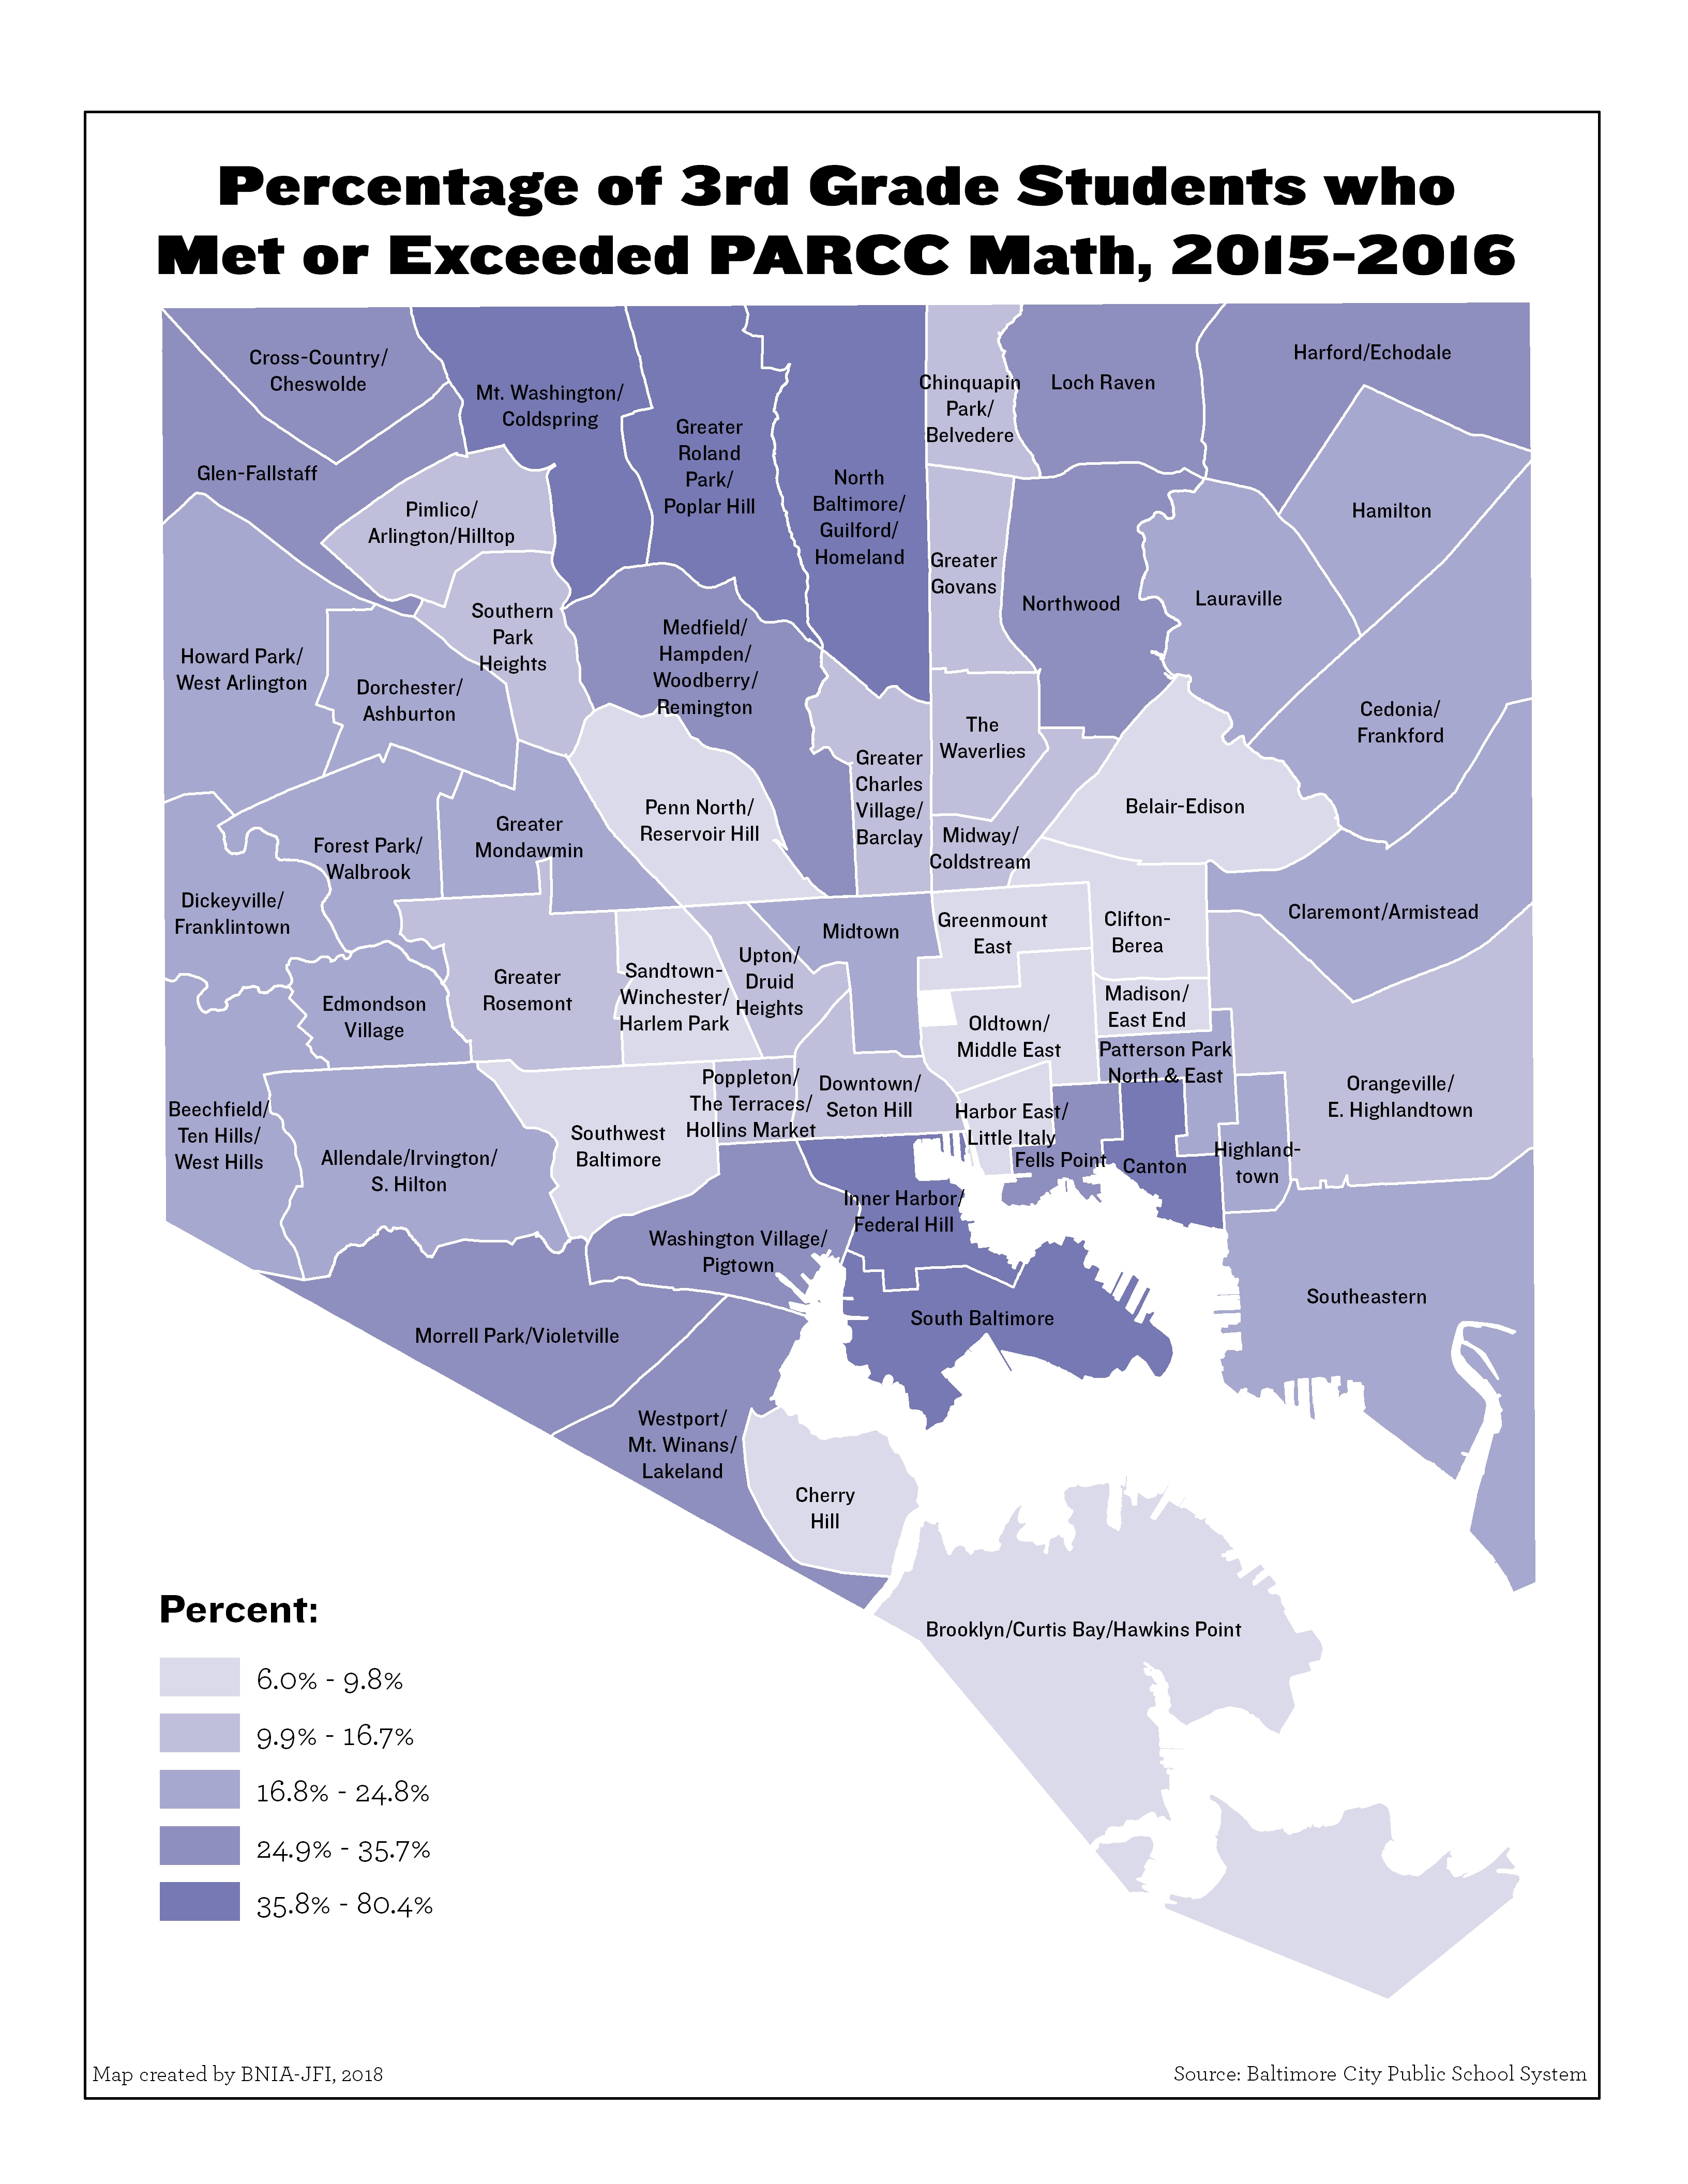
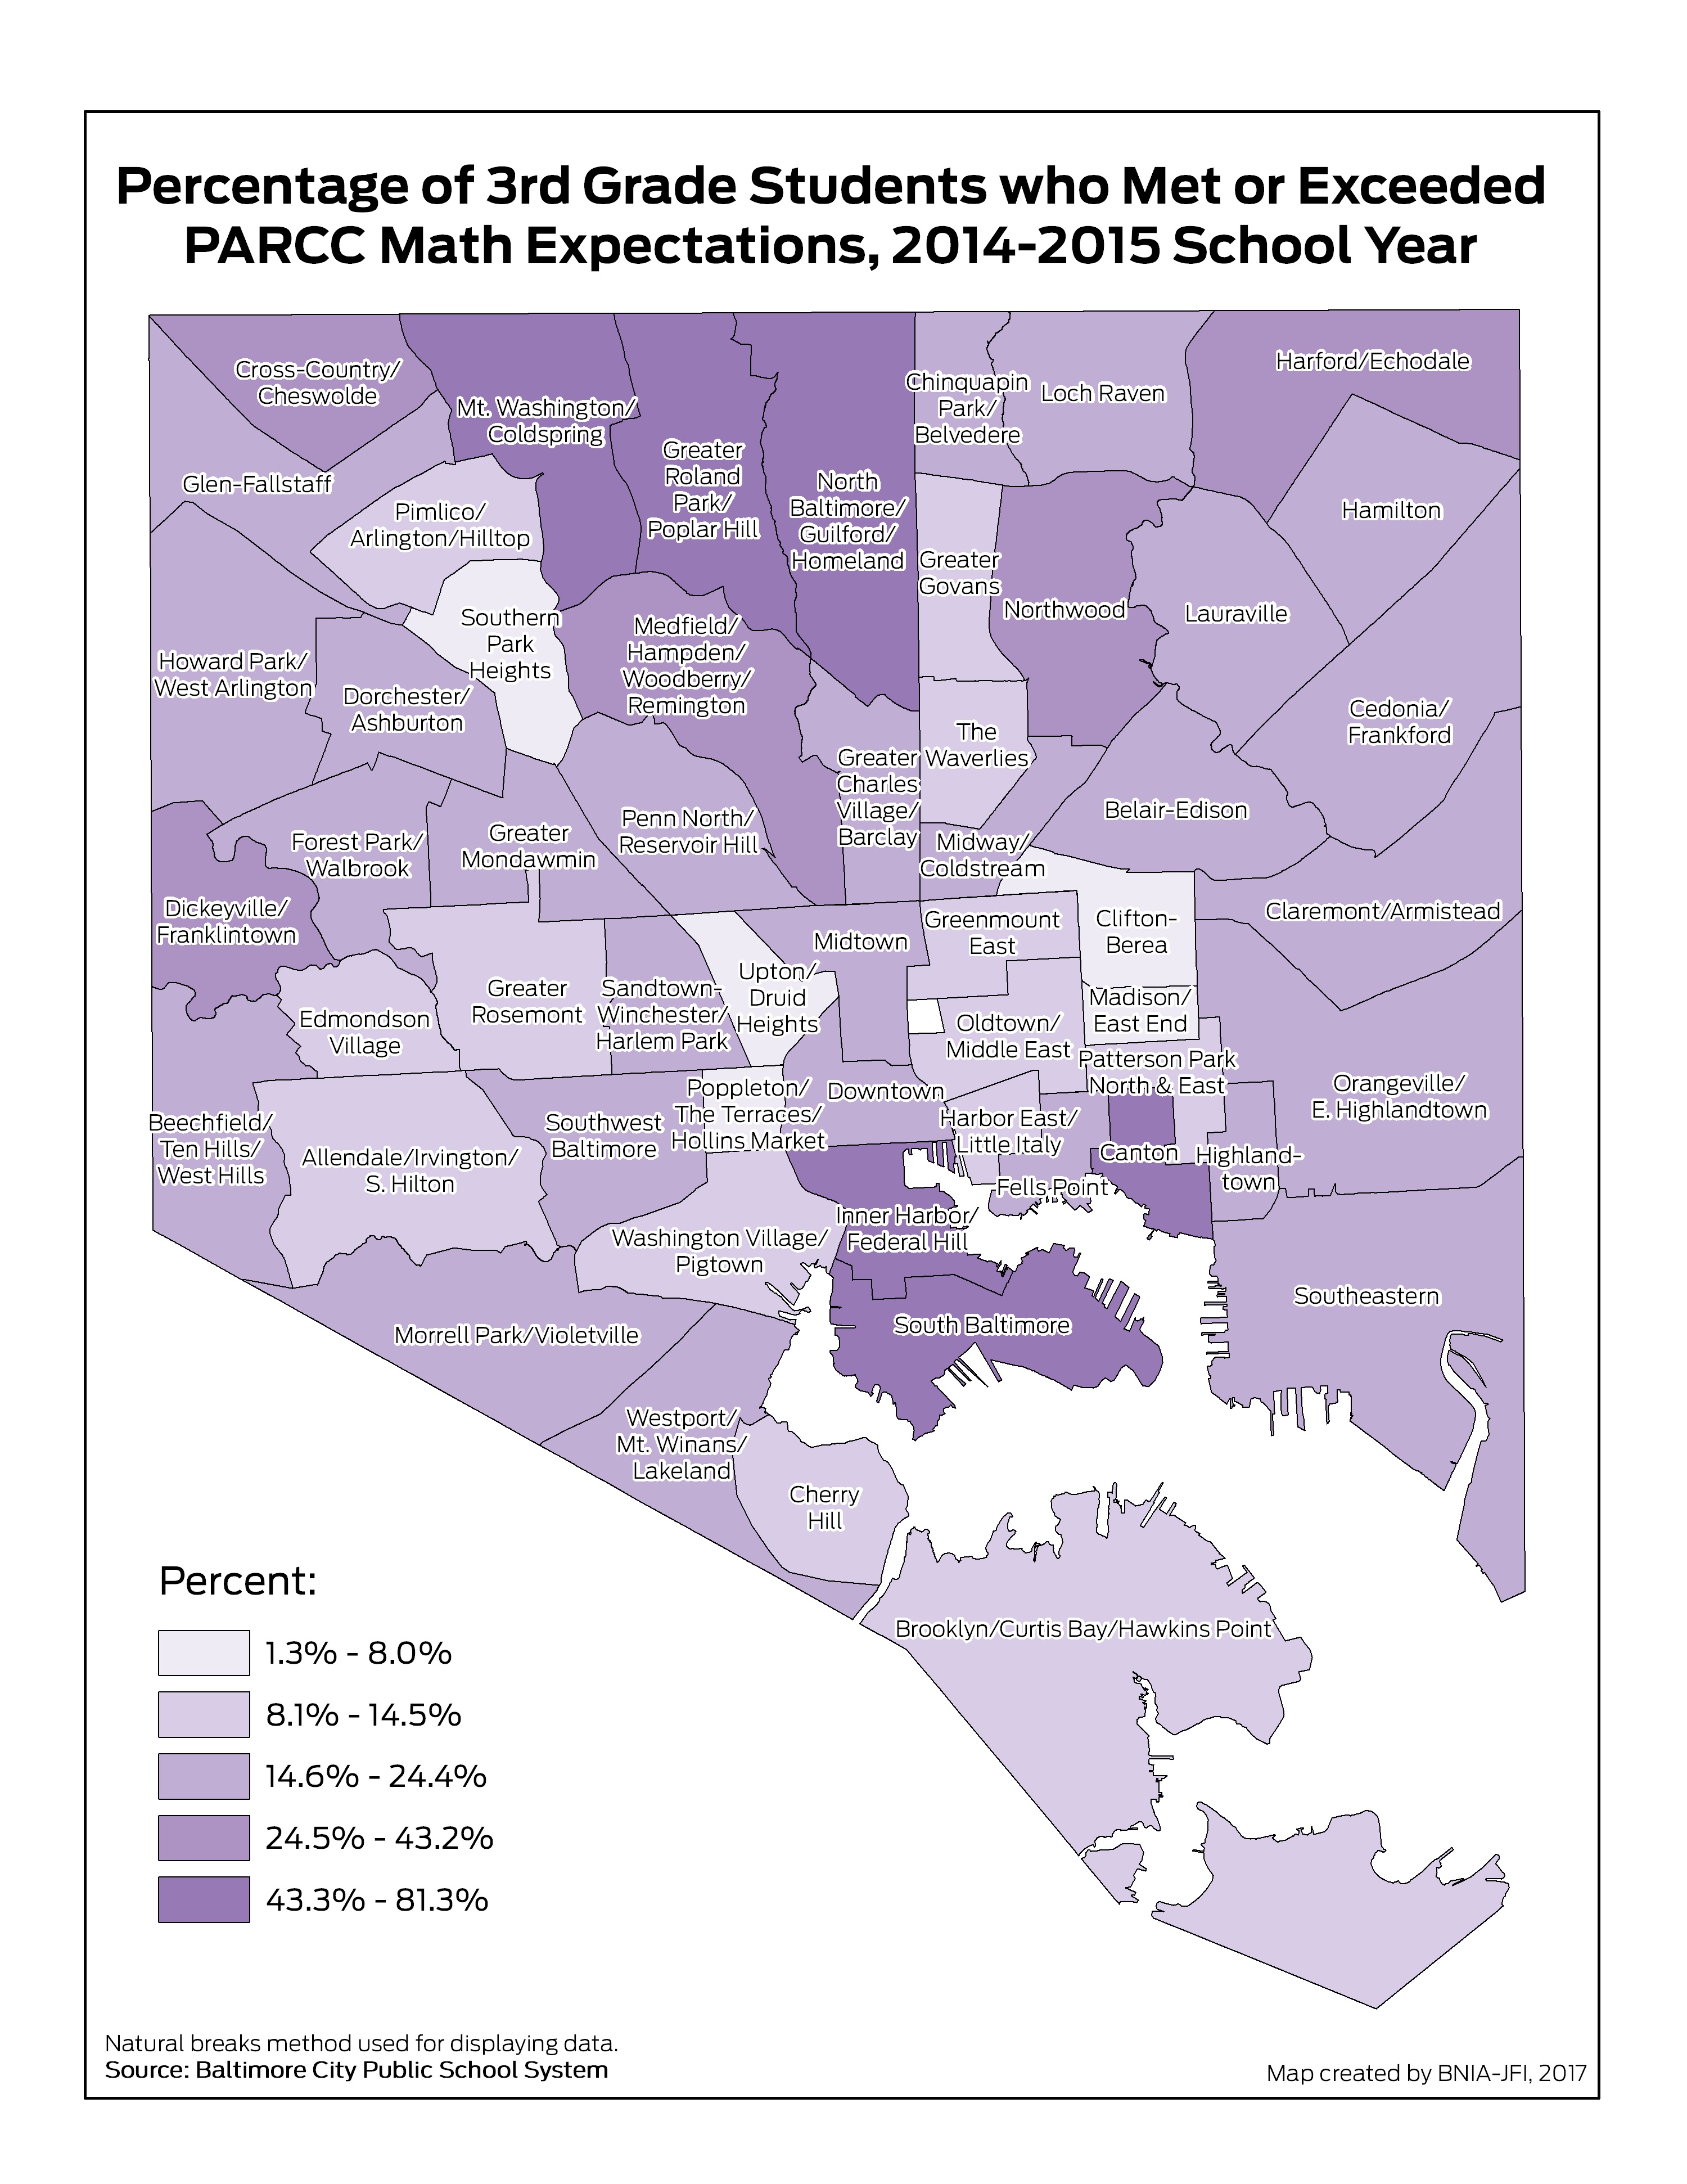
Percentage of 3rd Grade Students Passing PARCC Math
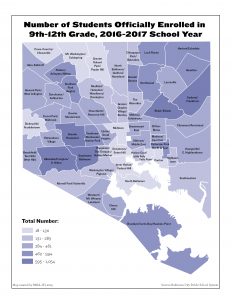
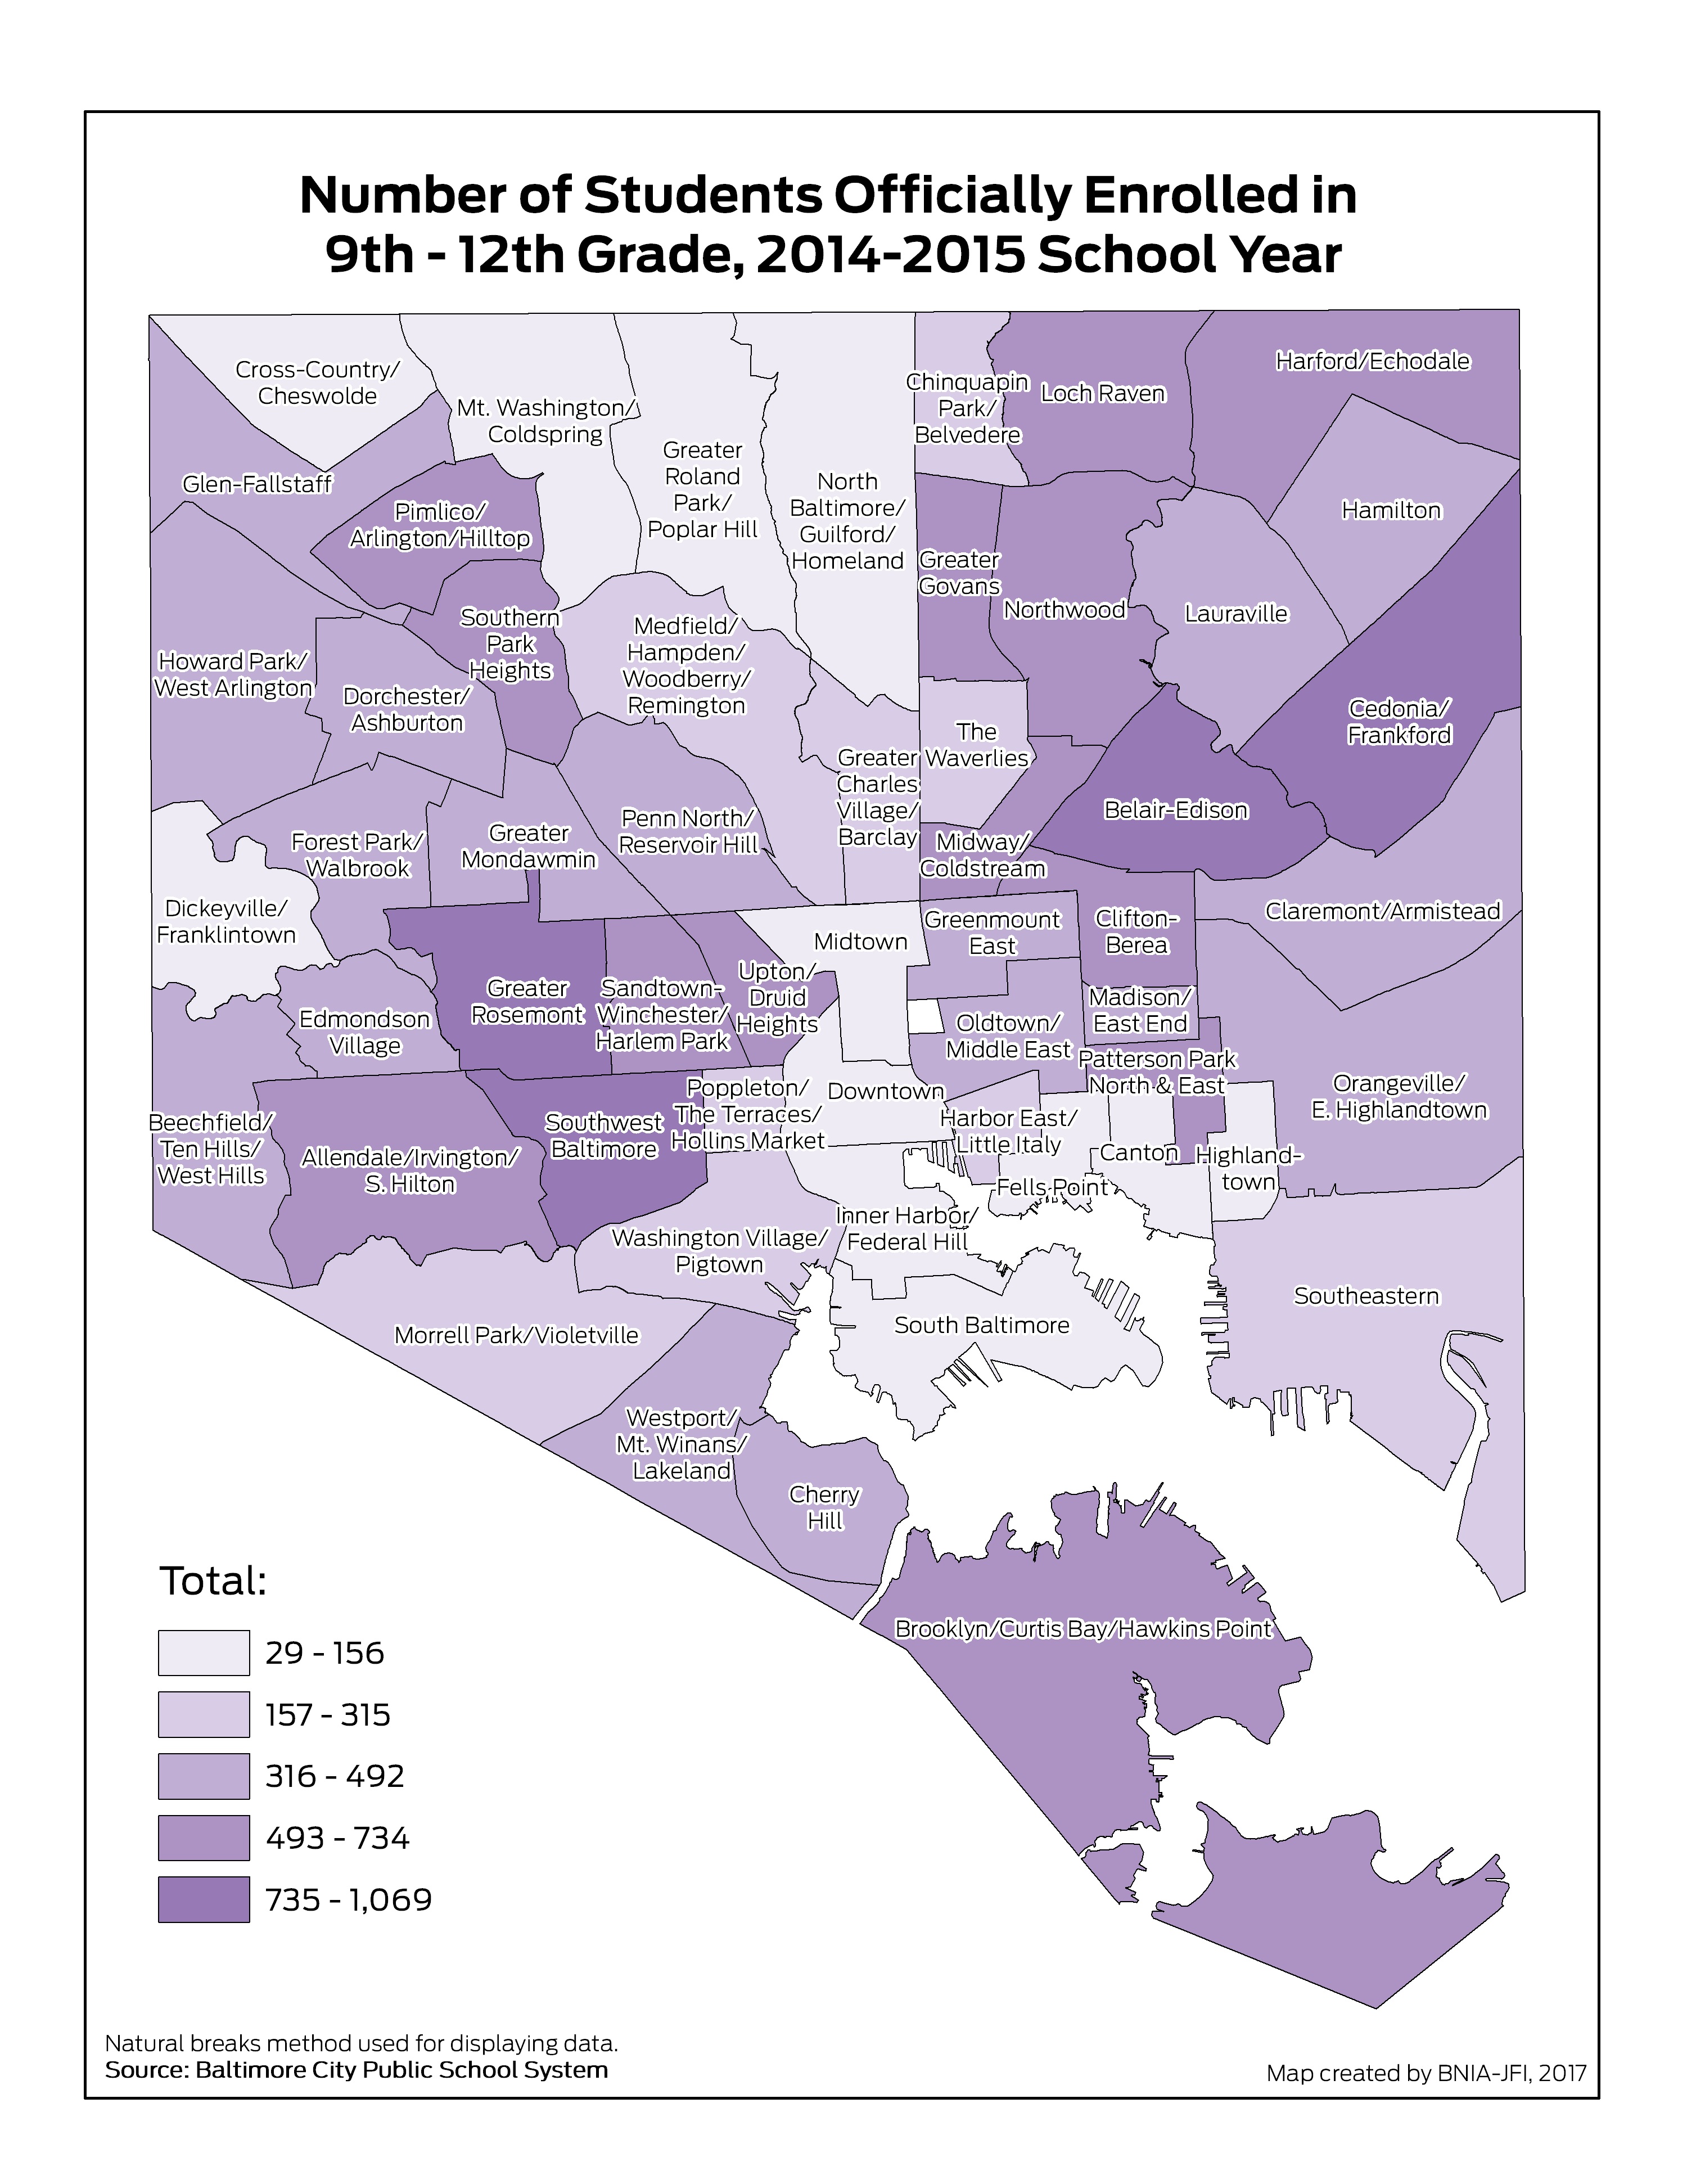
Number of Students Officially Enrolled in 9th – 12th Grade
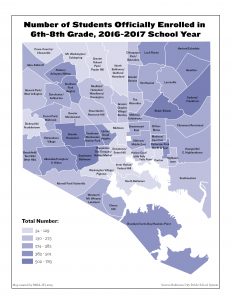
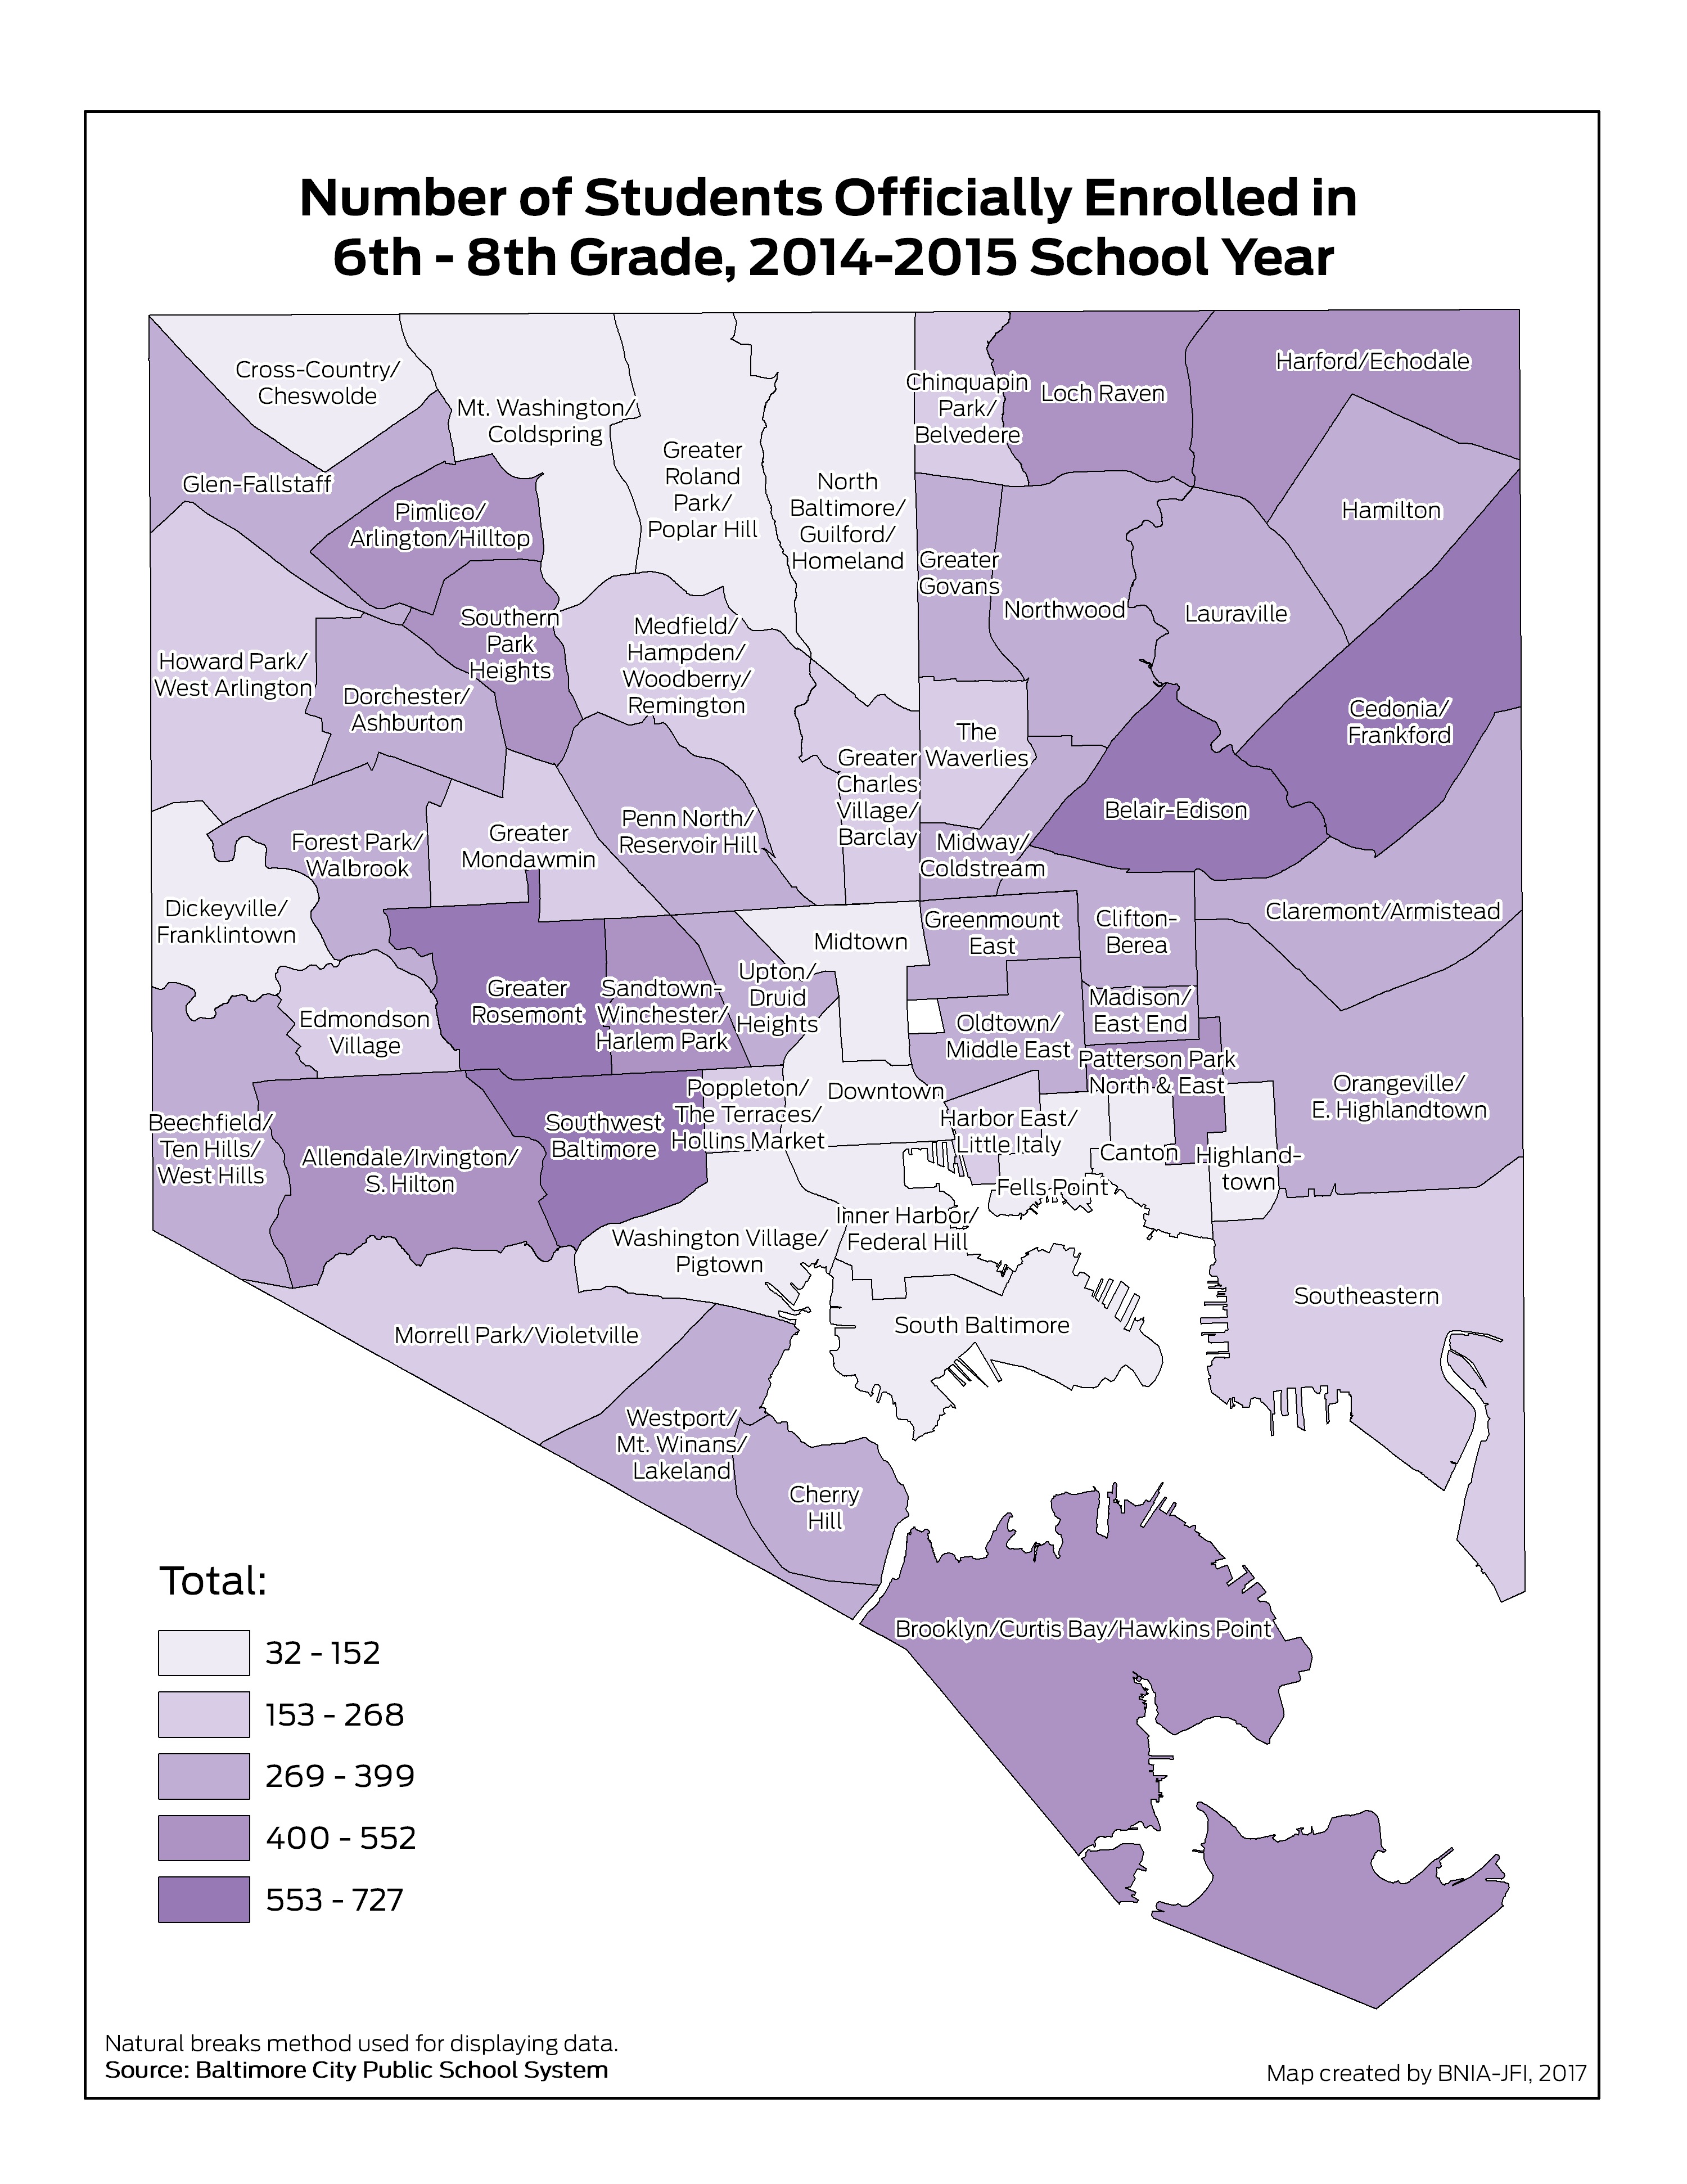
Number of Students Officially Enrolled in 6th – 8th Grade

Number of Students Officially Enrolled in 1st – 5th Grade
Percentage of Population aged 16-19 in School and/or Employed
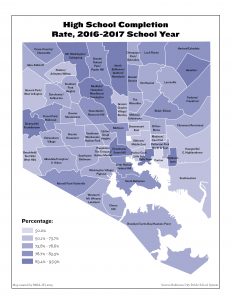
High School Completion Rate
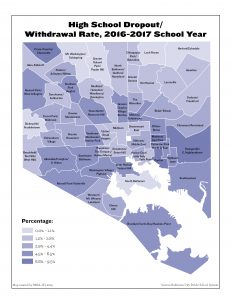
High School Dropout/Withdrawal Rate
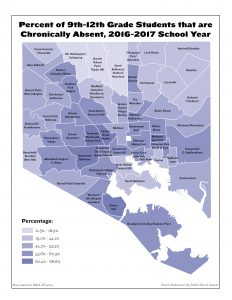
Percent of 9th-12th Grade Students that are Chronically Absent (Missing at least 20 days)
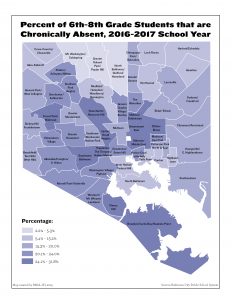
Percent of 6th-8th Grade Students that are Chronically Absent (Missing at least 20 days)
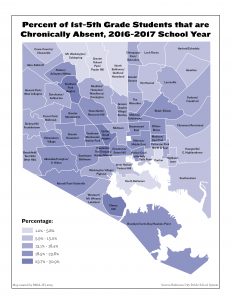
Percent of 1st-5th Grade Students that are Chronically Absent (Missing at least 20 days)
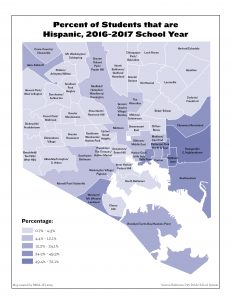
Percent of Students that are Hispanic
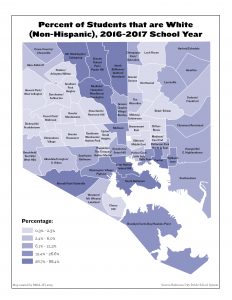
Percent of Students that are White (non-Hispanic)
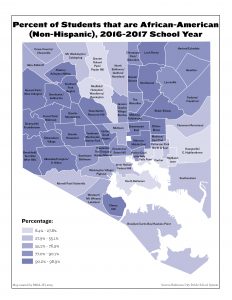
Percent of Students that are African American (non-Hispanic)
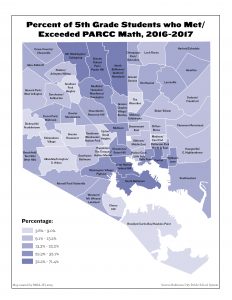
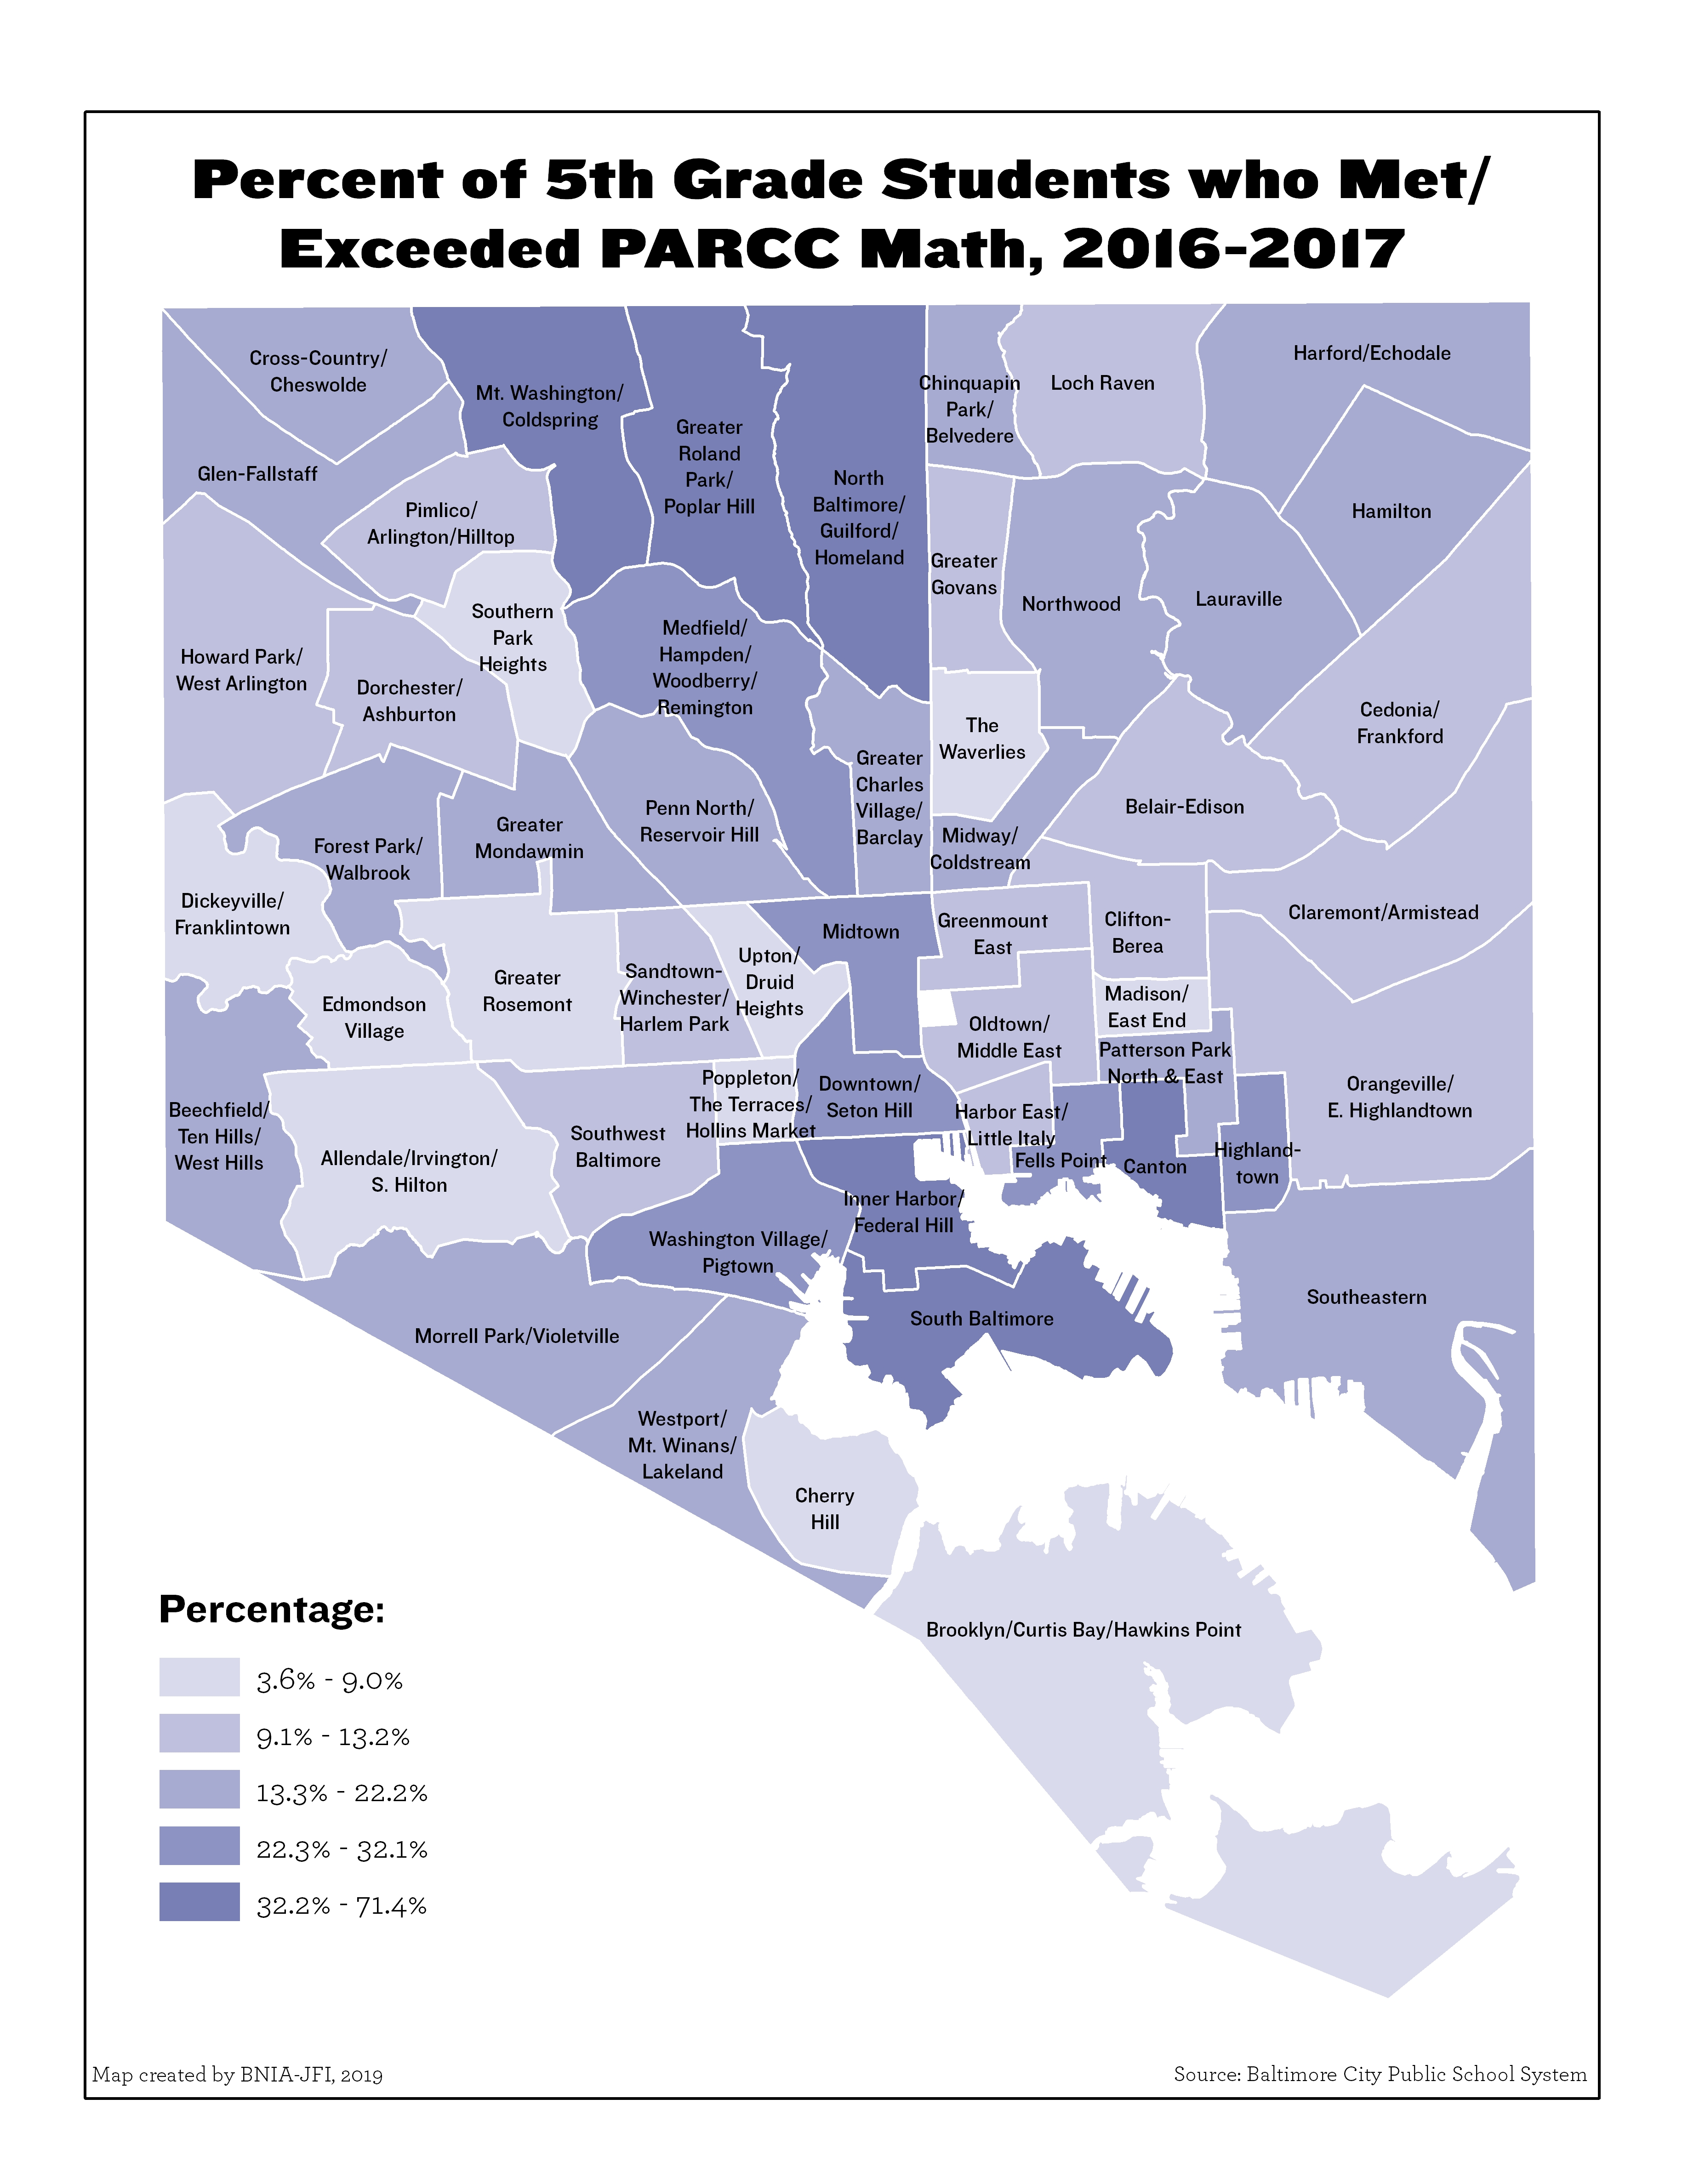
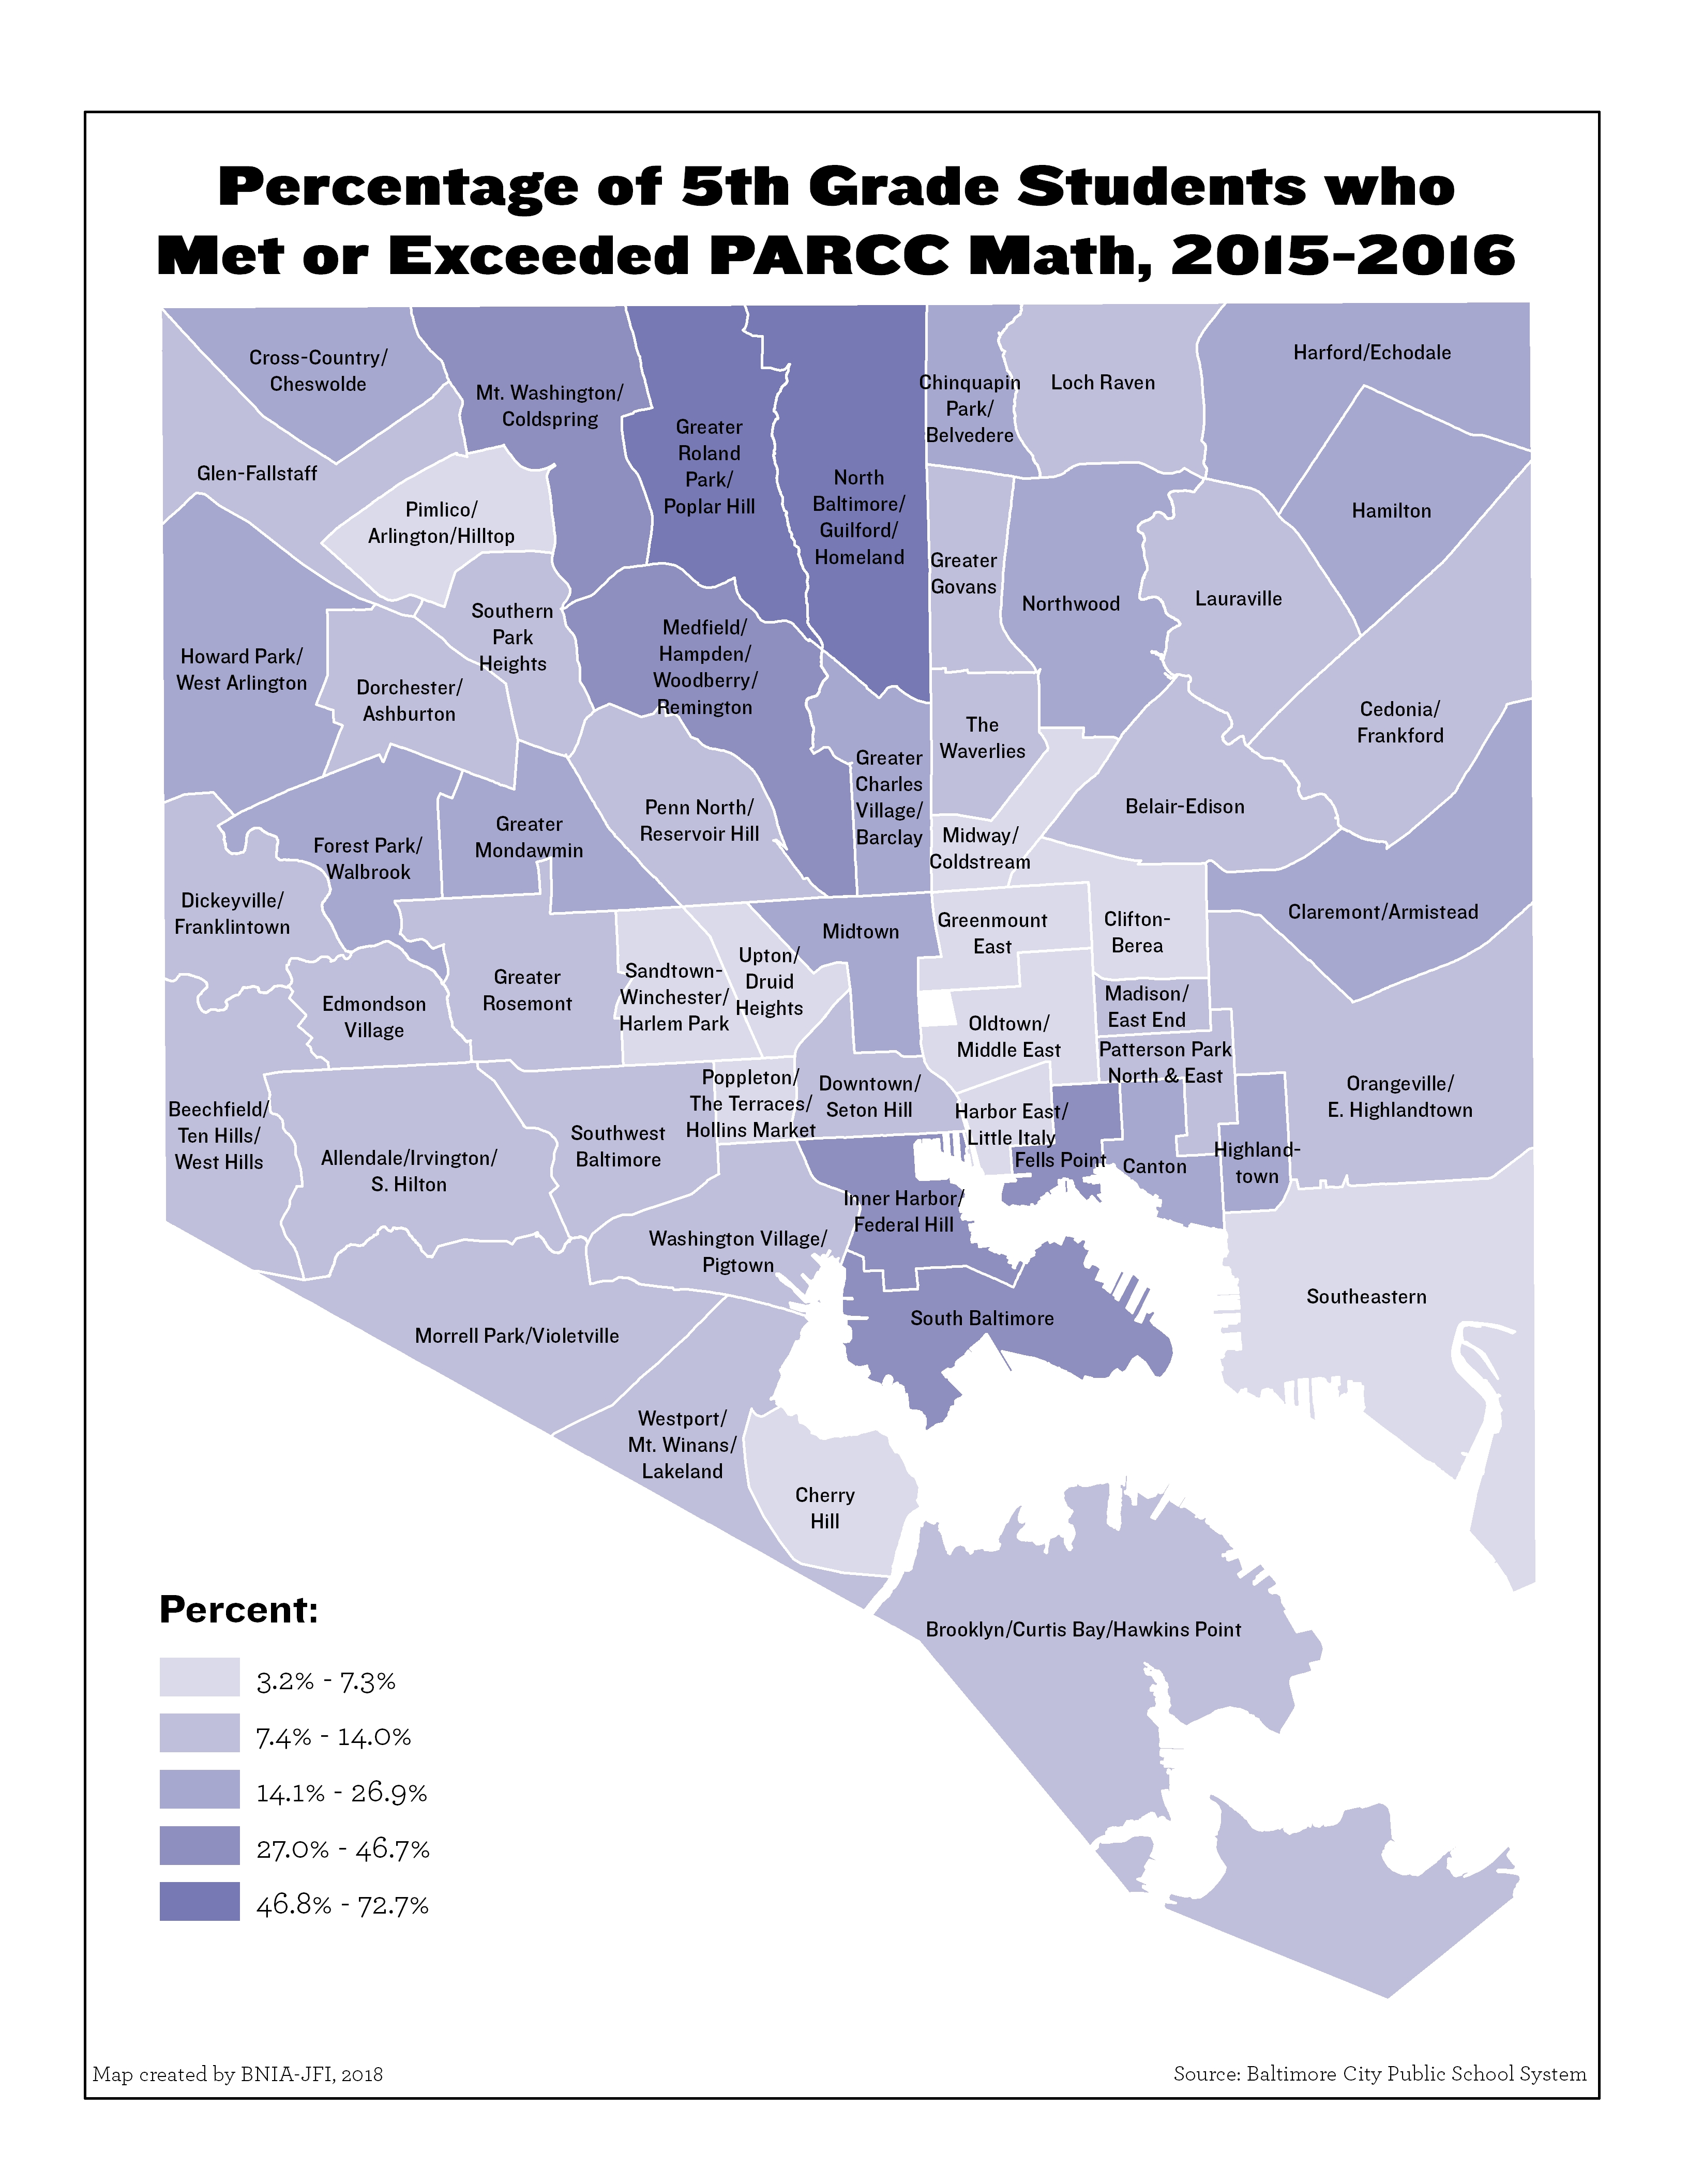
Percentage of 5th Grade Students Passing PARCC Math